R E S E A R C H A R T I C L E
Open Access
Voting-based consensus clustering for combining
multiple clusterings of chemical structures
Faisal Saeed
1,2*, Naomie Salim
1and Ammar Abdo
3,4Abstract
Background:Although many consensus clustering methods have been successfully used for combining multiple classifiers in many areas such as machine learning, applied statistics, pattern recognition and bioinformatics, few consensus clustering methods have been applied for combining multiple clusterings of chemical structures. It is known that any individual clustering method will not always give the best results for all types of applications. So, in this paper, three voting and graph-based consensus clusterings were used for combining multiple clusterings of chemical structures to enhance the ability of separating biologically active molecules from inactive ones in each cluster.
Results:The cumulative voting-based aggregation algorithm (CVAA), cluster-based similarity partitioning algorithm (CSPA) and hyper-graph partitioning algorithm (HGPA) were examined. The F-measure and Quality Partition Index method (QPI) were used to evaluate the clusterings and the results were compared to the Ward’s clustering method. The MDL Drug Data Report (MDDR) dataset was used for experiments and was represented by two 2D fingerprints, ALOGP and ECFP_4. The performance of voting-based consensus clustering method outperformed the Ward’s method using F-measure and QPI method for both ALOGP and ECFP_4 fingerprints, while the graph-based consensus clustering methods outperformed the Ward’s method only for ALOGP using QPI. The Jaccard and Euclidean distance measures were the methods of choice to generate the ensembles, which give the highest values for both criteria.
Conclusions:The results of the experiments show that consensus clustering methods can improve the
effectiveness of chemical structures clusterings. The cumulative voting-based aggregation algorithm (CVAA) was the method of choice among consensus clustering methods.
Background
Chemoinformatics, as defined by Brown [1], is the col-lection, representation and organisation of chemical data in order to create chemical information, which is applied to create chemical knowledge. It has been used for the process of drug discovery and design, especially in the lead identification and optimisation process, which is known as High-Throughput Screening (HTS).
According to Brown and Martin [2], the advent of high-throughput biological screening methods has given pharmaceutical companies the ability to screen many thousands of compounds in a short time. However, there
are many hundreds of thousands of compounds available both in-house and from commercial vendors. Whilst it may be feasible to screen many, or all, of the compounds available, this is undesirable for reasons of cost and time and may be unnecessary if it results in the production of some redundant information. Therefore, there has been a great deal of interest in the use of compound cluster-ing techniques to aid in the selection of a representative subset of all the compounds available [3]. Given a clus-tering method, which can group structurally similar compounds together, and application of the similar
property principle[4], which states that structurally simi-lar molecules will exhibit simisimi-lar physicochemical and biological properties, implies that the selection, or syn-thesis, and testing of representatives from each cluster produced from a set of compounds should be sufficient to understand the structure-activity relationships of the
* Correspondence:[email protected]
1
Faculty of Computer Science and Information Systems, University Technology of Malaysia, Johor, Malaysia
2
Information Technology Department, Sanhan Community College, Sana'a, Yemen
Full list of author information is available at the end of the article
whole set, without the need to test them all. An appro-priate clustering method will, ideally, cluster all similar compounds together whilst separating active and in-active compounds into different sets of clusters [2].
The main objective of clustering is to subdivide data objects into smaller groups known as clusters so that each group exhibits a high degree of intra-cluster simi-larity and inter-cluster dissimisimi-larity [5]. Many different types of clustering techniques for chemical structures have been used in the literature [6-13].
Brown and Martin [2] considered the Ward’s clustering to be the most efficient method in cluster-based com-pound selection. However, as it is known, there is no clus-tering method capable of correctly finding the underlying structure for all data sets. So, the idea of combining differ-ent clustering results (consensus clustering) is considered as an alternative approach for improving the quality of the individual clustering algorithms [14].
Consensus clustering involves two main steps: (i) par-titions generation and (ii) consensus function. In the first step, many partitions will be generated (the collection of partitions is called ensemble). There are no constraints about how the partitions must be generated. In the par-titions generation step, many mechanisms can be applied including the using of: (i) different data representations, (ii) different individual clustering methods, (iii) different parameters initialisation for clustering methods and (iv) data resampling. In the second step, there are two main approaches, i.e. the objects co-occurrence-based and the median partition-based approaches. Voting and graph based consensus clusterings are widely used for the first approach.
Topchy et al. [15] and Fred and Jain [16] summarised the main advantages of using consensus clustering in the following terms:
Robustness: The combination process must have better average performance than the single clustering algorithms.
Consistency: The result of the combination should be somehow, very similar to all combined single clustering algorithm results.
Novelty: Cluster ensembles must allow finding solutions unattainable by single clustering algorithms.
Stability: Results with lower sensitivity to noise and outliers.
In chemoinformatics, it is most unlikely that any single method will yield the best classification under all circum-stances, even if attention is restricted to a single type of application [17]. Furthermore, the consensus scoring (data fusion) has been successfully used in chemoinfor-matics and, in particular, for virtual screening [18-25].
Over the last few years, data fusion has become accepted as a simple way of enhancing the performance of existing systems for ligand-based virtual screening by combining the results of two or more screening meth-ods. In some cases, the fused search may even be better than the best individual screening method when aver-aged over large numbers of searches [20].
Chuet al. [17] used consensus clustering methods on
sets of chemical compounds represented by 2D finger-prints (ECFP_4), and concluded that consensus methods can outperform the Ward's method, the current stand-ard clustering method for chemoinformatics applica-tions. However, based on the implemented methods, it was not the case if the clustering is restricted to a single consensus method. In this paper, we examined the use of voting and graph-based consensus clustering methods for combining multiple clusterings of chemical struc-tures with different distance measures in order to im-prove the effectiveness of chemical structures clustering.
Experimental Molecular fingerprints
For the clustering experiments, two molecular finger-prints were developed by Scitegic’s Pipeline Pilot soft-ware [26]. The first one was 120-bit ALOGP, which includes octanol-water partitioning coefficient based on Ghose and Crippen’s method [27,28]. ALOGP atom type code is generated based on the molecular hydrophobicity (lipophilicity), usually quantified as log P (the logarithm of 1-octanol/water partition coefficient), which is an im-portant molecular characteristic in drug discovery [28]. The second descriptor was the Scitegic extended-connectivity fingerprints (1024 ECFP_4). The first char-acter E in the fingerprint name denotes the atom ab-straction method used to assign initial atom code which is derived from the number of connections to an atom, the element type, the charge and the atomic mass [29].
Dataset
pairwise Tanimoto similarity were conducted using Pipe-line Pilot software. The MDDR dataset contains eleven ac-tivity classes (8294 molecules) and the details of this dataset are listed in Table 1. Each row in the table contains an activity class, the number of molecules belonging to the class and the diversity of the class.
Ensemble generation
Every consensus clustering method is made up of two steps: (i) partitions generation and (ii) consensus func-tions. For the purposes of this paper, the partitions were generated by a single run of multiple individual clustering algorithms (single-linkage, complete linkage, average link-age, weighted average distance, Ward and K-means methods). Every individual clustering used six distance measures in order to generate different ensembles. The thresholds of 500, 600, 700, 800, 900 and 1000 were used to generate partitions with different sizes (number of clusters). The same process was done for each 2D finger-print in order to study the effectiveness of consensus clusterings on different molecular representations. The distance measures that were used with each clustering technique were Correlation, Cosine, Euclidean, Hamming, Jaccard and Manhattan.
Methods
Graph-based consensus clustering
Two graph-based consensus clustering algorithms, pro-posed by Strehl and Gosh [34], were used to obtain the consensus partition from ensembles generated in the pre-vious step. The two algorithms were developed based on transforming the set of clusterings into a hyper-graph rep-resentation. The first algorithm is Cluster-based Similarity Partitioning Algorithm (CSPA) in which a clustering signi-fies a relationship between objects in the same cluster and
can thus be used to establish a measure of pairwise simi-larity. Because of this similarity measure, CSPA is also categorized under consensus similarity matrix methods. The second algorithm is the Hyper-Graph Partitioning Al-gorithm (HGPA) in which the cluster ensemble problem is formulated as partitioning the hyper-graph by cutting a minimal number of hyper-edges. Both algorithms were coded by the published cluster ensemble package that is available on (www.strehl.com).
For CSPA, the similarity matrix is generated so that each two objects have a similarity of 1 if they are in the same cluster and 0 otherwise. The process is repeated for each clustering method. A n× n binary similarity matrix S is created where n is the total number of objects in the dataset. The entries ofS are divided by r, which is the number of clustering methods. Then, the similarity matrix is used to re-cluster the objects using any reasonable similarity-based clustering algorithm. Here, we view the similarity matrix as graph (vertex = object, edge weight = similarity) and cluster it using graph partitioning algorithm METIS [35] because of its robust and scalable properties in order to obtain the consensus partition.
The HGPA portions the hyper-graph directly. This is done by removing the lower number of hyper-edges. All hyper-edges have the same weight and are searched by cutting the minimum possible number of hyper-edges that partition the hyper-graph in k connected components of approximately the same dimension. For the implementa-tion of this method, the hyper-graphs partiimplementa-tioning package HMETIS [36] was used.
Voting-based consensus clustering
The cumulative voting-based aggregation algorithm con-sists of two steps; the first one is to obtain the optimal re-labeling for all partitions, which is known as the voting problem. Then, the voting-based aggregation algorithm is used to obtain the aggregated (consensus) partition. The voting-based aggregation algorithm described by Ayed and Kamel [37,38] is modified to be used in this paper.
Letχdenote a set ofndata objects, and let a partition of χinto kclusters be represented by an n×k matrix U such thatPqk= 1ujq= 1, for∀j. Letu= {Ui}ib= 1denote an ensemble of partitions. The voting-based aggregation problem is concerned with searching for an optimal re-labeling for each partitionViwith respect to representa-tive partition U0 (with k0 clusters) and for a central aggregated partition denoted as Ū that summarises the ensemble partitions. The matrix of coefficients Wi, which is a ki × k0 matrix of wlqi coefficients, is used to obtain the optimal relabeling for ensemble partitions.
In this paper, the fixed-reference approach is used, whereby an initial reference partition is used as a com-mon representative partition for all the ensemble
Table 1 MDDR dataset activity classes Activity
Index
Activity class Active
molecules
Pairwise similarity
Mean
31420 Renin Inhibitors 1130 0.290
71523 HIV Protease Inhibitors 750 0.198
37110 Thrombin Inhibitors 803 0.180
31432 Angiotensin II AT1 Antagonists
943 0.229
42731 Substance P Antagonists 1246 0.149
06233 Substance P Antagonists 752 0.140
06245 5HT Reuptake Inhibitors 359 0.122
07701 D2 Antagonists 395 0.138
06235 5HT1A Agonists 827 0.133
78374 Protein Kinase C Inhibitors 453 0.120
partitions and remains unchanged throughout the aggre-gation process. Instead of selecting random partition, the partition that is generated by the method, which showed high ability to separate active from inactive molecules in our experiments, is suggested to be the reference partition U0; and this method is the Ward’s clustering (the current standard clustering method for Chemoinformatics applications). The cumulative voting-based aggregation algorithm is described as follows:
Cumulative Voting-based Aggregation Algorithm
1. select a partitionUi∈uwhich is generated by the Ward’s method and assign toU0
2. fori=1 tobdo 3. Wi= (UiTUi)−1UiTU0 4. Vi= UiWi
5.U0¼ii1U0þ1iVi 6. end for
7.Ū=U0.
Performance evaluation
The results were evaluated based on the effectiveness of the methods to separate active from inactive molecules using two measures: the F-measure [39] and Quality Partition Index (QPI) measure [40]. As defined by [17], if the cluster containsncompounds, that aof these are active and that there is a total of Acompounds with the chosen Activity. The precision,P, and the recall,R, for that cluster are:
P¼an ð1Þ
R¼Aa ð2Þ
F¼P2þPRR ð3Þ
This calculation is carried out on each cluster and the F-measure is the maximum value across all clusters.
In addition, according to [13], an active cluster can be defined as a non-singleton cluster for which the percent-age of active molecules in the cluster is greater than the percentage of active molecules in the dataset as a whole. Let p be the number of actives in active clusters, q be the number of inactives in active clusters,rbe the num-ber of actives in inactive clusters (i.e., clusters that are not active clusters) and s be the number of singleton actives. The high value occurs when the actives are clus-tered tightly together and separated from the inactive molecules. The QPI is defined to be:
QPI¼pþqpþrþs ð4Þ
Results and discussion
The ensembles were generated by running the six indi-vidual clusterings, each with the six distance measures. Then, the ensembles were combined using voting and graph-based consensus clustering methods: CVAA, CSPA and HGPA. This process was repeated for each fingerprint (ALOGP and ECFP_4).
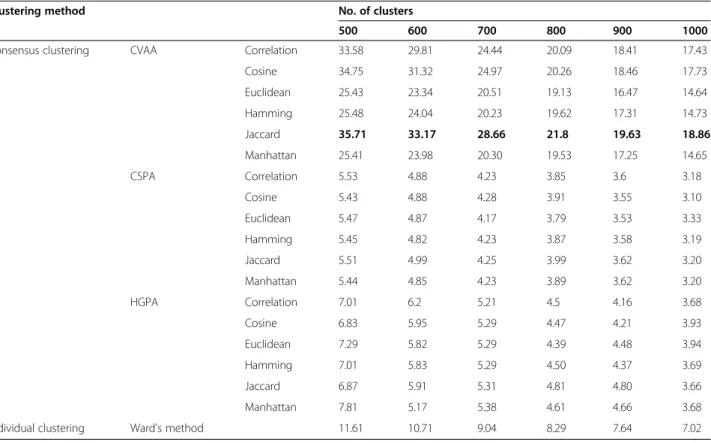
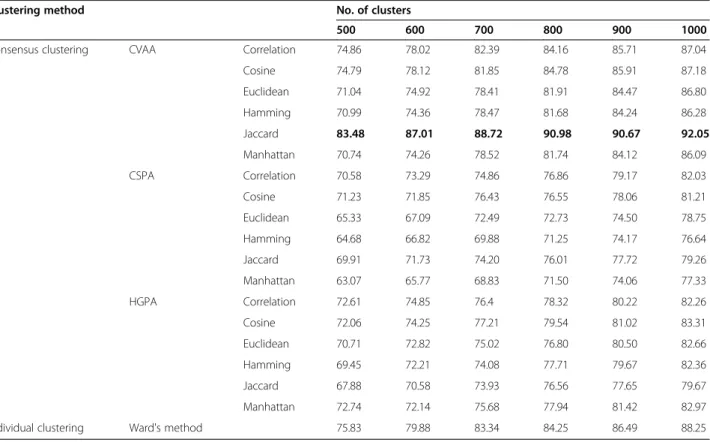
The mean of F-measure and QPI values were averaged over the eleven activity classes of the dataset. Tables 2, 3, 4 and 5 show the effectiveness of MDDR dataset cluster-ing for ALOGP and ECFP_4 fcluster-ingerprints. In all tables, the best values for F-measure and QPI of consensus clustering methods for each column were bold-faced for ease of reference.
Visual inspection of F-measure and QPI values in Tables 2, 3, 4 and 5 enables comparisons to be made be-tween the effectiveness of three consensus clustering methods and the Ward’s method. In addition, two fin-gerprints were used for the experiments in order to study the effectiveness of consensus clustering on differ-ent represdiffer-entations of molecular dataset.
For clustering of MDDR dataset which is represented by ALOGP fingerprint (Tables 2 and 4), the performance of voting-based consensus method (CVAA) outper-formed the Ward’s method and the graph-based consen-sus methods (CSPA and HGPA) using the two criteria: F-measure and QPI. The highest F-measure values were obtained by using Euclidean distance measure with indi-vidual clustering methods in the ensemble generation step. While, using the QPI measure, the highest values were obtained by using the Jaccard distance measure. Moreover, the ensembles generated by the other distance measures showed a better performance of CVAA than Ward and graph-based consensus clustering methods using both criteria.
Similarly, the results in Tables 3 and 5 show that, when ECFP_4 fingerprint is used, the CVAA consensus clustering performed very well and outperformed Ward and graph-based consensus clustering methods using F and QPI measures. The Jaccard distance measure was the method of choice to generate the ensembles, which gives the highest values for both criteria.
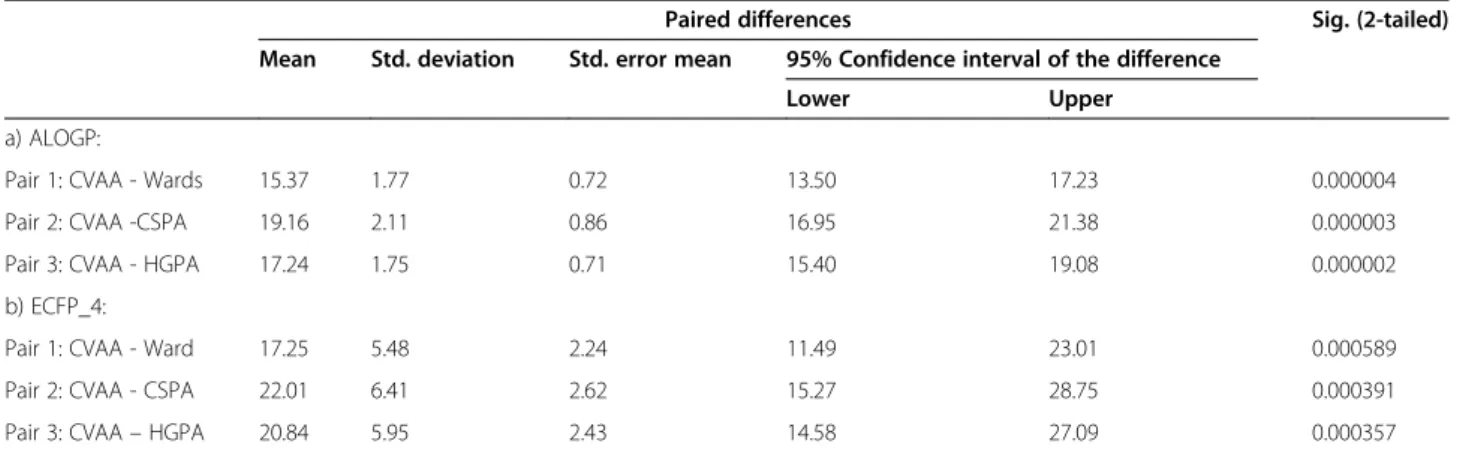
Some statistical significance tests (T-tests) were per-formed to show the improvements achieved by the con-sensus clustering methods, as shown in Tables 6 and 7. It was found that the performance of voting-based con-sensus method is statistically significant when using both criteria.
Table 3 Effectiveness of clustering of MDDR dataset using F-Measure: ECFP_4 Fingerprint
Clustering method No. of clusters
500 600 700 800 900 1000
Consensus clustering CVAA Correlation 33.58 29.81 24.44 20.09 18.41 17.43
Cosine 34.75 31.32 24.97 20.26 18.46 17.73
Euclidean 25.43 23.34 20.51 19.13 16.47 14.64
Hamming 25.48 24.04 20.23 19.62 17.31 14.73
Jaccard 35.71 33.17 28.66 21.8 19.63 18.86
Manhattan 25.41 23.98 20.30 19.53 17.25 14.65
CSPA Correlation 5.53 4.88 4.23 3.85 3.6 3.18
Cosine 5.43 4.88 4.28 3.91 3.55 3.10
Euclidean 5.47 4.87 4.17 3.79 3.53 3.33
Hamming 5.45 4.82 4.23 3.87 3.58 3.19
Jaccard 5.51 4.99 4.25 3.99 3.62 3.20
Manhattan 5.44 4.85 4.23 3.89 3.62 3.20
HGPA Correlation 7.01 6.2 5.21 4.5 4.16 3.68
Cosine 6.83 5.95 5.29 4.47 4.21 3.93
Euclidean 7.29 5.82 5.29 4.39 4.48 3.94
Hamming 7.01 5.83 5.29 4.50 4.37 3.69
Jaccard 6.87 5.91 5.31 4.81 4.80 3.66
Manhattan 7.81 5.17 5.38 4.61 4.66 3.68
Individual clustering Ward's method 11.61 10.71 9.04 8.29 7.64 7.02
Table 2 Effectiveness of clustering of MDDR dataset using F-Measure: ALOGP Fingerprint
Clustering method No. of clusters
500 600 700 800 900 1000
Consensus clustering CVAA Correlation 26.80 21.96 18.96 18.49 17.6 15.45
Cosine 24.79 21.72 19.01 18.19 16.46 14.81
Euclidean 27.96 23.75 22.68 24.30 21.17 19.95
Hamming 24.02 20.48 16.31 16.85 14.95 14.68
Jaccard 23.58 21.96 18.01 18.46 16.72 15.35
Manhattan 27.03 25.23 21.16 20.36 19.10 19.05
CSPA Correlation 5.06 4.65 4.16 3.56 3.35 3.04
Cosine 5.17 4.65 4.08 3.62 3.37 3.05
Euclidean 5.12 4.64 4.04 3.61 3.38 3.00
Hamming 5.30 4.74 4.16 3.62 3.54 3.13
Jaccard 5.31 4.82 4.15 3.77 3.48 3.13
Manhattan 5.33 4.80 4.21 3.62 3.45 3.05
HGPA Correlation 7.13 5.48 5.45 4.65 4.35 4.37
Cosine 8.06 6.04 5.03 4.52 4.45 4.08
Euclidean 7.08 6.55 5.65 4.67 4.56 4.60
Hamming 8.37 5.73 4.94 5.29 4.97 4.93
Jaccard 7.63 6.22 5.98 4.53 5.24 3.92
Manhattan 7.72 6.48 5.23 5.35 4.90 4.12
Table 4 Effectiveness of clustering of MDDR dataset using QPI: ALOGP Fingerprint
Clustering method No. of clusters
500 600 700 800 900 1000
Consensus clustering CVAA Correlation 43.84 47.38 48.72 50.70 53.41 54.06
Cosine 45.60 46.08 47.56 50.46 53.79 54.50
Euclidean 44.43 45.54 47.95 48.65 52.68 54.86
Hamming 53.13 56.08 59.07 60.58 64.02 67.76
Jaccard 57.86 60.62 64.07 66.49 70.68 73.53
Manhattan 56.01 58.10 60.99 61.86 64.56 65.97
CSPA Correlation 46.81 50.04 51.72 51.78 54.23 56.36
Cosine 46.04 49.49 51.42 52.11 54.48 55.92
Euclidean 46.20 49.86 51.05 51.88 54.36 56.33
Hamming 54.67 58.50 60.27 61.78 62.33 65.66
Jaccard 55.03 59.13 60.84 61.03 63.73 67.44
Manhattan 55.08 59.00 59.10 60.84 61.78 64.61
HGPA Correlation 47.59 49.51 52.39 54.45 56.86 58.56
Cosine 45.58 48.44 52.78 54.42 56.36 58.70
Euclidean 46.92 51.41 53.20 54.75 57.00 58.97
Hamming 55.24 58.48 60.30 63.99 68.21 69.22
Jaccard 55.71 59.89 64.10 65.15 70.48 71.60
Manhattan 54.84 58.98 62.73 63.58 65.85 69.97
Individual clustering Ward's method 52.33 54.86 56.90 59.00 61.33 63.17
Table 5 Effectiveness of clustering of MDDR dataset using QPI: ECFP_4 Fingerprint
Clustering method No. of clusters
500 600 700 800 900 1000
Consensus clustering CVAA Correlation 74.86 78.02 82.39 84.16 85.71 87.04
Cosine 74.79 78.12 81.85 84.78 85.91 87.18
Euclidean 71.04 74.92 78.41 81.91 84.47 86.80
Hamming 70.99 74.36 78.47 81.68 84.24 86.28
Jaccard 83.48 87.01 88.72 90.98 90.67 92.05
Manhattan 70.74 74.26 78.52 81.74 84.12 86.09
CSPA Correlation 70.58 73.29 74.86 76.86 79.17 82.03
Cosine 71.23 71.85 76.43 76.55 78.06 81.21
Euclidean 65.33 67.09 72.49 72.73 74.50 78.75
Hamming 64.68 66.82 69.88 71.25 74.17 76.64
Jaccard 69.91 71.73 74.20 76.01 77.72 79.26
Manhattan 63.07 65.77 68.83 71.50 74.06 77.33
HGPA Correlation 72.61 74.85 76.4 78.32 80.22 82.26
Cosine 72.06 74.25 77.21 79.54 81.02 83.31
Euclidean 70.71 72.82 75.02 76.80 80.50 82.66
Hamming 69.45 72.21 74.08 77.71 79.67 82.36
Jaccard 67.88 70.58 73.93 76.56 77.65 79.67
Manhattan 72.74 72.14 75.68 77.94 81.42 82.97
method), (CVAA, CSPA) and (CVAA, HGPA)) com-pared in the paired samples t-test procedure. The paired-samples t-test procedure compares the means of two variables that represent the same group at different cluster size. Since the paired samples t-test compares the means for the two variables, it is quite useful to know what the mean values are. A low significance value for the t-test (typically less than 0.05) indicates that there is a significant difference that was satisfied between two variables. In Tables 6 and 7, it was noted that the signifi-cance field (Sig. (2-tailed)) in terms of F-measure for AlogP is: CVAA-Ward’s method (0.000004), CVAA-CSPA (0.000003) and CVAA-HGPA (0.000002), and for ECFP_4: CVAA-Ward’s method (0.000589), CVAA-CSPA (0.000391) and CVAA-HGPA (0.000357). Simi-larly, the significance field (Sig. (2-tailed)) in terms of QPI values for AlogP is: CVAA-Ward’s method (0.000199), CVAA-CSPA (0.004290) and CVAA-HGPA (0.013842), and for ECFP_4 is: CVAA -Ward’s method (0.000301), CVAA-CSPA (0.000005) and CVAA-HGPA (0.000010). In addition, the significance value is low in F-measure and QPI values and the confidence interval for the mean difference does not contain zero. It is then concluded that the consensus clustering method, CVAA,
obtained significant results by using F-measure and QPI values compared to Ward and graph-based consensus clustering methods. Moreover, the CVAA method is more efficient because the computational complexity of CVAA is O (n) which is better than other consensus clustering methods such as CSPA that has complexity of O (n2), where n is the number of data objects [14].
Conclusions
The experiments results show that consensus clustering methods can improve the effectiveness of chemical structures clusterings. The cumulative voting-based ag-gregation algorithm CVAA was the method of choice among consensus clustering methods. The performance of CVAA consensus clustering significantly outperforms Ward and graph-based consensus clustering methods (CSPA and HGPA) using F and QPI measures for both ALOGP and ECFP_4 fingerprints, while the graph-based consensus methods outperform the Ward’s method only for ALOGP using QPI measure. The experiments reported here suggest that voting-based consensus clus-tering can perform very well when the partitions are gen-erated by a single run of multiple individual clusterings
Table 7 T-test statistical significance testing using QPI measure
Paired differences Sig. (2-tailed)
Mean Std. deviation Std. error mean 95% Confidence interval of the difference
Lower Upper
a) ALOGP:
Pair 1: CVAA - Wards 7.61 1.92 0.78 5.58 9.63 0.000199
Pair 2: CVAA -CSPA 4.20 2.08 0.85 2.02 6.39 0.004290
Pair 3: CVAA - HGPA 1.62 1.06 0.43 0.49 2.74 0.013842
b) ECFP_4:
Pair 1: CVAA - Ward 5.81 1.60 0.65 4.12 7.49 0.000301
Pair 2: CVAA - CSPA 12.31 1.49 0.61 10.74 13.88 0.000005
Pair 3: CVAA–HGPA 10.77 1.50 0.61 9.20 12.34 0.000010
Table 6T-test statistical significance testing using F-measure
Paired differences Sig. (2-tailed)
Mean Std. deviation Std. error mean 95% Confidence interval of the difference
Lower Upper
a) ALOGP:
Pair 1: CVAA - Wards 15.37 1.77 0.72 13.50 17.23 0.000004
Pair 2: CVAA -CSPA 19.16 2.11 0.86 16.95 21.38 0.000003
Pair 3: CVAA - HGPA 17.24 1.75 0.71 15.40 19.08 0.000002
b) ECFP_4:
Pair 1: CVAA - Ward 17.25 5.48 2.24 11.49 23.01 0.000589
Pair 2: CVAA - CSPA 22.01 6.41 2.62 15.27 28.75 0.000391
that use Jaccard and Euclidean distance measures in the ensemble generation process.
Competing interests
The authors declare that they have no competing interests.
Authors’contributions
FS is a PhD candidate and performed the experiments under the supervision of NS and AA. All authors read and approved the final manuscript.
Acknowledgements
This work is supported by the Ministry of Higher Education (MOHE) and Research Management Centre (RMC) at the Universiti Teknologi Malaysia (UTM) under Research University Grant Category (VOT Q.
J130000.7128.00H72). We also would like to thank MIS-MOHE for sponsoring the first author.
Author details
1Faculty of Computer Science and Information Systems, University
Technology of Malaysia, Johor, Malaysia.2Information Technology Department, Sanhan Community College, Sana'a, Yemen.3Department of Computer Science, Alhodaida University, Alhodaida, Yemen.4LIFL UMR CNRS 8022 Universite0Lille 1 and INRIA Lille Nord Europe, 59655 Villeneuve d’Ascq cedex, Lille, France.
Received: 24 September 2012 Accepted: 11 December 2012 Published: 17 December 2012
References
1. Brown FK:Chemoinformatics: what is it and how does it impact drug discovery.Annu Rep Med Chem1998,33:375–384.
2. Brown RD, Martin YC:Use of activity data to compare structure-based clustering methods and descriptors for use in compound selection.J Chem Inf Comput Sci1996,36:572–584.
3. Willett P, Winterman V, Bawden D:Implementation of non-hierarchic cluster analysis methods in chemical information systems: selection of compounds for biological testing and substructure search output. J Chem Inf Comput Sci1986,26:109–118.
4. Johnson M, Maggiora GM:Concepts and Applications of Molecular Similarity. New York: Wiley; 1990.
5. Everitt BS, Landau S, Leese M:Cluster Analysis. 4th edition. London: Edward Arnold; 2001.
6. Adamson GW, Bush JA:A method for the automatic classification of chemical structures.Information Storage and Retrieval1973,9:561–568. 7. Downs GM, Barnard JM:Clustering of chemical structures on the basis of
two-dimensional similarity measures.J Chem Inf Comput Sci1992,32:644–649. 8. Willett P:Similarity and Clustering in Chemical Information Systems.
Letchworth: Research Studies Press; 1987.
9. Downs GM, Willett P, Fisanick W:Similarity searching and clustering of chemical-structure databases using molecular property data.J Chem Inf Comput Sci1994,34:1094–1102.
10. Brown RD, Martin YC:The information content of 2D and 3D structural descriptors relevant to ligand–receptor binding.J Chem Inf Comput Sci 1997,37:1–9.
11. Schuffenhauer A, Brown N, Ertl P, Jenkins JL, Selzer P, Hamon J:Clustering and rule-based classifications of chemical structures evaluated in the biological activity space.J Chem Inf Model2007,47(2):325–336. 12. Holliday JD, Rodgers SL, Willet P:Clustering files of chemical structures
using the fuzzy k-means clustering method.J Chem Inf Comput Sci2004, 44:894–902.
13. Varin T, Bureau R, Mueller C, Willett P:Clustering files of chemical structures using the Székely–Rizzo generalization of Ward's method. J Mol Graph Model2009,28(2):187–195.
14. Vega-Pons S, Ruiz-Schulcloper J:A survey of clustering ensemble algorithms. Int J Pattern Recognit Artificial Intelligence2011,25(Issue 3):337–372. 15. Topchy A, Jain AK, Punch W:A mixture model of clustering ensembles.In
Proc. SIAM Intl. Conf. on Data Mining. 2004.
16. Fred ALN, Jain AK:Combining multiple clustering using evidence accumulation.IEEE Trans Patt Anal Mach Intell2005,27:835–850.
17. Chu C-W, Holliday J, Willett P:Combining multiple classifications of chemical structures using consensus clustering.Bioorgan Med Chem2012, 20(18):5366–5371.
18. Feher M:Consensus scoring for protein-ligand interactions.Drug Discov Today2006,11:421–428.
19. Salim N, Holliday JD, Willett P:Combination of fingerprint-based similarity coefficients using data FusionJ.Chem Inf Comput Sci2003,43:435–442. 20. Willet P:Enhancing the effectiveness of ligand-based virtual screening
using data fusion.QSAR Comb Sci2006,25:1143–1152.
21. Hert J, Willett P, Wilton DJ, Acklin P, Azzaoui K, Jacoby E, Schuffenhauer A: New methods for ligand-based virtualscreening: use of data fusion and machinelearning to enhancethe effectiveness of similarity searching. J Chem Inf Model2006,46:462–470.
22. Whittle M, Gillet VJ, Willett P:Analysis of data fusion methods in virtual screening: Similarity and group fusion.J Chem Inf Model2006,6:2206–2219. 23. Chen B, Mueller C, Willett P:Combination rules for GroupFusion in
similarity-based virtual screening.MolInf2010,29:533–541.
24. Rivera-Borroto OM, Marrero-Ponce Y, García de la Vega JM, Grau-Ábalo RC: Comparison of combinatorial clustering methods on pharmacological data sets represented by machine learning-selected real molecular descriptors.J Chem Inf Model2011,51(12):3036–3049.
25. Svensson F, Karlen A, Skold C:Virtual Screening DataFusion Using Both Structure- and Ligand-Based Methods. Model: J. Chem. Inf; 2011.
26. Pipeline Pilot software:SciTegic Accelrys Inc. San Diego: Accelrys Inc website; 2008. http://www.accelrys.com/.
27. Ghose AK, Crippen GM:Atomic physicochemical parameters for three-dimensional structure-directed quantitative structure-activity relationships 1. Partition coefficients as a Measure of hydrophobicity. J Comput Chem1986,7:565–577.
28. Ghose AK, Viswanadhan VN, Wendoloski JJ:Prediction of hydrophobic (lipophilic) properties of small organic molecules using fragmental methods: An analysis of ALOGP and CLOGP methods.J Phys Chem A 1998,102:3762–3772.
29. Chen L, Li Y, Zaho Q, Peng H, Hou T:ADME evaluation in drug discovery. 10. Predictions of Pglycoprotein inhibitors using recursive partitioning and naive Bayesian classification techniques.Mol Pharm2011,8:889–900. 30. Sci Tegic Accelrys Inc., the MDL Drug Data Report (MDDR). database is
available from at http://www.accelrys.com/ (accessed 1st of November 2012).
31. Abdo A, Chen B, Mueller C, Salim N, Willett P:Ligand-based virtual screening using bayesian networks.J Chem Inf Model2010,50:1012–1020. 32. Abdo A, Salim N:New fragment weighting scheme for the bayesian
inference network in ligand-based virtual screening.J Chem Inf Model 2011,51:25–32.
33. Abdo A, Saeed F, Hentabli H, Ali A, Salim N, Ahmed A:Ligand expansion in ligand-based virtual screening using relevance feedback.J Comput-Aided Mol Des2012,26:279–287.
34. Strehl A, Ghosh J:Cluster ensembles—a knowledge reuse framework for combining multiple partitions.J Machine Learning Res2002,3:583–617. 35. Karypis G, Kumar V:A fast and high quality multilevel scheme for
partitioning irregular graphs.SIAM J Scient Comput1998,20:359–392. 36. Karypis G, Aggarwal R, Kumar V, Shekhar S:Multilevel hypergraph
partitioning: Application in VLSI domain.InProceedings of the 34th annual Design Automation Conference.; 1997:526–529. ACM.
37. Ayad HG, Kamel MS:Cumulative voting consensus method for partitions with a variable number of clusters.IEEE Trans Pattern Anal Mach Intell 2008,30(1):160–173. January.
38. Ayad HG, Kamel MS:On voting-based consensus of cluster ensembles. Patt Recogn2010,43:1943–1953.
39. Van Rijsbergen CJ:Information Retrieval. 2nd edition. London: Butterworths; 1979.
40. Varin T, Saettel N, Villain J, Lesnard A, Dauphin F, Bureau R, Rault SJ:3D Pharmacophore, hierarchical methods, and 5-HT4 receptor binding data. Enzyme Inhib Med Chem2008,23:593–603.
doi:10.1186/1758-2946-4-37