ISSN: 2147-611X
www.ijemst.com
Development and Validation of Robotic
Coding Attitude Scale
Sema Altun Yalcin1, Sakip Kahraman2, Zeynel Abidin Yilmaz3
1
Erzincan Binali Yildirim University
2Canakkale Onsekiz Mart University 3Kilis 7 Aralik University
To cite this article:
Altun Yalcin, S., Kahraman, S., & Yilmaz, Z. A. (2020). Development and validation of
Robotic Coding Attitude Scale.
International Journal of Education in Mathematics, Science
and Technology (IJEMST), 8
(4), 342-352.
This article may be used for research, teaching, and private study purposes.
Any substantial or systematic reproduction, redistribution, reselling, loan, sub-licensing,
systematic supply, or distribution in any form to anyone is expressly forbidden.
Authors alone are responsible for the contents of their articles. The journal owns the
copyright of the articles.
Volume 8, Number 4, 2020
Development and Validation of Robotic Coding Attitude Scale
Sema Altun Yalcin, Sakip Kahraman, Zeynel Abidin Yilmaz
Article Info
Abstract
Article History
Received: 25 January 2020
This study aimed to develop a reliable and valid instrument to measure secondary school students’ attitude towards robotic coding and the results of the analyses regarding the Robotic Coding Attitude Scale (RCAS) developed for this purpose were reported in the current study. To test the construct validity of the first version of the RCAS consisting of 29 items, Exploratory Factor Analysis (EFA) was performed on the data from 196 seventh-grade secondary school students (who had received robotic coding education already) enrolled in the public schools in a city in the northeastern Turkey. As a result of the EFA, the item five-factor model was extracted. Then, the 22-item five-factor model obtained from EFA was cross-validated using Confirmatory Factor Analysis (CFA) and the results indicated acceptable model fits where χ2
/(df = 197) = 1.827, NFI = .825, CFI = .911, RMSEA = .065. Cronbach’s Alpha coefficient which was calculated to show whether the RCAS is a reliable scale was found to be .91. In sum, the results indicated that RCAS can be used as a reliable and valid instrument to measure secondary school students’ attitude towards robotic coding.
Accepted: 30 July 2020
Keywords
Robotic coding Attitude Validity Reliability Scale development
Introduction
Information and communication technology (ICT) which has improved at an astonishing rate in recent years is one of the sectors which enable countries to take a position in international economic trade. In parallel with the development of this sector, the need for professionals who have software developer skills increases gradually (Kazakoff, Sullivan, & Bers, 2013). Although today’s children grown up using digital technology, they often use it for certain activities such as watching video, gaming or so on rather than thinking of how technological devices work and of what foundational principles of digital technology are. However, countries expect young children to become active creators rather than passive consumers of technological products. The educational system has probably the greatest responsibility for developing individuals who have technological competence. Technology education researchers have focused on environments and tools which help children to use technology properly and accurately and on gaining the skills that form a basis for software development (Shin, Park, & Bae, 2013). Because in the age we live in, learning how to code is as valuable as learning math, reading, and writing, and in the future, knowing computer programming languages will be one of the fundamental requirements for the best jobs (Horizon, 2015).
designed to help students how to code (Ministry of National Education [MEB], 2019). In the application which is compatible with the learning outcomes of the course of Information Technology and Software in 6th and 7th grade levels, users (students or teachers) are asked to issue commands to the Maskod, which is the primary character of the game, with the help of code blocks and to complete the tasks (MEB, 2019). One of the aims of these environments which are in the form of block-based programming (drag-drop) is to contribute to the development of computational thinking which should be added “to every child’s analytical ability” (Wing, 2006, p. 33). Computational thinking which is one of the 21st century skills (Tsukamoto et al., 2017) is an umbrella term involving problem-solving, design of systems, critical and algorithmic thinking, creativity, and understanding human behavior by running fundamental concepts of computer science (del Castillo et al., 2019; Wing, 2006). Block-based programming environments which are designed to enable students at almost all levels to code easily and entertainingly do not require to be a professional who has a deep understanding of programming languages but do requires logical and careful thinking to tell the computer what to do stepwise (Papavlasopoulou, Giannakos, & Jaccheri, 2019). The literature has evidence suggesting that these environments which enable young people to code their own stories, games and animations have the potential to enhance their computational thinking (Brennan & Resnick, 2012; Yunkul, Durak, Cankaya, & Abidin, 2017) which is the way of thinking that uses analytic and algorithmic approach to formulate, analyze and solve problems (Wong & Jiang, 2018).
The importance of technology in education is growing dramatically and, in recent years, robotic coding has probably become one of the most popular digital technologies in education. However, the increasing importance of technology in education attracts attention to the importance of technology acceptance by students, since technology acceptance is seen as a prerequisite for full integration of technology into the classroom and for thus for improved learning processes (Ifenthaler & Schweinbenz, 2016). Technology acceptance consists of two components (perceived usefulness and perceived ease of use) and they are hypothesized to be notable beliefs about a new technology that determine attitude towards that technology (Davis, Bagozzi, & Warshaw, 1989; Kim, Chun, & Song, 2009).
In other words, a person’s attitude towards a new information technology is one of the most important factors that eventually lead him or her to accept and use it (Kim et al., 2009). Attitude is defined as “a predisposition to respond positively or negatively to things, people, places or ideas” (Nieswandt, 2005, pp. 41–42) and an individual who has a positive attitude towards a technological innovation will has a positive behavioral intention to adopt that innovation (Ifenthaler & Schweinbenz, 2016). That is, one of the main factors which affect students’ use of technology is their attitude. In addition, attitude toward technological applications is seen as an important factor that has the potential to create a positive effect in the learning process of those technologies (Kucuk, Yilmaz, Baydas, & Goktas, 2014). It is important to measure students’ attitude towards a new technology which will be integrated into classrooms to be able to have a foresight whether they will accept and use that technology. Therefore, valid and reliable attitude scales which will serve to measure students’ attitude towards robotic coding are needed. However, the number of studies which developed instruments which would serve to measure the effects of coding education on students’ affective outcomes, especially attitude, is insufficient (Cross, Hamner, Zito, Nourbakhshh, & Bernstein, 2016) since the history of robotic coding in education is relatively new. Accordingly, the literature needs valid and reliable instruments which will serve to measure students’ attitude towards robotic coding. It is believed that the current study which aimed to develop and validate an attitude scale which will be used to measure secondary school students’ attitude towards robotic coding may fill the gap in the literature.
Method
The Steps that were followed in the Study
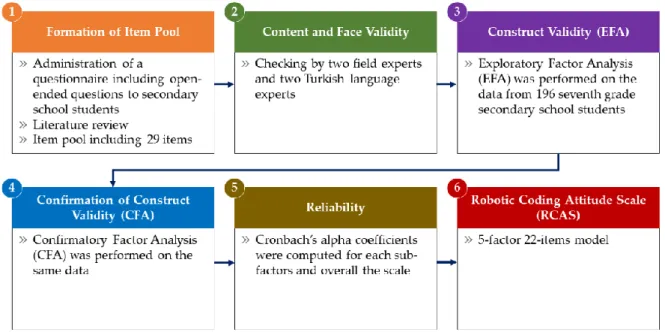
This research aimed to develop a valid and reliable instrument which would serve to measure secondary school students’ attitude towards robotic coding. However, it is necessary to expose to the measured phenomenon to be able to develop a positive or negative attitude towards that phenomenon. Therefore, first, robotic coding course was provided to a group of secondary school students and then the necessary data which would be used to develop the scale were collected from these students. The details about the training and the steps which were followed to develop the instrument were presented under sub-headings (see Figure 1).
Figure 1.The Steps which were followed in the Study
Coding Education
First, three robotic coding experts discussed among themselves how robotic coding activities would be used and decided to perform five activities by using materials like Lego. These activities included the coding of daily life machines such as stoplight, mechanism of cockhorse, washing machine, boom barrier, and sliding door. The aim was to help students gain awareness of where coding is used, how coding is performed and what function of coding is. These activities were sorted from the simplest to the most complex when forming the content of course which lasted six weeks.
A syllabus was formed for the determined activities and before the implementation, training was provided within the context of the course of Informatics and Technology. The pieces of training included information about processors, modules that would be used for coding, and the steps that would be followed during coding. After the training, problems were created for students and they were asked to solve these problems by coding. The students checked whether systems of machine work satisfactorily after coding. For example, the students were asked to write a code that would block to run the washing machine while its door was open and vice versa. A more complicated task was created for the students to solve after they had completed the previous one.
Development Process of the Instrument
First, a questionnaire including five open-ended questions was administered to the students who had received coding education in the context of the research, and the studies of the development of attitude scale towards educational technologies were reviewed (Cross et al., 2016; Kim & Lee, 2016; Kucuk et al., 2014). Thus, an item pool consisting of 29 Likert type attitude items (1 = strongly disagree, 2 = disagree, 3 = neither agree nor disagree, 4 = agree, 5 = strongly agree) was created. The 29-item scale was raised by two educational technology researchers and then two Turkish language experts reviewed the scale for sentence construction.
which is a technique that makes an effort to reveal complex patterns by exploring the dataset and testing predictions (Yong & Pearce, 2013). Then by using the same dataset, Confirmatory Factor Analysis (CFA) which is a technique and is used to confirm the hypotheses was performed (Yong & Pearce, 2013).
Results and Discussion
Overview of Statistical Analyses
The statistical analyses were performed in three steps. First, Exploratory Factor Analysis (EFA) was performed to explore underlying factor structure of the instrument. The EFA was conducted using SPSS 21.0 with principal components analysis. Second, in order to confirm the factor structure obtained through EFA, Confirmatory Factor Analysis (CFA) which uses path analysis diagrams to represent variables and factors (Yong & Perce, 2013) was conducted using Analysis of Moment Structure (AMOS) 21 with maximum likelihood method. Modification index which suggests additional paths that have the potential to improve model fit if added is one of the opportunities provided by AMOS to researchers (Kim & Glassman, 2013). Third, in order to evaluate the reliability of the instrument, Cronbach’s alpha coefficient which is suggested for Likert type scales (Reynolds, Livingston, & Willson, 2006) was calculated for each subscale and the entire items.
Exploratory Factor Analysis
First, it was evaluated whether the data set was appropriate for factor analysis by examining Kaiser-Meyer-Olkin (KMO) coefficient and the results of Bartlett test. To be able to make factor analysis on the data set, it is recommended that KMO coefficient should be higher .70 (Leech, Barrett, & Morgan, 2005) and that Bartlett test which indicates that the correlation matrix is significantly different from an identity matrix, in which correlations between variables are all zero should be significant (Leech et al., 2005). In this context, the KMO coefficient of the instrument was found to be .902 and Bartlett Test of Sphericity was found to be statistically significant (χ2
= 1971.523, df = 231, p < .0001). These results meant that EFA can be applied to the data set.
The EFA indicated that there were five factors that had an eigenvalue of more than 1 and that all of the sub-factors explained 62.710% of the total variance. The sharp drop in the scree plot (see Figure 2) may be evidence for the number of factors because the sharp drop has continued up to the fifth factor. In order to clearly reveal the factors in which the items were clustered, the varimax rotation method was used. Field (2009, p. 644) reported that the significance of a factor loading depends on the sample size. According to Field (2009), factor load cut-off criteria for a sample of 100 and of 200 subjects should be .512 and .364, respectively. In the current study, the cut-off criteria reported by Field (2009) were used as a reference. Therefore, the cut-off criteria were assigned as .40 because of the current sample size. First, factor analysis was performed on the 29 items and the items were clustered under six factors.
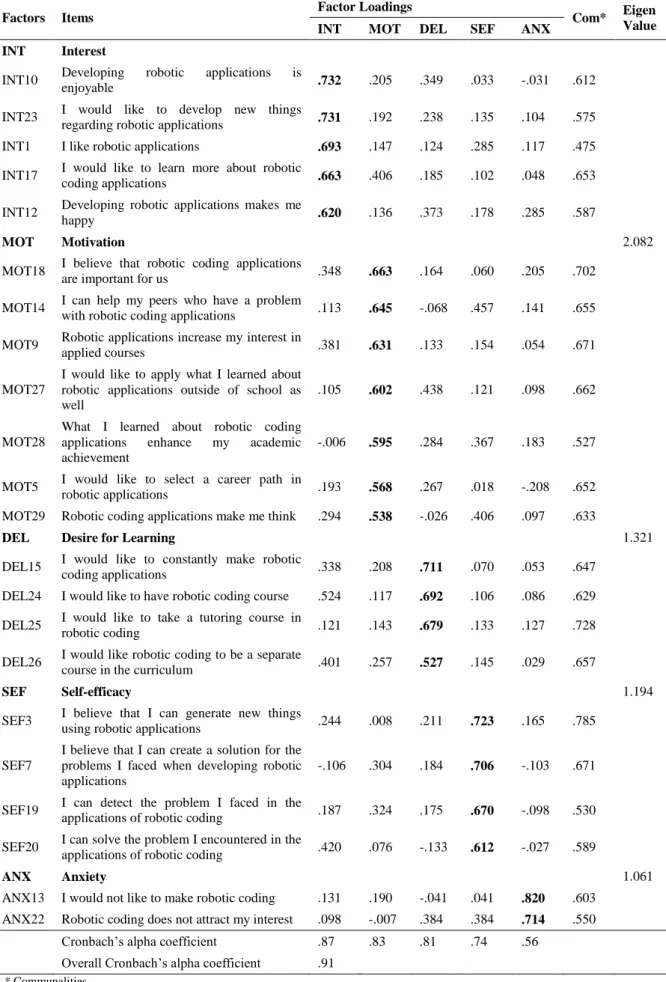
However, the items which clustered under the same sub-factor but had a less difference than .10 between factor loadings were accepted as overlapping items (Buyukozturk, 2009) and these items (I2, I4, I6, I8, I11, I16, and I21) were removed from the scale. Consequently, the remaining 22 items were clustered under five factors and their factor loadings ranged between .527 and .820. Additionally, Pallant (2007, p. 196) stated that an item that has a value of communality less than .30 is not compatible with other items within its factor. The results of the analysis indicated that communalities ranged between .527 and .785 (see Table 1).
Table 1. Results of EFA of the 22-item RCAS
Factors Items Factor Loadings Com* Eigen
Value INT MOT DEL SEF ANX
INT Interest
INT10 Developing robotic applications is
enjoyable .732 .205 .349 .033 -.031 .612
INT23 I would like to develop new things
regarding robotic applications .731 .192 .238 .135 .104 .575
INT1 I like robotic applications .693 .147 .124 .285 .117 .475
INT17 I would like to learn more about robotic
coding applications .663 .406 .185 .102 .048 .653
INT12 Developing robotic applications makes me
happy .620 .136 .373 .178 .285 .587
MOT Motivation 2.082
MOT18 I believe that robotic coding applications
are important for us .348 .663 .164 .060 .205 .702
MOT14 I can help my peers who have a problem
with robotic coding applications .113 .645 -.068 .457 .141 .655
MOT9 Robotic applications increase my interest in
applied courses .381 .631 .133 .154 .054 .671
MOT27
I would like to apply what I learned about robotic applications outside of school as well
.105 .602 .438 .121 .098 .662
MOT28
What I learned about robotic coding applications enhance my academic achievement
-.006 .595 .284 .367 .183 .527
MOT5 I would like to select a career path in
robotic applications .193 .568 .267 .018 -.208 .652
MOT29 Robotic coding applications make me think .294 .538 -.026 .406 .097 .633
DEL Desire for Learning 1.321
DEL15 I would like to constantly make robotic
coding applications .338 .208 .711 .070 .053 .647
DEL24 I would like to have robotic coding course .524 .117 .692 .106 .086 .629
DEL25 I would like to take a tutoring course in
robotic coding .121 .143 .679 .133 .127 .728
DEL26 I would like robotic coding to be a separate
course in the curriculum .401 .257 .527 .145 .029 .657
SEF Self-efficacy 1.194
SEF3 I believe that I can generate new things
using robotic applications .244 .008 .211 .723 .165 .785
SEF7
I believe that I can create a solution for the problems I faced when developing robotic applications
-.106 .304 .184 .706 -.103 .671
SEF19 I can detect the problem I faced in the
applications of robotic coding .187 .324 .175 .670 -.098 .530
SEF20 I can solve the problem I encountered in the
applications of robotic coding .420 .076 -.133 .612 -.027 .589
ANX Anxiety 1.061
ANX13 I would not like to make robotic coding .131 .190 -.041 .041 .820 .603
ANX22 Robotic coding does not attract my interest .098 -.007 .384 .384 .714 .550 Cronbach’s alpha coefficient .87 .83 .81 .74 .56
Overall Cronbach’s alpha coefficient .91
Figure 2. Scree Plot
Confirmatory Factor Analysis
A 5-factor 22-item model was obtained from the EFA and the model was evaluated using the Maximum likelihood estimation method in AMOS. The model was run and a value of χ2 = 366.323 (df = 198, p < .05) was
obtained. The expectation about this value was that it should have not been statistically significant. However the value of chi-square is highly affected by sample size (Byrne, 2010; Kenny, 2014), and expectedly, it was found to be statistically significant. Therefore, the ratio of chi-square to degrees of freedom which has the potential to minimize the effect of sample size is suggested by statisticians as an alternative way of evaluation of model fits (Kenny, 2014; Kline, 2011).
In addition to relative chi-square (χ2/df ≤ 2, excellent; Kline, 2011), other goodness-of-fits indices such as Normed Fit Index (NFI ≥ .90, acceptable; Bentler & Bonett, 1980), Comparative Fit Index (CFI ≥ .90, acceptable; Hooper, Coughlan, & Mullen, 2008) and Root Mean Square Error of Approximation (RMSEA ≤ .08, good; Hooper et al., 2008; Browne & Cudeck, 1993) were also used to evaluate the degree of fit between the model and the data. Summary of CFA model fits of the RCAS presented in Table 2 indicated that the model had an acceptable but poor fit. Therefore, an additional covariance path between the error terms of items INT10 and INT23 that had the potential to improve the model fit was suggested by modification index and a minor improvement was observed after the error terms of items had been correlated (Table 2).
Similarly, the modification index suggested another covariance path between error terms of items CON14 and CON29 which are included under the same factor and the final model was run after these error terms of items were correlated. According to the final model, all model fit criteria (except NFI) had an acceptable model fit. Although NFI was did not meet the criteria for an acceptable model fit, it was quite close to the acceptable value (Table 2).
Table 2. Summary of CFA Model Fits of the RCAS χ2
df χ2/df NFI CFI RMSEA (90% C.I.)
Original model 382.185 199 1.921 .814 .900 .069 (.058 - .079) Adjusted model 368.545 198 1.861 .821 .907 .066 (.056 - .077)
Final model 359.889 197 1.827 .825 .911 .065 (.054 - .076)
Figure 3.Path Diagram of the RCAS
Evaluation of Scores from the RCAS
According to the results of the analyses, the RCAS consisted of 22 Likert type items (1 = strongly disagree, 2 = disagree, 3 = neither agree nor disagree, 4 = agree, 5 = strongly agree). The maximum and minimum scores which will be obtained from the RCAS is 110 and 22, respectively. The RCAS includes two negative items which should be coded reversely. These items are ANX22 and ANX13 which are under the anxiety factor.
Conclusion and Recommendations
factor includes 4 items (positive statements) measuring respondents’ self-confidence about developing robotic coding applications and solving problems related to robotic coding. The fifth factor includes 2 items (negative statements) measuring respondents’ anxiety about robotic coding. It is traditionally suggested that a single subscale should hold at least three items (Kim & Glassman, 2013). In the current study, the 5th factor did not meet the traditional suggestion. We decided to hold this factor in the scale because of two following reasons: (1) five factors extracted via EFA reflect different dimensions of robotic coding (2) high factor loadings of two items showed they are separate and unique from other factors (Kim & Glassman, 2013). Cronbach’s alpha coefficients calculated for each factor and the entire items indicate that the scale is reliable (overall scale α = .91; 1st factor α = .87; 2nd factor α = .83; 3rd factor α = .81; 4th factor α = .74; 5th factor α = .56). The CFA which was conducted to test the degree of between the data and the model extracted through EFA resulted in acceptable model fits to the data (see Table 2).
Robotic coding which has the potential to affect the nature of science and engineering education (Mataric, 2004) has emerged in recent years as a result of rapid developments in technology and has become an integral part of the school curriculum in many countries (Papavlasopoulou et al., 2019). Cognitive development in coding may be correlated with the attitude towards coding because the correlation between cognitive and affective outcomes was found to be positive in many of the studies conducted in different majors (Freedman, 1997). Hence, measuring learners’ attitude towards coding is extremely important. However, the literature has a very limited number of reliable and valid instruments which will serve to measure secondary school students’ attitude towards robotic coding (Cross et al., 2016). Therefore, the RCAS was developed and validated. The related literature emphasizes that intrinsic decision processes are important for the acceptance of new technologies by individuals (Kucuk et al., 2014). If individuals interest in technological tools, they can adapt to new technologies more easily. Self-efficacy is a judgment of one’s ability to use a technology to accomplish a particular job or task (Cross et al., 2016) and is one of the important factors that affect individuals’ feelings and behavior (Compeau & Higgins, 1995). Therefore, it plays a critical role on individual’s ability and willingness to use new technologies (Glassman & Kang, 2012). In other words, those with a higher level of technology self-efficacy may adapt to new technologies more quickly and easily. Motivation which can be defined as a learner’s desire to engage in a learning setting (Keller & Litchfield, 2002) is the driving forces that initiates and directs behavior (Di Serio, Ibáñez, & Kloos, 2013). Learning desire reveals whether individuals are willing to improve themselves in the current technology. However, if individuals hesitate to use educational technology for any reason, they experience anxiety to use that technology and this may also affect their attitudes negatively (Kucuk et al., 2014). Accordingly, the model with five-factors extracted in the current study serves the evaluation of attitude towards coding education (Venkatesh, Morris, Davis, & Davis, 2003).
This study has limitations. One limitation is that although the instrument in the study was developed for secondary school students, the validity and reliability of the instrument was raised on 7th-grade secondary school students only. Therefore, the validity and reliability of the RCAS may be re-tested at different grade levels in secondary school. Another limitation is that both the EFA and the CFA were conducted at the same group of subjects who had received robotic coding education in the context of this research. Employing CFA and EFA on different samples randomly selected from the same population is ideal but it was not possible for the current study to find a different group of subjects to perform CFA. Although these limitations are real, they do not significantly detract from the results found in the current study. Therefore, the RCAS is a highly reliable and valid instrument which has the potential to help researchers to measure secondary school students’ attitude towards robotic coding and could be used an important assessment tool in a variety of educational environments. This study can guide researchers who plan to develop an attitude scale towards robotic coding which aims to measure attitudes of students at different grade levels. In addition, the RCAS can also be used as a data collection tool in the experimental studies in which the effect of robotic coding on secondary school students’ attitudes is investigated.
References
Bentler, P. M., & Bonett, D. G. (1980). Significance tests and goodness of fit in analysis of covariance structures. Psychological Bulletin, 88(3), 588-606. https://doi.org/10.1037/0033-2909.88.3.588
Bland, J. M., & Altman, D. G. (1997). Statistics notes: Cronbach's alpha. BMJ, 314, 572. https://doi.org/10.1136/bmj.314.7080.572
Brennan, K., & Resnick, M. (2012). New frameworks for studying and assessing the development of computational thinking. American Educational Research Association Meeting, Vancouver, BC, Canada. Browne, M. W., & Cudeck, R. (1993). Alternative says of assessing model fit. In K. A. Bollen & J. S. Long
Buyukozturk, S. (2009). Handbook of data analysis for social sciences. (10th ed.). Pegem Akademi: Ankara. Byrne, B. M. (2010). Structural equation modeling with AMOS: Basic concepts, applications, and programming
(2nd ed.). Madison, NY: Routledge.
Compeau, D., & Higgins, C. A. (1995). Computer self-efficacy: development of a measure and initial test. MIS Quarterly, 19(2), 189-211. doi:10.2307/249688
Creswell, J. W. (2014). Research design: Qualitative, quantitative, and mixed methods approaches (4th ed.). Thousand Oaks, CA: Sage
Cross, J., Hamner, E., Zito, L., Nourbakhshh, I., & Bernstein, D. (2016). Development of an assessment for measuring middle school student attitudes towards robotics activities. IEEE Frontiers in Education Conference (FIE), Erie, PA, USA.
Davis, F., Bagozzi, R., & Warshaw, P. (1989). User acceptance of computer technology: A comparison of two theoretical models. Management Science, 35(8), 982-1003.
del Castillo, A. M., Huertas, L. C. A., Herrera, E., Muñoz, M. A., Toledo, J. J., & Ramos, D. X. (2019). Developing a teacher training curriculum including computational thinking skills. XIV Latin American Conference on Learning Objects, At San José del Cabo, BSC, Mexico
Demirer, V., & Sak, N. (2016). Programming education and new approaches around the world and in Turkey (Dünyada ve Türkiye'de programlama eğitimi ve yeni yaklaşımlar). Journal of Theory and Practice in Education, 12(3), 521-546.
Di Serio, Á., Ibáñez, M. B., & Kloos, C. D. (2013). Impact of an augmented reality system on students' motivation for a visual art course. Computers & Education, 68, 586-596. https://doi.org/10.1016/j.compedu.2012.03.002
Duncan, C., Bell, T., & Tanimoto, S. (2014). Should your 8-year-old learn coding?. 9th Workshop in Primary and Secondary Computing Education, Berlin, Germany.
Field, A. P. (2009). Discovering statistics using SPSS. London, England: SAGE.
Freedman, M. P. (1997). Relationship among laboratory instruction, attitude toward science, and achievement in science knowledge. Journal of Research in Science Teaching, 34(4), 343-357. https://doi.org/10.1002/(SICI)1098-2736(199704)34:4<343::AID-TEA5>3.0.CO;2-R
Glassman, M., & Kang, M. (2012). Intelligence in the Internet age: The emergence and evolution of Open Source Intelligence (OSINT). Computers in Human Behavior, 28(2), 673-682. https://doi.org/10.1016/j.chb.2011.11.014
Hooper, D., Coughlan, J., & Mullen, M. R. (2008). Structural Equation Modelling: Guidelines for determining model fit. The Electronic Journal of Business Research Methods, 6(1), 53-60.
Horizon, M. (2015). Horizon Media study reveals Americans prioritize STEM subjects over the arts; science is “cool,” coding is new literacy. PR Newswire. Retrieved December 20, 2019, from https://www.prnewswire.com/news-releases/horizon-media-study-reveals-americans-prioritize-stem-subjects-over-the-arts-science-is-cool-coding-is-new-literacy-300154137.html
Ifenthaler, D., & Schweinbenz, V. (2016). Students' acceptance of tablet PCs in the classroom. Journal of Research on Technology in Education, 48(4), 306-321. https://doi.org/10.1080/15391523.2016.1215172 Jones, S. P., Mitchell, B., & Humphreys, S. (2013). Computing at school in the UK. CACM Report. Retrieved
December 25, 2019, from https://www.microsoft.com/en-us/research/wp-content/uploads/2016/07/ComputingAtSchoolCACM.pdf
Kalelioglu, F. (2015). A new way of teaching programming skills to K-12 students: Code.org. Computers in Human Behavior, 52, 200-210. https://doi.org/10.1016/j.chb.2015.05.047
Kazakoff, E. R., Sullivan, A., & Bers, M. U. (2013). The effect of a classroom-based intensive robotics and programming workshop on sequencing ability in early childhood. Early Childhood Education Journal, 41(4), 245-255.
Keller, J. M., & Litchfield, B. C. (2002). Motivation and performance. In R. A. Reiser, & J. V. Dempsey (Eds.), Trends and issues in instructional design and technology. New Jersey: Merill Prenctice Hall.
Kenny, D. A. (2014). Measuring model fit. Retrieved February 1, 2015, from http://davidakenny.net/cm/fit.htm Kim, Y. J., Chun, J. U., & Song, J. (2009). Investigating the role of attitude in technology acceptance from an
attitude strength perspective. International Journal of Information Management, 29(1), 67-77. https://doi.org/10.1016/j.ijinfomgt.2008.01.011
Kim, Y., & Glassman, M. (2013). Beyond search and communication: Development and validation of the Internet Self-efficacy Scale (ISS). Computers in Human Behavior, 29, 1421-1429. https://doi.org/10.1016/j.chb.2013.01.018
Kim, S. W., & Lee, Y. (2016). The effect of robot programming education on attitudes towards robots. Indian Journal of Science and Technology, 9(24), 1-11. DOI: 10.17485/ijst/2016/v9i24/96104
Kucuk, S., Yilmaz, R., Baydas, O., & Goktas, Y. (2014). Augmented reality applications attitude scale in secondary schools: Validity and reliability study. Education & Science, 39(176), 383-392. DOI: 10.15390/EB.2014.3590
Leech, N. L., Barrett, K. C. & Morgan, G. A. (2005). SPSS for Intermediate Statistics, Use and Interpretation. (2nd ed.). Lawrence Erlbaum Associates Inc., Mahwah
Mataric, M. J. (2004). Robotics education for all ages. AAAI Spring Symposium on Accessible, Hands-on AI and Robotics Education, Palo Alto, CA, USA.
McMillan, J. H., & Schumacher, S. (2006). Research in education: Evidence based inquiry (6th ed.). New York, Pearson Education.
MEB (2019). Milli Eğitim Bakanlığı [The Ministry of National Education]. Öğrenciler kodlamayı “Maskod” ile öğrenecek. [Students learn coding through “Maskod”]. Retrieved 25 December 2019 from https://www.meb.gov.tr/ogrenciler-kodlamayi-maskod-ile-ogrenecek/haber/18710/tr
Nieswandt, M., (2005). Attitudes toward science: a review of the field, in Alsop S. (ed.), Beyond Cartesian dualism: encountering affect in the teaching and learning of science, Dordrecht: Springer, pp. 41–52 Pallant, J. (2007). SPSS survival manual: A step by step guide to data analysis using SPSS for Windows (3rd ed.).
Berkshire: Open University Press
Papavlasopoulou, S., Giannakos, M. N., & Jaccheri, L. (2019). Exploring children's learning experience in constructionism-based coding activities through design-based research. Computers in Human Behavior, 99, 415-427. https://doi.org/10.1016/j.chb.2019.01.008
Reynolds, C. R., Livingston, R. B., & Willson, V. (2006). Measurement and assessment in education. Boston, MA: Allyn & Bacon.
Shin, S., Park, P., & Bae, Y. (2013). The effects of an information-technology gifted program on friendship using scratch programming language and clutter. International Journal of Computer and Communication Engineering, 2(3), 246-149. DOI: 10.7763/IJCCE.2013.V2.181
SITRA. (2014). Future will be built by those who know how to code. Retrieved January 8, 2020, from https://www.sitra.fi/en/articles/future-will-be-built-those-who-know-how-code/
Tsukamoto, H., Oomori, Y., Nagumo, H., Takemura, Y., Monden, A., & Matsumoto, K. I. (2017). Evaluating algorithmic thinking ability of primary schoolchildren who learn computer programming. IEEE Frontiers in Education Conference (FIE), Indianapolis, Indiana, USA.
Uzgur, B. C., & Aykac, N. (2016). The Evaluation of information technologies and software course’s curriculum according to the teacher’s ideas (Aegean Reagion Sample) [Bilişim teknolojileri ve yazılım dersi öğretim programının öğretmen görüşlerine göre değerlendirilmesi (Ege Bölgesi örneği)]. Mustafa Kemal University Journal of Social Sciences Institute, 13(34), 273-297.
Venkatesh, V., Morris, M., Davis, G. B. & Davis, F. D. (2003). User acceptance of information technology: Toward a unified view. MIS Quarterly 27(3), 425-478. DOI: 10.2307/30036540
Wing, J. (2006). Computational thinking. Communications of the ACM, 49(3), 33-35. https://doi.org/10.1145/1118178.1118215
Wong, G. K., & Jiang, S. (2018). Computational thinking education for children: Algorithmic thinking and debugging. International Conference on Teaching, Assessment, and Learning for Engineering (TALE), Wollongong, NSW, Australia.
Yong, A. G., & Pearce, S. (2013). A beginner’s guide to factor analysis: Focusing on exploratory factor analysis. Tutorials in Quantitative Methods for Psychology, 9(2), 79-94. DOI: 10.20982/tqmp.09.2.p79 Yunkul, E., Durak, G., Cankaya, S., & Abidin, Z. (2017). The effects of scratch software on students’
computational thinking skills. Necatibey Faculty of Education Electronic Journal of Science and Mathematics Education, 11(2), 502-517.
Author Information
Sema Altun YalcinErzincan Binali Yildirim University Turkey
Sakip Kahraman
Canakkale Onsekiz Mart University Turkey
Contact e-mail: [email protected]
Zeynel Abidin Yilmaz
Appendix. Robotic Coding Attitude Scale
S
tro
n
g
ly
a
g
re
e
Ag
re
e
Ne
it
h
er
ag
re
e
n
o
r
d
isa
g
re
e
Disa
g
re
e
S
tro
n
g
ly
d
isa
g
re
e
1. I like robotic applications ⑤ ④ ③ ② ①
2. I believe that I can generate new things using robotic applications ⑤ ④ ③ ② ①
3. I would like to select a career path in robotic applications ⑤ ④ ③ ② ①
4. I believe that I can create a solution for the problems I faced when developing robotic
applications ⑤ ④ ③ ② ①
5. Robotic applications increase my interest in applied courses ⑤ ④ ③ ② ①
6. Developing robotic applications is enjoyable ⑤ ④ ③ ② ①
7. Developing robotic applications makes me happy ⑤ ④ ③ ② ①
8. I would not like to make robotic coding ⑤ ④ ③ ② ①
9. I can help my peers who have a problem with robotic coding applications ⑤ ④ ③ ② ①
10. I would like to constantly make robotic coding applications ⑤ ④ ③ ② ①
11. I would like to learn more about robotic coding applications ⑤ ④ ③ ② ①
12. I believe that robotic coding applications are important for us ⑤ ④ ③ ② ①
13. I can detect the problem I faced in the applications of robotic coding ⑤ ④ ③ ② ①
14. I can solve the problem I encountered in the applications of robotic coding ⑤ ④ ③ ② ①
15. Robotic coding does not attract my interest ⑤ ④ ③ ② ①
16. I would like to develop new things regarding robotic applications ⑤ ④ ③ ② ①
17. I would like to have robotic coding course ⑤ ④ ③ ② ①
18. I would like to take a tutoring course in robotic coding ⑤ ④ ③ ② ①
19. I would like robotic coding to be a separate course in the curriculum ⑤ ④ ③ ② ①
20. I would like to apply what I learned about robotic applications outside of school as well ⑤ ④ ③ ② ①
21. What I learned about robotic coding applications enhance my academic achievement ⑤ ④ ③ ② ①