Abstract
Introduction: Type 2 diabetes mellitus, previously considered an adult disease, has emerged as a significant health issue in the pediatric population. According to the National Health and Nutrition Examination Survey (NHANES), Hispanic/Latino (Hispanic) adolescents aged 12 to 19 years exhibit higher rates of overweight and obesity among youth of all ages and ethnic groups. Hispanic adolescents experience greater health disparities and an increased risk for developing diabetes.
Method: A search of the literature using PubMed and PsycINFO focused on interventions that targeted diabetes risk reduction interventions reporting adiposity, glucose and insulin levels, nutrition education, strength training, and physical activity outcomes in overweight and/or obese Hispanic adolescents.
Results: Twelve studies met the inclusion criteria and confirmed that there was minimal evidence of the impact on diabetes prevention interventions targeting Hispanic adolescents.
Conclusion: Future research should focus on culturally tailored efficacy and effectiveness trials with larger sample sizes, increased intervention length, and improved and delivery modalities to improve retention.
Introduction
Type 2 diabetes mellitus (diabetes) is a serious public health concern. In 2015,
approximately 30.3 million individuals in the United States had diabetes and 84.1 million had prediabetes (Center for Disease Control and Prevention, 2017). Untreated prediabetes usually leads to diabetes within 5 years (Center for Disease Control and Prevention, 2017). It is
estimated that diabetes will increase 54% to 54.9 million in the United States from 2015 to 2030 (Rowley, Bezold, Arikan, Byrne, & Krohe, 2017). The total direct and indirect costs related to diabetes will rise by 53% to more than $622 billion per year by 2030 (Rowley et al., 2017).
Diabetes is increasing in youth. Results from the National Health and Nutrition
Examination Survey (2016) demonstrated a disparity in adolescents between 12 to 19 years of age with 20.6% being obese. Moreover, youth from racial/ethnic minority populations, including Hispanics are disproportionately affected with 25.8% being obese (Hales et al., 2017).
Overweight and obese Hispanic youth have higher rates of prediabetes and insulin resistance compared to non-Hispanic white youth, which places this group at a higher risk for diabetes (Algoblan, Alalfi, & Khan, 2014; Cruz et al., 2004; Goran, Bergman, Cruz, & Watanabe, 2002; Lawrence et al., 2009; Menke, Casagrande, & Cowie, 2016; Weigensberg, Ball, Shaibi, Cruz, & Goran, 2005).
These findings are concerning because the Hispanic population in the US is projected to rise from 17.4% to 28.6% of the population by 2060 (Colby & Ortman, 2015). Once diagnosed with diabetes, Hispanics have a disproportionate prevalence of diabetes and increased morbidity and mortality compared to non-Hispanic whites (Spanakis & Golden, 2013). Also, Hispanics have a greater diabetes burden of microvascular and macrovascular complications (Spanakis & Golden, 2013). Microvascular complications include retinopathy, nephropathy, and neuropathy (Spanakis & Golden, 2013). Macrovascular complications include ischemic heart disease and cardiovascular disease (Spanakis & Golden, 2013). More alarmingly, Hispanics are
approximately 50% more likely to die from diabetes than non-Hispanic whites (Center for Disease Control and Prevention, 2015).
Approaches in managing and preventing disease in overweight and obese Hispanic youth warrant further investigation. Despite the higher prevalence of obesity and greater risk of
cardiovascular disease among Hispanic adolescents, this group is less frequently represented in obesity interventions (Seo & Sa, 2010).Few publications have reviewed data on diabetes prevention for this high-risk group or examined the extent to which existing interventions were able to significantly modify diabetes risk reduction such as reduction in body mass index (BMI) or improved insulin and glucose regulation. The purpose of this review was to synthesize and analyze the current evidence concerning diabetes prevention interventions and associated diabetes risk reduction outcomes in overweight or obese Hispanic adolescents.
Method
This review was guided by the search strategy developed by Glenny, O’Meara, Melville, Sheldon, and Wilson (1997) to identify research studies focusing on diabetes risk reduction targeting overweight and/or obese Hispanic adolescents aged 12-19 years old. The databases PubMED and PsycINFO were searched using the search terms type 2 diabetes mellitus, non-insulin dependent diabetes, Hispanic, Latino, Latina, Latinix, Mexican, Central American, South American, teenagers, youth, adolescents, overweight, obesity, prevention, and intervention for studies published in English from the year 2006 to 2018.
The search included those dates because most of the studies published were after 2006. The studies were reviewed using the following inclusion criteria: (a) participants self-reported Hispanic or Latino origin; (b) participants were overweight or obese (age-and sex-specific BMI ≥ 85th percentile or BMI ≥ 95th percentile, respectively); (c) participants were female or male; (d) participants had pre-diabetes; (e) studies evaluated an intervention aimed to reduce risk for diabetes (e.g. nutrition, physical, cognitive and or behavioral, lifestyle or a combination); (f) not a pharmaceutical intervention; (g) studies sample compromised ≥50% Hispanic youth; (h) studies were experimental or quasi experimental study design; (h) studies reported outcome measures of diabetes risk reduction. Studies were excluded if (a) participants were identified by significant medical co-morbidities, including uncontrolled metabolic disorders (e.g. thyroid, diabetes, renal, liber) and unstable heart disease; (b) participants were taking medication for diabetes; (c) studies were published in a language other than English or Spanish.
independent reviewers met five times over five months to discuss differences and come to consensus reviewed the data from the 12 studies. A summary of the studies is found in Table 1.
Results
The characteristics of the 12 studies are presented in Table 1 and are focused on clinical outcomes including nutrition, physical activity, strength training, adiposity, and glucose and insulin levels. Ten of the studies were randomized controlled studies and two were quasi experimental. Researchers implemented nutrition education, physical activity, and behavioral therapy interventions.
Participant Characteristics
Two studies reported the participant’s country of origin (Davis et al., 2009b; Rosenbaum et al., 2007). Ten studies referred to participants as either Hispanic and/or Latino (Davis et al., 2011; Davis et al., 2009a; Davis et al., 2007; Kelly et al., 2015; Patrick et al., 2013; Shaibi et al., 2006; Shaibi et al., 2012; Soltero et al., 2018; Van Der Heijden et al., 2010; Weigensberg et al., 2014). One study reported participants primarily of Dominican Republic background
Interventions
Intervention locations were clinic based (N=5), home-based (N=1), school based (N=1), community based (N=3), or online (N=1). One intervention compared home and clinic based interventions (Davis et al., 2007). The majority of interventions targeted improved nutrition and increased physical activity (Davis et al., 2009a; Davis et al., 2009b; Patrick et al., 2013;
Rosenbaum et al., 2007; Shaibi et al., 2012; Soltero et al., 2018; Weigensberg et al., 2014). Four studies targeted physical activity only (Davis et al., 2011; Kelly et al., 2015; Shaibi et al., 2006; Van Der Heijden et al., 2010). One study targeted nutrition only (Davis et al., 2007). All studies delivered weekly face to face content, except for one web-based intervention with a two arm intervention (Weigensberg et al., 2014). The duration of studies varied from 12 weeks to 12 months, the majority lasting 12-16 weeks. The follow-up period occurred at the post-intervention time point in all but one study with a follow-up of 12 months post-intervention (Soltero et al., 2018).
Clinical outcomes
The reduction of risk for developing diabetes was measured by outcome changes in adiposity, nutrition, physical activity, strength training, and glucose and insulin levels. The most frequently reported outcomes were changes in BMI, z-BMI score, fasting insulin, and fasting glucose.
Nutrition
Shaibi et al., 2012; Weigensberg et al., 2014). The most commonly used tools to assess dietary intake were 3-day dietary intake records, dietary questionnaires, and self-reported diet records. Two studies reported a reduction in sugar intake (Davis et al., 2009b; Davis et al., 2007). Three studies reported a reduction in total energy intake (Davis et al., 2009a; Davis et al., 2009b; Weigensberg et al., 2014). Three studies reported a reduction in carbohydrate intake (Davis et al., 2009a; Davis et al., 2009b; Davis et al., 2007). Two studies reported a reduction in dietary fat intake (Davis et al., 2009a; Shaibi et al., 2012). One study reported a reduction in sugary
beverages (Davis et al., 2007). Another study reported an increase in dietary fiber intake (Davis et al., 2007). One study reported an increase in fruit and vegetable intake (Patrick et al., 2013).
Physical Activity and Strength Training
Six studies assessed physical activity by either self-report alone or in combination with a 7-day accelerometry measurement. Physical activity outcomes ranged from no change to an increase in daily moderate intensity compared with the control group. Significant improvement in physical activity was noted in all studies (Davis et al., 2011; Davis et al., 2009b; Patrick et al., 2013; Shaibi et al., 2012; Van Der Heijden et al., 2010; Weigensberg et al., 2014). Four studies reported a significant increase in strength measured by one-repetition maximum leg press or bench press compared to the control group (Davis et al., 2011; Davis et al., 2009a; Davis et al., 2009b; Shaibi et al., 2006).
Adiposity
a significant reduction in BMI compared to the control group at three months, but did not remain significant at the 12-month follow up (Soltero et al., 2018). Body mass index changes within groups were small across studies, ranging from -0.1 to -1.21 kg/m2. Rosenbaum et al. reported a significant within intervention group reduction in mean BMI from 24.7±1.4 kg/m2 to 24.0±1.5 kg/m2. One study found significant reduction in BMI compared with the control group and at 12 months follow up the reduction remained significant (Soltero et al., 2018). Seven studies
reported a change in BMI z-scores. Of these studies, three randomized controlled trials reported significant within group reduction in BMI z-scores, which were small across studies from -0.05 to -0.1 (Davis et al., 2009b; Davis et al., 2007; Shaibi et al., 2012). One study tested the
feasibility of a home versus school-based nutrition intervention and found a significant reduction in BMI z-scores across both groups (Davis et al., 2007). Out of nine studies that evaluated a change in percent body fat, four (two randomized controlled trials) studies found a significant reduction in percent body fat (-3.36%) compared with the control group (-1.0%) post
intervention (Rosenbaum et al., 2007; Shaibi et al., 2006; Soltero et al., 2018; Van Der Heijden et al., 2010).
Six studies examined changes in age and sex adjusted BMI percentile with two studies reporting a significant change as follows. One study reported a change of -1.3% post
months, but did not remain significant at 12 months follow-up (Soltero et al., 2018). Four (three randomized controlled trials) out of seven studies that examined total fat mass outcomes reported significant change in total visceral or adipose fat content compared to controls or post
intervention (Davis et al., 2011; Davis et al., 2009b; Kelly et al., 2015; Van Der Heijden et al., 2010).
Glucose and Insulin Levels
measured by oral glucose tolerance test (OGTT). Of these, only one study reported a significant 10.8% reduction in fasting glucose compared to baseline (Shaibi et al., 2012). In addition, the study reported a significant 23.6% reduction in 2-hr insulin compared to baseline. Out of eight studies that examined insulin sensitivity directly by frequently sampled intravenous glucose tolerance test, only two studies reported a significant reduction compared to controls (Shaibi et al., 2006; Soltero et al., 2018). One study reported an increase in insulin sensitivity of 0.9 x 10⁻⁴
min-1*µU-1mL-1 compared to the control group (Shaibi et al., 2006), while one study reported a significant increase in insulin sensitivity post intervention (1.8±0.1 to 2.2±0.1), but did not remain significant at 12 months follow-up (Soltero et al., 2018).
Discussion
The 12 interventions examined in this review did not conclusively demonstrate the effectiveness of diabetes prevention programs for at risk overweight or obese Hispanic
adolescents. The strongest evidence presentenced included 10 randomized controlled studies, in which only four reported significant changes in BMI or BMI z-scores and four reported
significant changes in insulin resistance or fasting glucose and/or insulin. Although the quality of the interventions was moderate to strong, it is important to cautiously interpret the data due to small samples sizes, short duration of interventions, lack of long-term follow-up except for one study, and overall small intervention effects. All things considered, interventions to reduce diabetes risk for overweight and obese Hispanic adolescents exist, but their efficacy in preventing diabetes remains limited.
participant who presented with impaired glucose tolerance and no longer had pre-diabetes following the intervention (Shaibi et al., 2012). This review found small changes in mean fasting glucose with or without intervention in some groups over a 16-week intervention that
demonstrated that even the smallest reduction in mean fasting glucose could delay or prevent prediabetes metabolic dysfunction (Davis et al., 2011; Davis et al., 2009a; Davis et al., 2009b; Davis et al., 2007; Kelly et al., 2015; Shaibi et al., 2006; Soltero et al., 2018). Long-term follow-up to measure the incidence of diabetes among study participants in the control grofollow-up versus the intervention group would provide information on the intervention in reducing diabetes risk.
Only seven studies addressed both physical activity and nutrition in its interventions despite evidence supporting the need to incorporate both in interventions to decrease diabetes risk reduction (Diabetes Prevention Program Research et al., 2009; Savoye et al., 2014; Savoye et al., 2011; Tuomilehto et al., 2001). Four studies addressed either only physical activity or nutrition only. Changes in dietary behavior were remarkable in that five out of seven studies that measured dietary intake showed significant post-intervention improvement in healthy eating. The interventions appeared to have been very successful in reducing unhealthy food intake including a reduction in dietary sugar, sugary beverages, and dietary fat intake. It is important to recognize the limitations of self-reporting that may be easily biased by social desirability and affect
responses. The outcomes were notable considering the multiple domains of influence on adolescent eating behavior.
ecological frameworks have proved efficacious in reducing or preventing obesity in Hispanic youth by increasing PA and improving nutrition by recognizing multiple domains of influence on adolescent behavior (school, family, peers, and community) (Kiraly, Turk, Kalarchian, &
Shaffer, 2017). Despite the studies targeting Hispanic youth, only few studies implemented culturally tailored interventions to its minority participants that may contribute to high attrition rates when they do not adequately engage participants. Only two studies reported culturally tailored interventions (Davis et al., 2007; Shaibi et al., 2012). Innovative delivery modalities are also warranted to increase engagement in this population given the prevalence of technological use among adolescents and its access.
References
Algoblan, A., Alalfi, M., & Khan, M. (2014). Mechanism linking diabetes mellitus and obesity. Diabetes, Metabolic Syndrome and Obesity: Targets and Therapy, 587. Retrieved from https://dx.doi.org/10.2147/DMSO.S67400. doi:10.2147/dmso.s67400
Center for Disease Control and Prevention. (2015). Hispanic Health. Retrieved from https://www.cdc.gov/vitalsigns/pdf/2015-05-vitalsigns.pdf
Center for Disease Control and Prevention. (2017). National Diabetes Statistics Report. Retrieved from https://www.cdc.gov/diabetes/pdfs/data/statistics/national-diabetes-statistics-report.pdf
Chiasson, J. L., & Rabasa-Lhoret, R. (2004). Prevention of type 2 diabetes: insulin resistance and beta-cell function. Diabetes, 53 Suppl 3, S34-38. Retrieved from
https://www.ncbi.nlm.nih.gov/pubmed/15561919.
Colby, S. L., & Ortman, J. M. (2015). Projections of the Size and Composition of the U.S. Population: 2014 to 2060. Population Estimates and Projections. Current Population Reports. Retrieved from
https://www.census.gov/content/dam/Census/library/publications/2015/demo/p25-1143.pdf
Cruz, M. L., Weigensberg, M. J., Huang, T. T., Ball, G., Shaibi, G. Q., & Goran, M. I. (2004). The metabolic syndrome in overweight Hispanic youth and the role of insulin sensitivity. J Clin Endocrinol Metab, 89(1), 108-113. Retrieved from
https://www.ncbi.nlm.nih.gov/pubmed/14715836. doi:10.1210/jc.2003-031188 Davis, J. N., Gyllenhammer, L. E., Vanni, A. A., Meija, M., Tung, A., Schroeder, E. T., . . .
Adolescents. 43(11), 2195-2203. Retrieved from
https://dx.doi.org/10.1249/mss.0b013e31821f5d4e. doi:10.1249/mss.0b013e31821f5d4e Davis, J. N., Kelly, L. A., Lane, C. J., Ventura, E. E., Byrd-Williams, C. E., Alexandar, K. A., . .
. Goran, M. I. (2009a). Randomized Control Trial to Improve Adiposity and Insulin Resistance in Overweight Latino Adolescents. 17(8), 1542-1548. Retrieved from https://dx.doi.org/10.1038/oby.2009.19. doi:10.1038/oby.2009.19
Davis, J. N., Tung, A., Chak, S. S., Ventura, E. E., Byrd-Williams, C. E., Alexander, K. E., . . . Goran, M. I. (2009b). Aerobic and Strength Training Reduces Adiposity in Overweight Latina Adolescents. 41(7), 1494-1503. Retrieved from
https://dx.doi.org/10.1249/mss.0b013e31819b6aea. doi:10.1249/mss.0b013e31819b6aea Davis, J. N., Ventura, E. E., Alexander, K. E., Salguero, L. E., Weigensberg, M. J., Crespo, N.
C., . . . Goran, M. I. (2007). Feasibility of a home-based versus classroom-based nutrition intervention to reduce obesity and type 2 diabetes in Latino youth. International Journal of Pediatric Obesity, 2(1), 22-30. Retrieved from
https://dx.doi.org/10.1080/17477160601133077. doi:10.1080/17477160601133077 Diabetes Prevention Program Research, G., Knowler, W. C., Fowler, S. E., Hamman, R. F.,
Christophi, C. A., Hoffman, H. J., . . . Nathan, D. M. (2009). 10-year follow-up of diabetes incidence and weight loss in the Diabetes Prevention Program Outcomes Study. Lancet, 374(9702), 1677-1686. Retrieved from
https://www.ncbi.nlm.nih.gov/pubmed/19878986. doi:10.1016/S0140-6736(09)61457-4 Glenny, A. M., O'Meara, S., Melville, A., Sheldon, T. A., & Wilson, C. (1997). The treatment
Goran, M. I., Bergman, R. N., Cruz, M. L., & Watanabe, R. (2002). Insulin resistance and associated compensatory responses in african-american and Hispanic children. Diabetes Care, 25(12), 2184-2190. Retrieved from
https://www.ncbi.nlm.nih.gov/pubmed/12453958.
Hales, C. M., Carroll, M. D., Fryar, C. D., & Ogden, C. L. (2017). Prevalence of Obesity Among Adults and Youth: United States, 2015-2016. NCHS Data Brief(288), 1-8. Retrieved from https://www.ncbi.nlm.nih.gov/pubmed/29155689.
Kelly, L. A., Loza, A., Lin, X., Schroeder, E. T., Hughes, A., Kirk, A., & Knowles, A. M. (2015). The effect of a home-based strength training program on type 2 diabetes risk in obese Latino boys. J Pediatr Endocrinol Metab, 28(3-4), 315-322. Retrieved from https://www.ncbi.nlm.nih.gov/pubmed/25781537. doi:10.1515/jpem-2014-0470 Kiraly, C., Turk, M. T., Kalarchian, M. A., & Shaffer, C. (2017). Applying Ecological
Frameworks in Obesity Intervention Studies in Hispanic/Latino Youth:: A Systematic Review. Hisp Health Care Int, 15(3), 130-142. Retrieved from
https://www.ncbi.nlm.nih.gov/pubmed/29164940. doi:10.1177/1540415317731069 Lawrence, J. M., Mayer-Davis, E. J., Reynolds, K., Beyer, J., Pettitt, D. J., D'Agostino, R. B., Jr.,
. . . Group, S. f. D. i. Y. S. (2009). Diabetes in Hispanic American youth: prevalence, incidence, demographics, and clinical characteristics: the SEARCH for Diabetes in Youth Study. Diabetes Care, 32 Suppl 2, S123-132. Retrieved from
https://www.ncbi.nlm.nih.gov/pubmed/19246577. doi:10.2337/dc09-S204
Patrick, K., Norman, G. J., Davila, E. P., Calfas, K. J., Raab, F., Gottschalk, M., . . . Covin, J. R. (2013). Outcomes of a 12-Month Technology-Based Intervention to Promote Weight Loss in Adolescents at Risk for Type 2 Diabetes. Journal of Diabetes Science and Technology, 7(3), 759-770. Retrieved from
https://dx.doi.org/10.1177/193229681300700322. doi:10.1177/193229681300700322 Reicks, M., Banna, J., Cluskey, M., Gunther, C., Hongu, N., Richards, R., . . . Wong, S. S.
(2015). Influence of Parenting Practices on Eating Behaviors of Early Adolescents during Independent Eating Occasions: Implications for Obesity Prevention. Nutrients, 7(10), 8783-8801. Retrieved from https://www.ncbi.nlm.nih.gov/pubmed/26506384.
doi:10.3390/nu7105431
Rosenbaum, M., Nonas, C., Weil, R., Horlick, M., Fennoy, I., Vargas, I., & Kringas, P. (2007). School-Based Intervention Acutely Improves Insulin Sensitivity and Decreases
Inflammatory Markers and Body Fatness in Junior High School Students. 92(2), 504-508. Retrieved from https://dx.doi.org/10.1210/jc.2006-1516. doi:10.1210/jc.2006-1516 Rowley, W. R., Bezold, C., Arikan, Y., Byrne, E., & Krohe, S. (2017). Diabetes 2030: Insights
from Yesterday, Today, and Future Trends. Popul Health Manag, 20(1), 6-12. Retrieved from https://www.ncbi.nlm.nih.gov/pubmed/27124621. doi:10.1089/pop.2015.0181 Savoye, M., Caprio, S., Dziura, J., Camp, A., Germain, G., Summers, C., . . . Tamborlane, W. V.
(2014). Reversal of Early Abnormalities in Glucose Metabolism in Obese Youth: Results of an Intensive Lifestyle Randomized Controlled Trial. 37(2), 317-324. Retrieved from https://dx.doi.org/10.2337/dc13-1571. doi:10.2337/dc13-1571
PEDIATRICS, 127(3), 402-410. Retrieved from https://dx.doi.org/10.1542/peds.2010-0697. doi:10.1542/peds.2010-0697
Seo, D. C., & Sa, J. (2010). A meta-analysis of obesity interventions among U.S. minority children. J Adolesc Health, 46(4), 309-323. Retrieved from
https://www.ncbi.nlm.nih.gov/pubmed/20307819. doi:10.1016/j.jadohealth.2009.11.202 Shaibi, G. Q., Cruz, M. L., Ball, G. D., Weigensberg, M. J., Salem, G. J., Crespo, N. C., &
Goran, M. I. (2006). Effects of Resistance Training on Insulin Sensitivity in Overweight Latino Adolescent Males. Med Sci Sports Exerc, 38(7), 1208-1215. Retrieved from https://www.ncbi.nlm.nih.gov/pubmed/16826016.
doi:10.1249/01.mss.0000227304.88406.0f
Shaibi, G. Q., Konopken, Y., Hoppin, E., Keller, C. S., Ortega, R., & Castro, F. G. (2012). Effects of a Culturally Grounded Community-Based Diabetes Prevention Program for Obese Latino Adolescents. The Diabetes Educator, 38(4), 504-512. Retrieved from https://dx.doi.org/10.1177/0145721712446635. doi:10.1177/0145721712446635
Soltero, E. G., Olson, M. L., Williams, A. N., Konopken, Y. P., Castro, F. G., Arcoleo, K. J., . . . Shaibi, G. Q. (2018). Effects of a Community-Based Diabetes Prevention Program for Latino Youth with Obesity: A Randomized Controlled Trial. Obesity, 26(12), 1856-1865. Retrieved from https://dx.doi.org/10.1002/oby.22300. doi:10.1002/oby.22300
Spanakis, E. K., & Golden, S. H. (2013). Race/ethnic difference in diabetes and diabetic complications. Curr Diab Rep, 13(6), 814-823. Retrieved from
https://www.ncbi.nlm.nih.gov/pubmed/24037313. doi:10.1007/s11892-013-0421-9 The, N. S., Richardson, A. S., & Gordon-Larsen, P. (2013). Timing and duration of obesity in
Diabetes Care, 36(4), 865-872. Retrieved from
https://www.ncbi.nlm.nih.gov/pubmed/23223352. doi:10.2337/dc12-0536
Tuomilehto, J., Lindström, J., Eriksson, J. G., Valle, T. T., Hämäläinen, H., Ilanne-Parikka, P., . . . Uusitupa, M. (2001). Prevention of Type 2 Diabetes Mellitus by Changes in Lifestyle among Subjects with Impaired Glucose Tolerance. New England Journal of Medicine, 344(18), 1343-1350. Retrieved from https://dx.doi.org/10.1056/NEJM200105033441801. doi:10.1056/nejm200105033441801
Twig, G., Yaniv, G., Levine, H., Leiba, A., Goldberger, N., Derazne, E., . . . Kark, J. D. (2016). Body-Mass Index in 2.3 Million Adolescents and Cardiovascular Death in Adulthood. N Engl J Med, 374(25), 2430-2440. Retrieved from
https://www.ncbi.nlm.nih.gov/pubmed/27074389. doi:10.1056/NEJMoa1503840 Van Der Heijden, G., Wang, Z. J., Chu, Z. D., Sauer, P. J. J., Haymond, M. W., Rodriguez, L.
M., & Sunehag, A. L. (2010). A 12-Week Aerobic Exercise Program Reduces Hepatic Fat Accumulation and Insulin Resistance in Obese, Hispanic Adolescents. Obesity, 18(2), 384-390. Retrieved from https://dx.doi.org/10.1038/oby.2009.274.
doi:10.1038/oby.2009.274
Weigensberg, M. J., Ball, G. D., Shaibi, G. Q., Cruz, M. L., & Goran, M. I. (2005). Decreased beta-cell function in overweight Latino children with impaired fasting glucose. Diabetes Care, 28(10), 2519-2524. Retrieved from
https://www.ncbi.nlm.nih.gov/pubmed/16186290.
Weigensberg, M. J., Lane, C. J., Ávila, Q., Konersman, K., Ventura, E. E., Adam, T., . . . Spruijt-Metz, D. (2014). Imagine HEALTH: results from a randomized pilot lifestyle
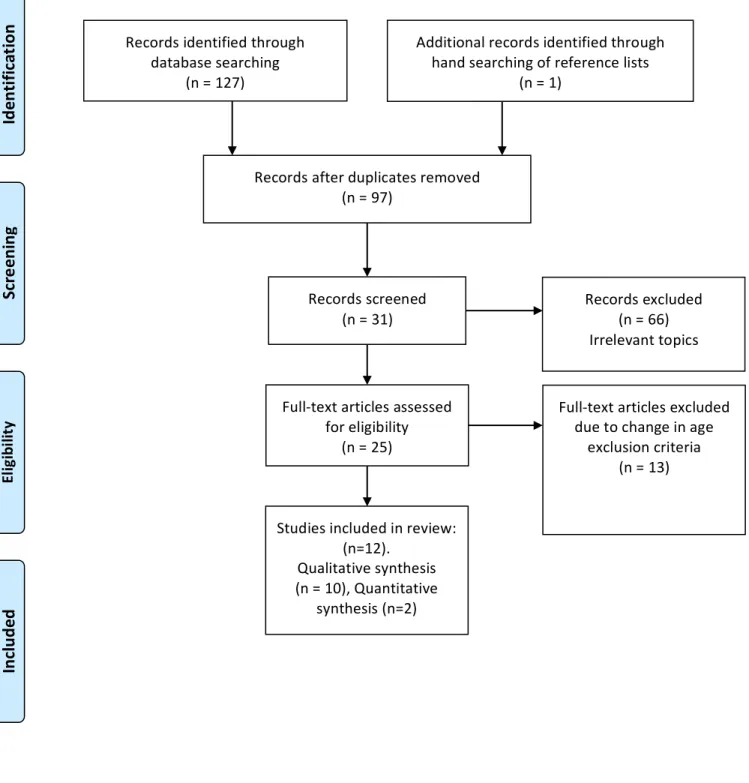
Figure 1. PRISMA Diagram
Records identified through database searching
(n = 127)
Sc
re
en
in
g
In
cl
ud
ed
El
ig
ib
ili
ty
Id
en
tif
ic
at
io
n
Additional records identified through hand searching of reference lists
(n = 1)
Records after duplicates removed (n = 97)
Records screened
(n = 31) Records excluded (n = 66) Irrelevant topics
Full-text articles assessed for eligibility
(n = 25)
Full-text articles excluded due to change in age
exclusion criteria (n = 13)
Studies included in review: (n=12).
Qualitative synthesis (n = 10), Quantitative
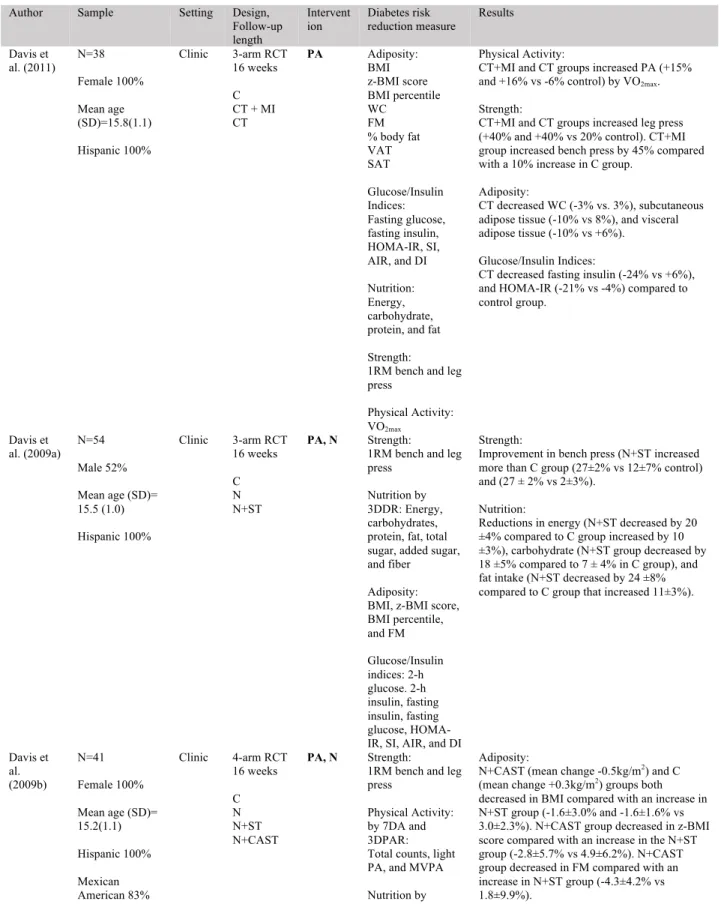
Table 1. Included Manuscripts
Author Sample Setting Design, Follow-up length
Intervent
ion Diabetes risk reduction measure Results
Davis et al. (2011) N=38 Female 100% Mean age (SD)=15.8(1.1) Hispanic 100%
Clinic 3-arm RCT 16 weeks
C CT + MI CT
PA Adiposity: BMI z-BMI score BMI percentile WC
FM % body fat VAT SAT Glucose/Insulin Indices: Fasting glucose, fasting insulin, HOMA-IR, SI, AIR, and DI
Nutrition: Energy, carbohydrate, protein, and fat
Strength: 1RM bench and leg press
Physical Activity: VO2max
Physical Activity:
CT+MI and CT groups increased PA (+15% and +16% vs -6% control) by VO2max.
Strength:
CT+MI and CT groups increased leg press (+40% and +40% vs 20% control). CT+MI group increased bench press by 45% compared with a 10% increase in C group.
Adiposity:
CT decreased WC (-3% vs. 3%), subcutaneous adipose tissue (-10% vs 8%), and visceral adipose tissue (-10% vs +6%).
Glucose/Insulin Indices:
CT decreased fasting insulin (-24% vs +6%), and HOMA-IR (-21% vs -4%) compared to control group.
Davis et al. (2009a)
N=54
Male 52%
Mean age (SD)= 15.5 (1.0)
Hispanic 100%
Clinic 3-arm RCT 16 weeks
C N N+ST
PA, N Strength:
1RM bench and leg press
Nutrition by 3DDR: Energy, carbohydrates, protein, fat, total sugar, added sugar, and fiber
Adiposity: BMI, z-BMI score, BMI percentile, and FM Glucose/Insulin indices: 2-h glucose. 2-h insulin, fasting insulin, fasting glucose, HOMA-IR, SI, AHOMA-IR, and DI
Strength:
Improvement in bench press (N+ST increased more than C group (27±2% vs 12±7% control) and (27 ± 2% vs 2±3%).
Nutrition:
Reductions in energy (N+ST decreased by 20 ±4% compared to C group increased by 10 ±3%), carbohydrate (N+ST group decreased by 18 ±5% compared to 7 ± 4% in C group), and fat intake (N+ST decreased by 24 ±8% compared to C group that increased 11±3%).
Davis et al. (2009b) N=41 Female 100%
Mean age (SD)= 15.2(1.1)
Hispanic 100%
Mexican American 83%
Clinic 4-arm RCT 16 weeks
C N N+ST N+CAST
PA, N Strength:
1RM bench and leg press
Physical Activity: by 7DA and 3DPAR: Total counts, light PA, and MVPA
Nutrition by
Adiposity:
3DDR: Energy, carbohydrate, protein, fat, total sugar, added sugar, and fiber
Glucose/Insulin Indices: Fasting glucose, fasting insulin, 2-glucose, 2-h insulin, SI, AIR, and DI
Adiposity: BMI, z-BMI score BMI percentile, and FM
Strength:
N+ST group increased in bench press more than the N and N+CAST groups (36.7±28.1% vs 0.04 ±14.7% and 2.5±23.9%). N+ST group increased in leg press more compared with the C group (28.9±25.2% vs -2.2±1.6%).
Nutrition:
N+CAST decreased total sugar (g·d-1) by 45.7±23.8% compared with a 4.9±47.9% increase in the C group. N group decreased added sugar (g·d-1) by 38.7±50.3% compared with a 14.9±49.2% increase in the C group and 44.7±24.3% increase in the N+CAST.
Davis et al. (2007)
N=23
Female 100%
Mean age (SD)= 14.2 (1.7) Hispanic 100% Group 1: Home Group 2: Clinic 2-arm RCT 12 weeks Home-based Classroom-based
N Adiposity: BMI, z-BMI score, WC, FM, and % body fat Glucose/Insulin Indices: Fasting insulin, fasting glucose, and HOMA-IR Nutrition by 3DDR: energy, fat, carbohydrate, protein, total sugars, added sugars, and fiber
Nutrition:
Both groups added sugar intake % of kcals decreased from 18.6% to 12.5% (33% decrease). Fiber (g/1000 kcals) increased from 8.6 g/1000kcals to 12.4 g/1000 kcals (44% increase). Carbohydrates (serving/day) decreased from 4.1±2.8 to 2.7±1.4 serving/day (35% decrease). Sugary beverages servings decreased from 1.9±1.7 to 0.6±0.6 servings/day (66% decrease). Energy intake decreased from 1878±737 kcal/day to 1456±469.
Adiposity:
Mean (SD) for z-BMI score: Home-based:
Baseline: 2.1(0.5) Week 12: 2.0(0.5)
Classroom-based: Baseline: 2.0(0.4) Week 12: 1.9(0.4)
Glucose/Insulin Indices:
N+CAST group decreased in fasting glucose and the N group increased (-4.4±6.6% vs 2.9± 5.9%). Kelly et al. (2015) N=26 Male 100% Mean age (SD)=15.48(0.2) Hispanic 100%
Home 2-arm RCT 16 weeks
C HBST
PA, MI Glucose/Insulin
Indices:
SI, AIR, DI, fasting glucose and 2-h glucose
Adiposity: BMI, FM, WC, % body fat
Strength: 1RM bench and leg press
Adiposity:
C group having significantly less FM at follow up compared to the HBST group
Mean (SD) for total fat mass (kg): Baseline: HBST 31.0(89.1) C 33.2(13.7) Follow-up: HBST 33.9(65.6), C 29.4(46.6)
Patrick et al. (2013)
N=101
Female 64%
Mean age (SD)= 14.3(1.5) Hispanic 74.3% Online/ mobile 4-arm RCT 12 months UC W WG WSMS
PA, N Adiposity:
z-BMI score BMI percentile % body fat
Nutrition: calories from fat, fruit and vegetable servings, MVPA, sedentary behavior, PA behavior strategies,
Nutrition:
Fruit and vegetable behavior strategies changes in WG group compared to UC group, 2.4 to 3.0 vs 2.3 to 2.1 respectively.
fruit ad vegetable behavior strategies, dietary fat behavior strategies, and sedentary behavior strategies Rosenbau
m et al. (2007)
N=73
Mean age (SD)= 13.6(0.2) All of Dominican Republic background except 1
School 2-arm RCT 14 weeks
C INT
PA, N Adiposity:
BMI and % body fat Glucose/Insulin Indices: glucose, insulin, QUICKI, and AIR Adiposity:
Decrease in BMI and % body fat and increase in QUICKI in INT group compared to baseline BMI (kg/m2)
BMI INT group: Baseline: 24.7±1.4
Posttest: 24.0±1.5
% body fat C group: INT group: Baseline: 24.4±1.4
Posttest: 23.1±1.4
Glucose/Insulin Indices: QUICKI
INT group: Baseline: 0.33±0.01
Posttest: 0.35±0.01 Shaibi et al. (2006) N=22 Males 100%
Mean age (SD)= 15.1 (0.5) Hispanic 100% Comm unity 2-arm RCT 16 weeks C RT
PA Adiposity: BMI, BMI percentile, FM, and % body fat
Strength: 1RM bench and leg press Physical Activity: VO2max Glucose/Insulin Indices: Fasting insulin, fasting glucose, SI, AIR, and DI
Strength:
Increase from baseline in 1RM bench and leg press in the RT group compared to increase only in bench press in C group.
Mean (SEM) for 1RM bench press (kg): Baseline: C 55.8 (4.2), RT 43.4 (3.0) Post-test: C 59.9 (3.9), RT 53.9 (3.0)
Mean (SEM) for 1RM leg press (kg): Baseline: C 212.2 (12.5), RT 183.9 (12.1) Post-test: C 221.9 (14.4), RT 234.8 (15.8)
Glucose/Insulin Indices:
RT group increased mean insulin sensitivity compared with baseline.
Mean (SEM) for SI (x 10-4 min-1
•µU-1•mL-1):
Baseline: C 1.7(0.4), RT 2.3(0.3)
Post-test: C 1.8 (0.6), RT 3.2(0.3)
Adiposity:
% body fat decreased only in RT group
Mean (SEM) for percent body fat (%): Baseline: C 31.4 (1.6), RT 35.3 (2.4)
Post-test: C 30.7 (1.4), RT 32.8 (2.1)
Shaibi et
al. (2012) N=15 Female 50% Male 50% Mean age (SD)=15.0(0.9) Hispanic 100% Comm
unity 1-arm uncontrolle d 12 weeks
INT
PA, N Adiposity:
BMI, BMI percentile, z-BMI score, WC Physical Activity: VO2max, MVPA, physical inactivity, and screen time
Nutrition: dietary fat and fruits and vegetables
Adiposity:
Postintervention decrease in z-BMI score (2.0±0.1 kg/m2 to 1.9 ±0.2 kg/m2, -5.0%). Postintervention decrease in BMI percentile (96.3±1.1% to 95.0±1.5%, 1.3% change). Postintervention decrease in WC (107.0±4.3 cm to 103.1±5.0cm, -3.6%).
Physical Activity:
Postintervention increase in cardiorespiratory fitness +3.6 % in L/min and +5.2% in mL/kg/min compared to baseline.
Glucose/Insulin Indices
h glucose and 2-h insulin
time decreased nearly 47% from 178.6 + 40.5 to 95.0+26.4 minutes per day
Nutrition:
Postintervention decrease in fat intake (-39.4%).
Mean (SD) for fat intake (servings/day): Baseline: 3.3(0.3)
Postintervention: 2.0(0.2)
Glucose/Insulin Indices:
Postintervention decrease in 2-hr glucose (-10.8%) and 2-hr insulin (-23.6%) that all correspond to a 29.2 increase in SI by whole body insulin sensitivity index (2.4+0.3 to 3.1 + 0.3).
Soltero et
al. (2018) N=136 Female 54.4%
Age range: 14-16
Hispanic 100%
Comm
unity 2-arm RCT 3-months 12-month follow-up
COMP INT
PA, N Adiposity:
BMI, BMI percentile, % body fat, and WC
Glucose/Insulin Indices: Fasting glucose, fasting insulin, 2-hr glucose, 2-h insulin and SI
3 months:
Glucose/Insulin indices:
INT increase in SI (1.8±0.1 to 2.2±0.1) compared to COMP (1.7±0.2 to 1.7±0.1).
Adiposity:
INT reduction in BMI compared to COMP (34.9±0.7 kg/m2 vs 33.9+0.7 kg/m2, -1.02 kg/m2 change). INT reduction in BMI percentile compared to COMP (98.3±0.2% vs 97.7±0.2%, -0.37% change). INT reduction in % body fat compared to COMP (44.8±1.0% vs 42.8±0.8%, -2.52% change). INT reduction in WC compared to COMP (110.6±1.6 cm vs 107.1±1.5 cm, -1.86 change). INT reduction in % body fat compared to COMP (44.8±1.0% vs 42.8±0.8%, -2.52% change).
12 months:
Glucose/Insulin Indices
INT increase in SI did not remain significant compared to COMP.
Adiposity:
INT reduction in BMI compared to COMP (36.4±0.7kg/m2 vs 35.2±0.7kg/m2, -1.21 kg/m2 change. INT reduction in BMI percentile compared to COMP (98.5±0.1% vs 97.7±0.3%, -0.59% change). INT reduction in % body fat compared to COMP (46.3±1.1% vs 43.5±1.0%, -3.36% change) remained significant compared to controls. INT decrease in WC did not remain significant compared to COMP.
Van Der Heijden et al. (2010)
N=29; 15 obese, 14 lean
Female 53.3%, obese
Male 71.4%, lean
Mean age (SD)=15.6(0.4) obese, 15.1(0.3) lean
Hispanic 100%
Clinic 1-arm uncontrolle d 12 weeks
INT
PA Adiposity: BMI, % body fat, and FM Glucose/Insulin Indices: Glucose, insulin, and HOMA-IR Physical Activity: VO2max Adiposity:
In obese participants, hepatic fat content decreased from 8.9±3.2% to 5.6±1.8%, visceral fat content decreased from 54.7±6.0 cm2 to 49.6±5.5 cm2, FM decreased from 35.2±2.0 kg to 34.2±2.1 kg, and % body fat 38.3±1.5% to 37.3±1.6%.
Glucose/Insulin Indices:
In obese participants, HOMA-IR decrease indicated by decrease in fasting insulin (21.8+2.7 µU/mL to 18.2+2.4 µU/mL and HOMA-IR (4.9+0.7 to 4.1 +0.6).
Physical Activity:
Note. All results indicate statistical significance (p<0.05).
C, control; N, nutrition only; N+ST, nutrition + strength training; N+CAST, nutrition + combination of aerobic and strength training; RT, resistance training; HBST, home-based strength training; CT, aerobic + strength training; MI, motivational interviewing; GI, guided imagery; DS, digital storytelling; UC, usual care; W, website only; WG, website +group sessions; WSMS, website and shore message service; COMP, comparison group; INT, intervention group; SEM standard error of the mean; SE, standard error; VAT, visceral adipose tissue; SAT, subcutaneous adipose tissue; WC, waist circumference; HOMA-IR, insulin resistance; MVPA, moderate to vigorous physical activity; 3DPAR, 3-d physical activity recall; 3DDR, 3-day diet records; PA, physical activity; OGTT, oral glucose tolerance test; FSIVGTT, frequently sampled intravenous glucose tolerance test; SI, insulin sensitivity; AIR, acute insulin response; DI, disposition index; 1RM, one-repetition maximum; QUICKI, quantitative insulin sensitivity check index; BMI, body mass index; FM, total fat mass; 7DPAR, 7-day physical activity recall interview; 7DA, 7-day accelerometry
increased by 13+2% from 2.45±0.15 L/min to 2.75±0.18 L/min.
Weigensb erg et al. (2014)
N=35
Age range: 14-16
Hispanic 100%
Clinic 2-arm RCT 12 weeks
GI DS
PA, N Physical Activity
by 3DPAR: Sedentary, moderate PA, MVPA, vigorous PA
Nutrition by 3DDR: Energy, carbohydrates, fat, protein, total sugars, added sugars, total fiber, soluble fiber, and insoluble fiber
Adiposity: BMI, z-BMI score, % body fat, and WC
Glucose/Insulin Indices: SI and HOMA-IR