ISSN-L: 2501 - 1235 Available on-line at: www.oapub.org/edu
doi: 10.5281/zenodo.3369407 Volume 5 │ Issue 11 │ 2019
INVESTIGATION OF PHYSICAL CONFORMITY LEVELS
OF WOMEN CYCLING AND NON-ATHLETES
IN 12-14 YEARS CATEGORY
Aliye Büyükergüni
Istanbul Gelişim University, School of Physical Education and Sports, Turkey
Abstract:
Purpose: The purpose of this research; Physical fitness of 12-14-year-old cycling
athletes. Methods: Twenty-five girls cycling athletes and 22 non-athletes participated in
the study. Participants were asked about the number of training sessions, daily training duration, and sports histories. Participants who were close to each other according to the answers given were included in the study. According to the normality test results of the groups, Independent correlation T-test and parametric tests were used to determine
the correlation between the parameters. Conclusions: In the study, it was found that the
flexibility level of bicycle athletes was higher than the non-sport group. In our study, body mass index and body fat ratio values were found to be significantly lower when compared with children in the same age group who did not do sports. As a result, cycling in children is thought to be effective for health-related physical fitness components. Considering these differences between cycling athletes aged 12-14 years and non-athletes, significant differences in parameters such as flexibility, body fat ratio, and body mass index were observed in cycling athletes.
Keywords: cycling, physical fitness, body composition
1. Introduction
Physical activity, physical fitness, and nutrition are factors that affect health from childhood to adulthood. Changes in the body, especially during adolescence, once again reveal the importance of physical fitness (Çolak 2007). For this reason, physical fitness tests are used to measure the levels of growth, maturation and physical activity of children or adolescents, as well as to evaluate the effects of physical activities on growth and development, and to investigate their responses to various exercises.
2. Literature Review
Bike sport is one of the sports of cycling, which is a non-motorized vehicle that moves with the road-dependent balance of two wheels with the mechanism of activation of human power (Morpa, 2005).
Considering the health-related dimensions of cycling and the effects of cycling load times;
- 10 minutes; circulation of blood, muscles, and joints, - 20 minutes; immune system,
- 30 minutes; changes in heart function,
- 40 minutes; development of aerobic capacity, - 50 minutes; effects on fat metabolism,
- It provides anti-stress and tranquility for 60 minutes or more (Froböse, 2006).
Physical fitness according to the definition of the World Health Organization; social, mental and physical well-being. According to Baltacı (2008), physical fitness; in general, it is the ability to achieve daily activities with physical, physiological and psychological well-being, without excessive fatigue. In other words; physical fitness is the highest efficiency of performance during daily activities and healthy performance of the organism. When physical and physiological changes that occur with a decrease in physical activity rate and sudden growth during adolescence are examined, it is necessary to determine the level of physical fitness in children especially at these stages (Çolak, 2007).
However, the excess mass of fat, aerobic energy system is used in sports to move from one place to a place for a long time and the oxygen rate per weight has been found to affect the performance negatively (Akgun,1986). Taking this information into consideration, the aim of this study was to determine the physical fitness of female bicycle athletes in the 12-14-year-old star category of the Municipality of Esenyurt and to compare them with the children who did not do sports.
3. Material and Methods
3.1. Methodology
The purpose of the study and the application processes were explained to the participants in detail, and the parents of the subjects were asked to fill in the written consent form.
3.2. Data Analysis
Homogeneity tests were used to determine whether the variables show normal distribution. In the study, a paired comparison was made and the correlation between the parameters and correlation analysis was examined. In statistical evaluation, analyses were performed using SPSS 25.0 package program. All tests were evaluated at a significance level of 0.05 and a 95% confidence interval. Shapiro Wilk normality test was used to determine the normality level of the participants' test scores. Also, when the skewness and Kurtosis coefficients were taken into consideration, all the scores were found to be within ± 3 range. Since Shapiro Wilk was considered to be significant (p <0.05), it was decided to use parametric statistical techniques. Independent sample T-test was used to determine the difference between the two groups.
4. Results and Discussion
Table 1: Descriptive Statistics of Anthropometric Characteristics
Groups Varians n Mean ± Sd Min. Mak.
Cycling Age (year) 25 13,20 ± 0,81 12 14
Height (cm) 25 1,57± 0,90 130 175
Body Weight (kg) 25 52,36 ± 12,26 29 74
Non-athletes Age (year) 22 13,45 ± 0,59 12 14
Height (cm) 22 1,60 ± 0,87 130 186
Body Weight (kg) 22 53,06 ± 11,42 29 76
When Table 1 was examined, the average age of the cycling athletes was found to be 13.20 ± 0.81 and the mean age of the non-athletes group was 13.45 ± 0.59.
When the average height of the groups was examined, the average height of the cycling athletes was found to be 1.57 ± 0.90, and the average height of the non-athletes was 1.60 ± 0.87.
When the average body weight of the groups was examined, the average body weight of cycling athletes was 52.36 ± 12.26 and the average body weight of non-athletes was 53.06 ± 11.42.
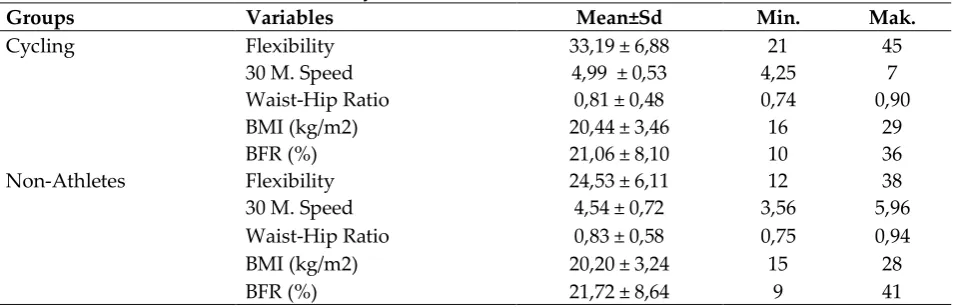
Table 2: Physical fitness measurement results
Groups Variables Mean±Sd Min. Mak.
Cycling Flexibility 33,19 ± 6,88 21 45
30 M. Speed 4,99 ± 0,53 4,25 7
Waist-Hip Ratio 0,81 ± 0,48 0,74 0,90
BMI (kg/m2) 20,44 ± 3,46 16 29
BFR (%) 21,06 ± 8,10 10 36
Non-Athletes Flexibility 24,53 ± 6,11 12 38
30 M. Speed 4,54 ± 0,72 3,56 5,96
Waist-Hip Ratio 0,83 ± 0,58 0,75 0,94
BMI (kg/m2) 20,20 ± 3,24 15 28
When we examine Table 2, the average flexibility values of the cycling athletes were 33,19 ± 6,88, and the average flexibility values of the non-athletes group were 24,53 ± 6,11.
30 m. speed data averages of cycling athletes 30 m. speed data average 4.93 ± 0.55, 30 m. The average speed data was 4.54 ± 0.72.
When the hip ratio values of the groups were examined, the average waist-hip ratio values of the cycling athletes were 0.81 ± 0.48 and the average waist-waist-hip ratio of the non-athletes group was 0.83 ± 0.58.
When the body mass index of the groups was examined, the average body mass index of the cycling athletes was 20.44 ± 3.46 (kg / m2) and the mean body mass index of the non-athletes group was 20.20 ± 3.24 (kg / m2).
When the mean body fat percentage of the groups was examined, the mean body fat percentage of the cycling athletes was found to be 21.06 ± 08.10 and the mean body fat percentage non-athletes group was 21.72 ± 8.64.
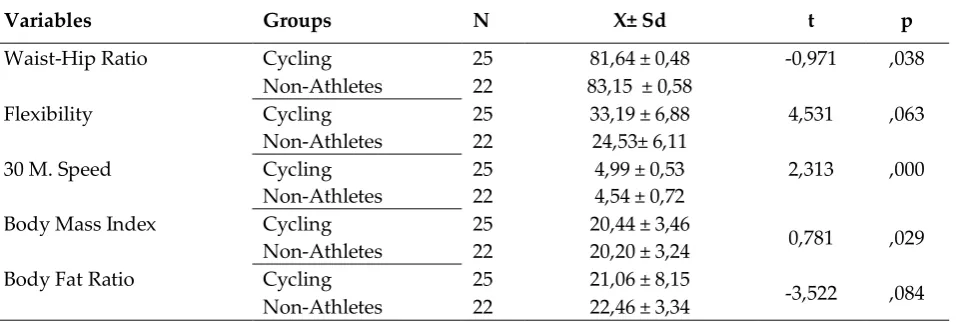
Table 3: Comparison of cycling athletes and non-athletes group with independent samples t-test for body composition measurements
Variables Groups N X± Sd t p
Waist-Hip Ratio Cycling 25 81,64 ± 0,48 -0,971 ,038
Non-Athletes 22 83,15 ± 0,58
Flexibility Cycling 25 33,19 ± 6,88 4,531 ,063
Non-Athletes 22 24,53± 6,11
30 M. Speed Cycling 25 4,99 ± 0,53 2,313 ,000
Non-Athletes 22 4,54 ± 0,72
Body Mass Index Cycling 25 20,44 ± 3,46
0,781 ,029 Non-Athletes 22 20,20 ± 3,24
Body Fat Ratio Cycling 25 21,06 ± 8,15
-3,522 ,084 Non-Athletes 22 22,46 ± 3,34
When we look at Table 3, there is a significant difference between the two groups according to the p<0.05 confidence interval in the average waist-hip ratio values of cycling athletes and non-athletes.
When the flexibility values of the groups were examined, no difference was observed between the groups in favor of cycling athletes. 30 m speed.
When the speed data averages were examined, it was found that there was a difference between the groups.
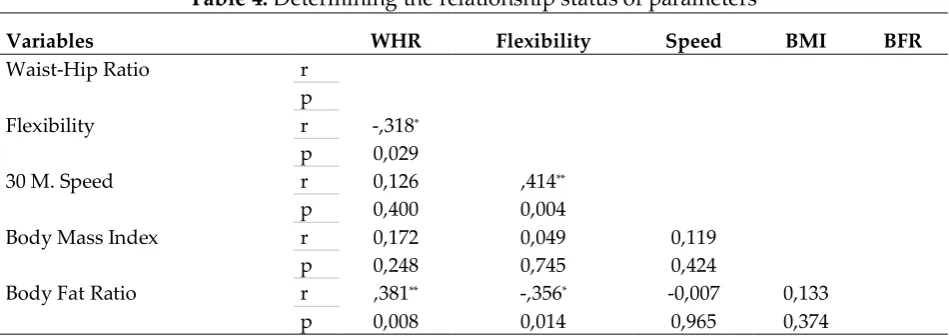
Table 4: Determining the relationship status of parameters
Variables WHR Flexibility Speed BMI BFR
Waist-Hip Ratio r
p
Flexibility r -,318*
p 0,029
30 M. Speed r 0,126 ,414**
p 0,400 0,004
Body Mass Index r 0,172 0,049 0,119
p 0,248 0,745 0,424
Body Fat Ratio r ,381** -,356* -0,007 0,133
p 0,008 0,014 0,965 0,374
When Table 4 was analyzed; there was a low negative correlation between the waist-hip ratio and flexibility level (r =, -, 318, p =, 029).
When the relationship between speed and elasticity is examined, it is found that there is a moderate positive relationship (r =, 414, p =, 004).
The relationship between body mass index and waist-hip ratio; low level negative relationship (p <0.05).
When the relationship between body fat ratio and waist-hip ratio; low-level positive relationship (p <0.05). Similarly, when the relationship between body fat ratio and flexibility was examined, it was found that there was a moderate negative relationship (r =, -, 356, p =, 0.014).
5. Discussion
Twenty-five female cycling athletes and 22 non-sporting students from the same age group participated in the study.
When similar studies are examined; Kalkavan et al. (1996) compared some physical and physiological parameters of athletes from three different branches with sedentary children whose age range was 12-15 years; found that the flexibility test results of the athletes were significantly higher than the sedentary group.
In contrast to our study, Berg et al. (1995) found many physical and anthropometric differences between sedentary and athletic children but found no significant difference in the flexibility parameter.
Watts et al. (2003) found that climbers engaged in various sports between the ages of 11 and 12 found significant differences in terms of BMI among inactive children. In our study, a significant difference was found in terms of BMI in cycling athletes and non-athletes.
Bilim (2014) stated that body fat ratio was significantly lower in the 12-13 age group compared to the same age group who did not do sports. This study is similar to our study.
in our study, it was found that the body fat ratio of cycling athletes was significantly lower than the non-sports group.
Physical fitness includes cardiovascular endurance, muscular endurance, muscular strength, speed, flexibility, agility, balance, response time and body composition. These characteristics are important in terms of sports performance and maintaining a healthy life (Ayan and Mülazimoğlu, 2009).
We can say that the rate of sports injuries is low in individuals with good physical fitness, and the rate of developing heart diseases and metabolic diseases in the following periods is low (Murphy et al., 2002).
6. Conclusion and Recommendations
Physical activity is known to have many benefits for children. Considering this situation, it is thought that directing children to physical activity will contribute to the success of children in their educational and social life.
In this study, we found that the level of flexibility was higher in cycling athletes compared to the groups. In body fat ratio values, it was observed that the body fat ratio of bicycle athletes is quite low compared to children who do not do sports.
Considering that participants aged 12-14 are in their developmental stages, it can be said that aerobic studies provide benefits to the physical development of children in this age group.
Considering that waist-to-hip ratio is an indicator of obesity, it is observed that cycling athletes' waist-to-hip ratio shows lower values than children who do not do sports, and the positive effect of cycling on combating obesity is remarkable.
In conclusion, it can be said that cycling in children has positive effects on body fat ratio, flexibility, and agility.
References
Akgün N. (1996). Exercise and Sport Physiology. Ege University Press, Izmir. 6. Edition II. Skin
Ayan V. Mülazimoğlu O. (2009). Examination of physical characteristics and some performance profiles of 8-10 year old boys in sport selection and orientation in sports (Ankara Case). FÜ Sağ Bil Medical Journal. 113-8.
Berg K. E., LaVoie J. C., Latin R. W. (1995). Physiological Training Effect Of Youht Soccer. Med. Sci. Sports Exerc. Dec; 17 (6), 656-60.
Bilim A. S., Çetinkaya C., Dayı A., (2014). Investigation of Physical Fitness of Students Between 12-17 Years of Sports and Non-Sports, Journal of Sport and Performance Research, Pg. 53-60.
Çolak E., (2007). Journal of Turkish Pharmacists Association, Issue 4, July-August, Ankara.
Kalkavan A., Zorba E., Ağaoğlu Ş. A., Karakuş Ş., Çolak H., (1996). A comparison of different sports branches’ players and sedentary group’s physical fitness parameters. Journal of Physical Education and Sport Sciences.3, 25-35.
Morpa Sports Encyclopedia, (2005). Cilt 1.
Murphy M. H., Nevill A. M., Neville C., Biddle S., Hardman A. E., (2002). Accumulating brisk walking for fitness, cardiovascular risk, and psycho-logical health. Med Sci Sports Exerc.
Creative Commons licensing terms