1 CAN EDUCATIONAL AND ECONOMIC EMPOWERMENT BE DANGEROUS?
PATTERNS OF INTIMATE PARTNER VIOLENCE AMONG WOMEN IN RWANDA
by
Bhavyathmika Reddy
A paper presented to the faculty of The University of North Carolina at Chapel Hill in partial fulfillment of the requirements for the degree of Master of Public Health in the Department of Maternal and Child Health
Chapel Hill, North Carolina November 15, 2014
Approved by:
Advisor, First Reader
2 CONTENTS
Abstract ……….… 3
Background ……….….. 4
Methods ……….…... 7
Results ………...… 10
Discussion ……….….…. 18
References ………..…. 22
Tables Table 1: Selected Characteristics of Ever-Partnered Women Aged 15-49 and Experience of Physical and/or Sexual IPV in the Last 12 Months ……….….12
Table 2: Crude and Adjusted Odds Ratios and 95% Confidence Intervals for Relative Education, Selected Characteristics and Physical and/or Sexual IPV in the Last 12 Months among Ever-Partnered Women Aged 15-49……….…14
Table 3: Selected Characteristics of Currently-Partnered Women Employed for Cash, Aged 15-49 and Experience of Physical and/or Sexual IPV in the Last 12 Months...16
3 ABSTRACT
Objectives:This study sought to examine if women in Rwanda who exceed their partner’s educational achievements and earnings face an increased risk of intimate
partner violence (IPV).
Methods: The study used secondary data from the 2010 Rwanda Demographic and Health Survey of women aged 15-49 years. Ever-partnered women who responded to the
Domestic Violence Module (n=3,476) were selected for analysis. Multivariate logistic
regression was used to determine if women who were more educated than their partner
experienced higher odds of IPV in the preceding 12 months of the survey. Multivariate
logistic regression was also conducted among employed women who earned cash
(n=1830) to determine if earning more than your partner was associated with increased
odds of experiencing IPV in the preceding 12 months.
Results: The odds of IPV were higher among women who were more educated than their partner compared to women who were less educated (OR=1.30, 95% CI=1.10-1.54), and
higher among women who earned more than their partner compared to women who
earned less (OR=1.48, 95% CI=1.05-2.09). Another factor associated with higher odds of
IPV was living with a partner. Employment without cash earnings, younger (15-24 years)
and older (≥35 years) age and urban residence were factors protective against IPV.
Conclusions: Being more educated and earning more than your partner are risk factors for IPV among women in Rwanda. To prevent an unintendedbacklash arising from
improvements in women’s status, programs that aim to increase educational attainment
among girls and improve economic opportunities for women must also engage boys and
4 BACKGROUND
Intimate partner violence (IPV) is a public health and human rights problem in Rwanda,
sub-Saharan Africa (SSA), and globally. The World Health Organization (WHO) defines
intimate partner violence as “behaviour within an intimate relationship that causes
physical, sexual, or psychological harm, including acts of physical aggression, sexual
coercion, psychological abuse and controlling behaviours”.1, p11 IPV is linked with a
number of adverse health outcomes among women such as depression, post-traumatic
stress disorder (PTSD), unplanned pregnancy, and sexually transmitted infections (STIs),
including HIV/AIDS.2 Identifying factors that put women at risk of experiencing IPV is
therefore crucial to addressing women’s health and development.
In Rwanda, IPV is widespread. Based on the 2010 Demographic and Health Survey
(DHS), more than half of all women aged 15-49 (56.4%) had experienced physical and/or
sexual violence by a husband or partner.3 This places the prevalence of IPV in Rwanda
considerably higher than the WHO estimated 36.6% for the Africa region, but lower than
the estimated 65.6% for central sub-Saharan Africa (SSA), which is the highest
prevalence among all regions globally.2 While these regional and sub-regional estimates
are now available, the WHO notes that central SSA is among the regions with the least
available data on IPV.2 Studies specific to IPV in Rwanda are also very limited.
Of the available studies from the SSA region, certain attitudes and behaviors are found to
be most consistently associated with IPV experience among women and perpetration by
men. These include accepting attitudes pertaining to wife beating among women4-8 and
5 having multiple sexual partners. Additionally, a number of studies, including from
Rwanda,17 have found that experiencing IPV is associated with positive HIV status
among women.5,18,19
Gender power imbalances are thought to underlie women’s vulnerability to IPV and
several studies from SSA highlight the role of male control in predicting IPV.20 Aspects
of male-control such as insisting on knowing about your partner’s whereabouts, limiting
contact with her family, and accusing her of unfaithfulness, have been found to be highly
associated with IPV among women.4,12,21 Likewise, several studies have found that
women’s autonomy in decision-making on issues such as one’s own healthcare and
household expenditure is protective against IPV.4,6,8,22
Poverty-related stress is also considered a key contributor to IPV.23 Men who have fewer
resources to reduce stress may be more likely to perpetrate IPV,23 and women may have a
greater tolerance for violence if they have limited resources and alternatives.24,25
Evidence on the association between socio-economic status (SES) and IPV in the SSA
region, though, is mixed. Higher education among women was shown to be protective
against physical5,6,19,20,22,26,27 and sexual violence.5,19 Mandal and Hindin12 also found an
inverse relationship between partner/husband’s education level and women’s experience
of physical IPV in Malawi. However, other aspects of SES such as employment,
occupation and income do not point to a clear direction of association. A multi-country
study of household wealth and IPV in SSA found that poor household wealth was
associated with higher odds of IPV in only two of six countries.28Okenwa et al.6 found
that women in Zambia engaging in higher income generating work were more exposed to
6 et al.16 found that women with a history of experiencing forced sex were of higher
economic status than other groups.
Choi and Ting25 suggest that spousal violence is shaped by the interaction between
male-provider and male-dominance norms with the actual distributions of resources and power
in relationships. Therefore, while women who are economically dependent on their
partner may be vulnerable to violence, women who hold a higher status than their partner
may also face an increased risk of violence by threatening gender norms of male
superiority. Studies in the United States have found a heightened risk of IPV among
couples where women’s earnings and educational achievements exceeded those of their
male partners,29-31 but few studies from the SSA region have looked at this type of
relationship inequality. In Lawoko et al.’s study of social status and IPV in Kenya,
having a higher occupational status than your spouse increased the odds of IPV.22 Antai4
found that earning more than your spouse increased the odds of IPV among women in
Nigeria. While both studies also looked at partner differentials in educational attainment,
the association between exceeding a partner’s educational status and IPV did not reach
statistical significance in these studies and elsewhere.20
On the whole, there has been limited exploration of the association between relationship
inequality, in areas of education and income, and IPV in the SSA context. To our
knowledge, no study has examined such factors on IPV in Rwanda. This study is
therefore concerned with exploring two hypotheses in Rwanda: (1) women who are more
educated than their partner will have increased odds of experiencing IPV; and (2) women
7
Country Context
Rwanda is a landlocked country situated in central SSA bordered by Uganda, Tanzania,
the Democratic Republic of the Congo and Burundi, with a population of approximately
10.5 million, based on the most recent census.32 The 1994 genocide in Rwanda resulted
in the loss of over 800,000 lives, most of them ethnic Tutsis.33 During this time, sexual
violence against women was used as a deliberate tactic of war. The United Nations
estimates that 250,000 women and girls were raped during this period, leading to
thousands of pregnancies.33 It is also regarded as at least partly responsible for the spread
of HIV infection among Rwandan women.12 The psychological impact on rape survivors in this setting is severe, characterized by feelings of shame, isolation and intense social
stigma, particularly from their own families and communities.33 It is important to note
that the use of sexual violence in armed conflict is known to further entrench pre-existing
patterns of male-dominance and the acceptance of violence among women.34
METHODS
Data
This study used data from the 2010-2011 Rwanda DHS, collected between September
2010 and March 2011. The survey includes a nationally representative sample of 13,671
women aged 15–49 from 12,540 surveyed households. Multistage sampling was used to
first select a random sample of enumeration areas, and then systematically select a
random sample of households in each enumeration area. All eligible women were asked
to be interviewed; however, in accordance with the WHO’s ethical and safety
recommendations for research on domestic violence, only one randomly selected woman
8 domestic violence questions. Of these women, only those who were ever married or ever
in-union were asked questions on IPV. This included women currently married, divorced,
separated or widowed as well as women currently or formerly living with a partner.
Therefore, the sample was restricted to 3,476 ever-partnered women. Women with
missing or unknown information about education, partner’s education, IPV and
covariates of interest were excluded. The final sample size was 3,402.
A second sample of 1,830 ever partnered women was selected for a sub-analysis to focus
on income. Only currently-partnered women who had worked in the last 12 months and
earned cash were included. Women with missing or unknown information about earning
relative to partner’s earning, IPV and covariates of interest were excluded. Women who
reported that their partner did not earn cash were also excluded. The final sample size for
the analysis was 1,747.
Measures of IPV
The outcome variable of interest is recent physical and/or sexual violence, captured in the
survey by a series of questions that are based on a shortened version of the Modified
Conflict Tactics Scale.3, p239 IPV was measured by a woman’s report in the last 12 months
that she experienced any of the following acts by a current or former husband or partner:
being (i) pushed, shaken, or having had something thrown at her; (ii) slapped; (iii)
punched with a fist or hit with something harmful; (iv) kicked or dragged; (v) strangled
or burnt; (vi) threatened with a knife, gun or other weapon; (vii) twisted by the arm or
having hair pulled; (viii) forced into unwanted sex; and (ix) forced to perform any sexual
9 classified as having experienced physical and/or sexual IPV; respondents who answered
“no” to all acts were classified as not having experienced IPV.
Measures of partner status inequality
Measures of partner status inequality were based on (a) the woman’s level of education
relative to her partner’s level of education; and (b) her earning level relative to her
partner’s earning level. Relative education was constructed using continuous variables for
the woman’s education and her partner’s education. Women with fewer years of
education compared to their partner were classified “less educated than partner”. Women
who had the same number of years of education as their partner were categorized “as
educated as partner”. Women who had more years of education relative to their partner
were categorized “more educated than partner”. Currently partnered women who had
worked in the preceding 12 months and earned cash were asked “Would you say that the
money that you earn is more than what your husband/partner earns, less than what he
earns, or about the same?” Based on this variable, relative earning was categorized into
“less than partner”, “about the same” and “more than partner”.
Factors were controlled for based on their association with IPV in previous studies.
Education level was grouped into “no education”, “primary” and “secondary or higher”.
Age was grouped into “15-24”, “25-34” and “≥35”. Marital status was categorized into
“married” and “living with partner”. Wealth was categorized into “poor”, “middle” and
“rich”, and type of place of residence was categorized into “rural” and “urban”. To
distinguish paid work from unpaid work and earning in kind, employment in the
preceding 12 months was constructed with the categories "not working", "not paid cash"
10
Analysis
Both analyses were conducted using bivariate and multivariate logistic regression to
examine (i) whether or not relative education is associated with physical and/or sexual
IPV; and (ii) whether or not relative earning is associated with physical and/or sexual
IPV. Results are presented with odds ratios (OR) and 95% confidence intervals (CI). In
the first analysis examining relative education, factors adjusted for were woman’s
education level, age, marital status, paid employment, wealth and type of residence. For
the sub-analysis among women who were employed and earned cash, education level,
age, marital status, wealth and type of residence were adjusted for. All analyses were
performed using Stata version 13.1. This study is based on analysis of secondary data that
contain no personal identifiers. It was reviewed and considered exempt from human
subject research by the University of North Carolina at Chapel Hill Institutional Review
Board.
RESULTS
Characteristics of sample
More than a third of the women reported being more educated than their partner and
approximately a fifth reported being as educated as their partner. Approximately 70% had
primary education and less than 10% had secondary or higher education. Women
between ages 25-34 years made up nearly half the sample. The majority of women (64%)
were employed and earned cash and about a quarter were employed but were either not
paid or earned only in-kind; only 10% of women were not employed. Women currently
or formerly living with a partner made up 30% of the sample; the majority reported being
11
Prevalence of recent physical and/or sexual IPV
Approximately 45% of ever-partnered women reported physical and/or sexual violence in
the preceding 12 months. This is largely driven by the prevalence of physical violence,
which was reported by nearly 45% of women, while 14% percent of women reported
experiencing sexual violence only.
Prevalence of IPV by relative education and selected characteristics
Table 1 presents the distribution of physical and/or sexual violence by selected
characteristics. Prevalence of IPV was highest among women who were more educated
than their partner compared to women who were less educated or who had the same
number of years of education. Intimate partner violence was higher among women with
primary education compared to women with secondary or higher education, and also
when compared to women with no education. As for age, prevalence of IPV was highest
among women aged 25-34 compared to younger and older groups. A lower proportion of
married women reported IPV compared to women who were living with a partner.
Urban-rural differences are also observed; IPV was lower among women residing in
12 Table 1: Selected Characteristics of Ever-Partnered Women Aged 15-49 and
Experience of Physical and/or Sexual IPV in the Last 12 Months
n % of IPV Relative education
Less educated than partner 1,480 42.7
As educated as partner 703 42.7
More educated than partner 1,219 50.1
Education
No education 683 41.4
Primary education 2,399 47.1
Secondary or higher 320 40.3
Age
15-24 528 43.2
25-34 1,574 49.4
≥35 1,300 41.3
Paid employment
Not working 349 45.0
Not paid cash 883 42.5
Paid cash 2,170 46.6
Marital status
Married 2,426 42.3
Living with partner 976 52.9
Wealth
Poor 1,455 46.9
Middle 683 48.9
Rich 1,264 41.6
Place of residence
Rural 2,923 46.7
Urban 479 37.0
13
Relative education and selected characteristics associated with IPV
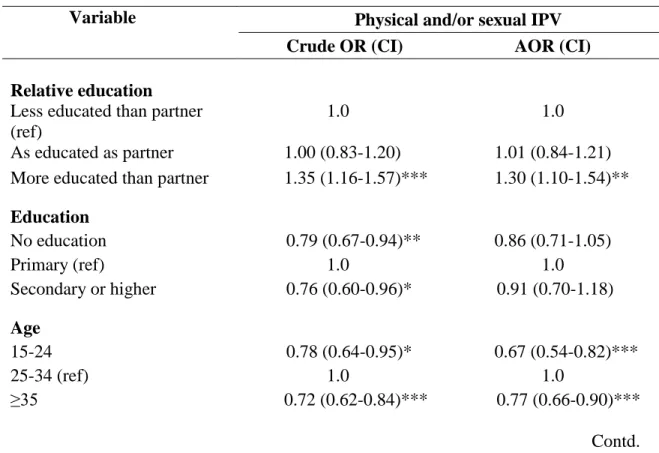
Table 2 presents the results of bivariate and multivariate logistic regression of relative
education, selected characteristics and physical and/or sexual IPV in the last 12 months.
Based on bivariate regression of relative education and IPV, women who were more
educated than their partner had 1.35 times the odds of experiencing IPV than women who
were less educated (95% CI=1.16-1.57). While bivariate analysis showed that education
was associated with IPV, it was not clearly protective. Women with secondary or higher
education had lower odds of experiencing IPV compared to women with primary
education (OR=0.76, 95% CI=0.60-0.96), however women with no education also had
lower odds of experiencing IPV compared to women with primary education (OR= 0.79,
95% CI= 0.67-0.94). Age also appeared to have a non-linear relationship with IPV.
Women in the 15-24 and ≥35 age groups were less likely to experience IPV compared to
women aged 25-34, though the protective effect was strongest among women aged ≥35
years (OR=0.77, 95% CI=0.66-0.90). Other protective factors based on bivariate analysis
were greater household wealth and urban residence. Compared to women belonging to
poor households, women from rich households were less likely to experience IPV
(OR=0.81, 95% CI= 0.69-0.94). Women residing in urban areas were also less likely to
experience IPV compared to women living in rural areas (OR=0.67, 95% CI=0.55-0.82).
Additionally, women who were employed but were unpaid or earned in kind had slightly
lower odds of experiencing IPV compared to women who earned cash (OR=0.85, 95%
CI=0.72-0.99). As for risk factors, women living with a partner were more likely to
14 After controlling for level of education, age, paid employment, marital status, wealth and
place of residence, the odds of experiencing IPV remained higher for women who were
more educated than their partner compared to women who were less educated (OR=1.3,
95% CI 1.10-1.54). Adjusted odds ratios for education and household wealth showed that
these factors were no longer associated with IPV after controlling for the other covariates.
However, age did remain significantly associated with IPV, with women in the 15-24 and
≥ 35 age groups much less likely to experience IPV compared to women aged 25-34. The
protective effect of urban residence also remained after controlling for other factors.
Finally, living with a partner remained a risk factor; these women experienced 1.62 times
the odds of IPV compared to married women (95% CI= 1.38-1.91).
Table 2: Crude and Adjusted Odds Ratios and 95% Confidence Intervals for Relative Education, Selected Characteristics and Physical and/or Sexual IPV in the Last 12 Months among Ever-Partnered Women Aged 15-49
Variable Physical and/or sexual IPV
Crude OR (CI) AOR (CI)
Relative education Less educated than partner (ref)
1.0 1.0
As educated as partner 1.00 (0.83-1.20) 1.01 (0.84-1.21) More educated than partner 1.35 (1.16-1.57)*** 1.30 (1.10-1.54)**
Education
No education 0.79 (0.67-0.94)** 0.86 (0.71-1.05)
Primary (ref) 1.0 1.0
Secondary or higher 0.76 (0.60-0.96)* 0.91 (0.70-1.18)
Age
15-24 0.78 (0.64-0.95)* 0.67 (0.54-0.82)***
25-34 (ref) 1.0 1.0
≥35 0.72 (0.62-0.84)*** 0.77 (0.66-0.90)***
15 Table 2: Crude and Adjusted Odds Ratios and 95% Confidence Intervals for Relative Education, Selected Characteristics and Physical and/or Sexual IPV in the Last 12 Months among Ever-Partnered Women Aged 15-49
Variable Physical and/or sexual IPV
Crude OR (CI) Adjusted OR (CI)
Paid employment
Not working 0.94 (0.75-1.18) 1.02 (0.81-1.30)
Not paid cash 0.85 (0.72-0.99)* 0.81 (0.69-0.95)*
Paid cash (ref) 1.0 1.0
Marital status
Married 1.0 1.0
Living with partner (ref) 1.53 (1.32-1.77)*** 1.62 (1.38-1.91)***
Wealth
Poor (ref) 1.0
Middle 1.08 (0.90-1.30) 1.08 (0.90-1.30)
Rich 0.81 (0.69-0.94)** 0.88 (0.74-1.04)
Place of residence
Rural (ref) 1.0 1.0
Urban 0.67 (0.55-0.82)*** 0.67 (0.53-0.83)***
*p ≤ .05. **p ≤ .01. ***p ≤ .001.
Prevalence of IPV by Relative Earning and Selected Characteristics
The overall prevalence of IPV was higher among currently partnered women who earn
cash compared to ever-partnered women (51% versus 45%). Among this subset of
women, IPV was highest among women who earned more than their partner compared to
women who earned less or about the same. The distribution of IPV by other
characteristics followed similar patterns to those seen in the larger ever-partnered sample,
16 Table 3: Selected Characteristics of Currently-Partnered Women Employed for Cash, Aged 15-49 and Experience of Physical IPV and/or Sexual in the Last 12 Months
n % of IPV Relative earning
Less than partner 1,223 50.4
About the same 365 48.5
More than partner 159 60.4
Education
No education 317 53.0
Primary education 1,268 51.4
Secondary or higher 162 42.6
Age
15-24 281 44.5
25-34 899 53.2
≥35 576 50.4
Marital status
Married 1,185 48.8
Living with partner 562 55.3
Wealth
Poor 690 52.9
Middle 366 55.5
Rich 691 46.5
Place of residence
Urban 219 46.6
Rural 1,528 51.5
Total 1,747 50.9
Relative Earning and Selected Characteristics Associated with IPV
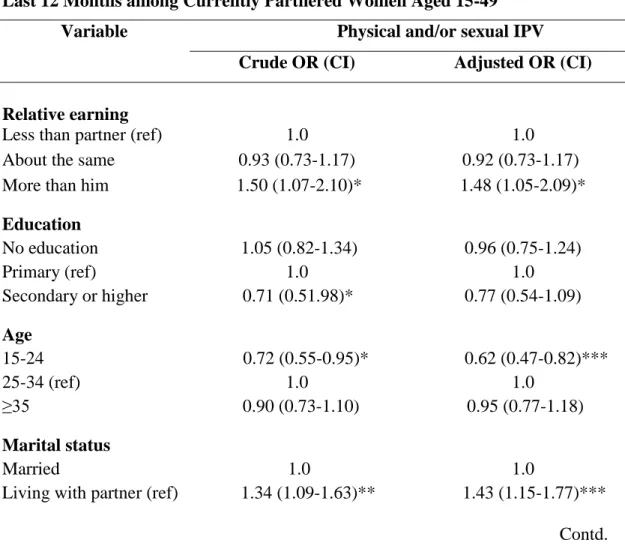
Results of the bivariate and multivariate analyses conducted among currently-partnered
employed women who earned cash is depicted in Table 4. Relative earning is associated
with experiencing IPV based on both crude and adjusted odds ratios. After controlling for
education, age, marital status, household wealth and place of residence, women who
17 women who earned less than their partner (OR=1.48; 95% CI=1.05-2.09). As for
covariates of interest, living with a partner was associated with 1.43 times the odds of
IPV compared to being married (95% CI=1.15-1.77). Young age had protective effects
after controlling for other factors; women aged between15-24 had lower odds of IPV
compared to women aged 25-34 (OR=0.62, 95% CI=0.47-0.82). Unlike the analysis
among ever-partnered women, place of residence was not an associated factor in this
model based on results of both crude and adjusted odds ratios.
Table 4: Crude and Adjusted Odds Ratios and 95% Confidence Intervals for Relative Earning, Selected Characteristics and Physical and/or Sexual IPV in the Last 12 Months among Currently Partnered Women Aged 15-49
Variable Physical and/or sexual IPV Crude OR (CI) Adjusted OR (CI)
Relative earning
Less than partner (ref) 1.0 1.0
About the same 0.93 (0.73-1.17) 0.92 (0.73-1.17)
More than him 1.50 (1.07-2.10)* 1.48 (1.05-2.09)*
Education
No education 1.05 (0.82-1.34) 0.96 (0.75-1.24)
Primary (ref) 1.0 1.0
Secondary or higher 0.71 (0.51.98)* 0.77 (0.54-1.09)
Age
15-24 0.72 (0.55-0.95)* 0.62 (0.47-0.82)***
25-34 (ref) 1.0 1.0
≥35 0.90 (0.73-1.10) 0.95 (0.77-1.18)
Marital status
Married 1.0 1.0
Living with partner (ref) 1.34 (1.09-1.63)** 1.43 (1.15-1.77)***
18 Table 4: Crude and Adjusted Odds Ratios and 95% Confidence Intervals for Relative Earning, Selected Characteristics and Physical and/or Sexual IPV in the Last 12 Months among Currently Partnered Women Aged 15-49
Variable Physical and/or sexual IPV
Crude OR (CI) Adjusted OR (CI)
Wealth
Poor (ref) 1.0 1.0
Middle 1.11 (0.86-1.4) 1.07 (0.82-1.38)
Rich 0.80 (0.65-0.98)* 0.82 (0.65-1.02)
Place of residence
Rural (ref) 1.0 1.0
Urban 0.80 (0.61-1.06) 0.91 (0.67-1.23)
*p ≤ .05. **p ≤ .01. ***p ≤ .001.
Discussion
The overall prevalence of IPV in this sample of women in Rwanda is high, as is the
prevalence in the SSA region. Patterns of IPV also do not clearly correlate with women’s
education or employment. The protective effect of primary education seen in other
studies, including from Rwanda,11 was not reflected here. Though the prevalence of IPV
was lowest among women with a secondary or higher education, it was highest among
women with a primary education, even compared to women with no education. This
concurs with findings from South Africa that indicate that women’s education had
protective effects at the lowest and highest levels.23 Jewkes23 suggests that in periods of
transition in gender relations, some education may empower women enough to challenge
gender roles, but “such empowerment carries an increased risk of violence until a high
enough level is reached for protective effects to predominate.” p6 Being more educated
19 placing the 34% of women who were more educated than their partner compared to
women who were less educated, at an increased risk of IPV. These findings suggest that
looking at relative educational attainment, rather than education alone, captures an
important risk factor for IPV among women in Rwanda.
The majority of women in the sample were currently employed and earned cash, and the
prevalence of violence was higher in this group compared to women who were not
working and those who were not paid or earned in kind. Interestingly, the odds of IPV
were lowest among women who were employed but not paid or earned only in kind,
compared to those who earned in cash. Though self-employment in the agricultural sector
comprised most paid and unpaid work in this sample, some women who were not paid or
paid only in kind also engaged in manual unskilled work. It is possible that earning in
cash prompts women to seek inclusion in financial decision-making,23 crossing into a
traditionally male-dominated role. Disaggregation of data by type of earning may
therefore be important in identifying employment related risk factors for IPV. Crucially,
among currently partnered women who earned cash, women who earned more than their
partner were more likely to experience IPV compared to women who earned less. This
may be a response by men who perceive themselves as failing to fulfill a male provider
norm, and IPV may be a mechanism to control the women who challenge it.25
A number of other factors appear to be associated with IPV in Rwanda. Though global
evidence shows that young age is a risk factor for IPV among women,1 these results
indicate an inverted U shaped relationship with age and IPV. Women aged ≥35 as well as
younger women aged 15-24 were less likely to experience violence compared to women
20 Antai’s findings on IPV among women in Nigeria.4 Urban and rural communities may
differ socio-culturally in SSA, with more traditional gender norms of male dominance
being upheld in rural areas. The higher prevalence of IPV in rural areas may be an
expression of comparatively greater gender-power imbalance in these settings.35
Among ever-partnered women as well as currently partnered women who earned cash,
women living with a partner compared to married women were significantly more likely
to experience IPV. In contrast, findings from a cohort study in Uganda5 found that
women who were in a relationship with a boyfriend had lower odds of IPV compared to
married women. However, it is unknown if these relationships involved cohabitation.
While cohabitation is a potential risk factor for IPV, it has received limited attention and
mixed results in the literature from SSA.
In conclusion, women who exceed their partner’s educational and earning status may be
transgressing conservative gender roles and challenging norms of male privilege and
control. As hypothesized, exceeding the educational and earning status of a male partner
does increase the risk of IPV for women in Rwanda. Other factors such as rural
residence, being aged between 25-34, and living with a partner may also be important to
consider for targeting IPV prevention and response interventions.
Strengths and limitations
The findings of this study should be considered within the context of its limitations.
Measures of IPV are based on self-reported data, and therefore susceptible to
underreporting. The sub-analysis relies on a subset of women who provided information
21 than your partner are only generalizable to employed women who earn cash. A strength
of this study is that it uses a nationally representative sample, making findings from the
model on relative education applicable to ever-partnered women of reproductive age in
Rwanda. Also, the standard measures of IPV followed by the DHS and used in this study
make findings on IPV comparable to a wide range of studies using the same measures.
Program and Policy Implications
As more girls access education and women access paid employment, distributions of
power and resources within relationships will continue to shift, challenging entrenched
gender norms. To prevent an unintendedbacklash arising from improvements in
women’s status, programs that aim to increase educational attainment among girls and
improve economic opportunities for women must also engage boys and men to foster
gender-equitable attitudes, norms and practices. More research is needed to understand
the relative importance of status inequality in relationships in predicting IPV in the SSA
22 REFERENCES
1. World Health Organization. Preventing intimate partner and sexual violence against women. taking action and generating evidence. Geneva, Switzerland: WHO; 2010.
2. World Health Organization. Global and regional estimates of violence against women: Prevalence and health effects of intimate partner violence and non-partner sexual
violence. Geneva: Switzerland: WHO; 2013.
3. National Institute of Statistics of Rwanda (NISR), Ministry of Health (MOH), ICF International. Rwanda demographic and health survey 2010. Calverton MD: NISR, MOH, and ICF International; 2012.
4. Antai D. Controlling behavior, power relations within intimate relationships and intimate partner physical and sexual violence against women in Nigeria. BMC Public Health. 2011;11:511-2458-11-511. doi: 10.1186/1471-2458-11-511 [doi].
5. Kouyoumdjian FG, Calzavara LM, Bondy SJ, et al. Risk factors for intimate partner violence in women in the Rakai community cohort study, Uganda, from 2000 to 2009.
BMC Public Health. 2013;13:566-2458-13-566. doi: 10.1186/1471-2458-13-566 [doi].
6. Okenwa L, Lawoko S. Social indicators and physical abuse of women by intimate partners: A study of women in Zambia. Violence Vict. 2010;25(2):278-288.
7. Owoaje ET, OlaOlorun FM. Women at risk of physical intimate partner violence: A cross-sectional analysis of a low-income community in southwest Nigeria. Afr J Reprod Health. 2012;16(1):43-53.
8. Shamu S, Abrahams N, Zarowsky C, Shefer T, Temmerman M. Intimate partner violence during pregnancy in Zimbabwe: A cross-sectional study of prevalence, predictors and associations with HIV. Trop Med Int Health. 2013;18(6):696-711. doi: 10.1111/tmi.12078 [doi].
9. Kayibanda JF, Bitera R, Alary M. Violence toward women, men's sexual risk factors, and HIV infection among women: Findings from a national household survey in Rwanda.
J Acquir Immune Defic Syndr. 2012;59(3):300-307. doi: 10.1097/QAI.0b013e31823dc634 [doi].
10. Tsai AC, Leiter K, Heisler M, et al. Prevalence and correlates of forced sex perpetration and victimization in Botswana and Swaziland. Am J Public Health. 2011;101(6):1068-1074. doi: 10.2105/AJPH.2010.300060 [doi].
23 12. Mandal M, Hindin MJ. Men's controlling behaviors and women's experiences of physical violence in Malawi. Matern Child Health J. 2013;17(7):1332-1338. doi: 10.1007/s10995-012-1137-1 [doi].
13. Fawole OL, Salawu TA, Olarinmoye EO. Intimate partner violence: Prevalence and perceptions of married men in Ibadan, Nigeria. Int Q Community Health Educ.
2009;30(4):349-364. doi: 10.2190/IQ.30.4.f [doi].
14. Olagbuji B, Ezeanochie M, Ande A, Ekaete E. Trends and determinants of pregnancy-related domestic violence in a referral center in southern Nigeria. Int J Gynaecol Obstet. 2010;108(2):101-103. doi: 10.1016/j.ijgo.2009.09.024 [doi].
15. Andersson N, Ho-Foster A, Mitchell S, Scheepers E, Goldstein S. Risk factors for domestic physical violence: National cross-sectional household surveys in eight southern African countries. BMC Womens Health. 2007;7:11. doi: 1472-6874-7-11 [pii].
16. Adudans MK, Montandon M, Kwena Z, Bukusi EA, Cohen CR. Prevalence of forced sex and associated factors among women and men in Kisumu, Kenya. Afr J Reprod Health. 2011;15(4):87-97.
17. Dude AM. Spousal intimate partner violence is associated with HIV and other STIs among married Rwandan women. AIDS Behav. 2011;15(1):142-152. doi:
10.1007/s10461-009-9526-1 [doi].
18. Dunkle KL, Jewkes RK, Brown HC, Gray GE, McIntryre JA, Harlow SD. Gender-based violence, relationship power, and risk of HIV infection in women attending antenatal clinics in South Africa. Lancet. 2004;363(9419):1415-1421. doi:
10.1016/S0140-6736(04)16098-4 [doi].
19. Osinde MO, Kaye DK, Kakaire O. Intimate partner violence among women with HIV infection in rural Uganda: Critical implications for policy and practice. BMC Womens Health. 2011;11:50-6874-11-50. doi: 10.1186/1472-6874-11-50 [doi].
20. Conroy AA. Gender, power, and intimate partner violence: A study on couples from rural Malawi. J Interpers Violence. 2014;29(5):866-888. doi:
10.1177/0886260513505907 [doi].
21. Deribe K, Beyene BK, Tolla A, Memiah P, Biadgilign S, Amberbir A. Magnitude and correlates of intimate partner violence against women and its outcome in southwest Ethiopia. PLoS One. 2012;7(4):e36189. doi: 10.1371/journal.pone.0036189 [doi].
22. Lawoko S, Dalal K, Jiayou L, Jansson B. Social inequalities in intimate partner violence: A study of women in Kenya. Violence Vict. 2007;22(6):773-784.
24 24. Anderson KL. Gender, status, and domestic violence: An integration of feminist and family violence approaches. J Marriage Fam. 1997;59:655-669.
25. Choi SY, Ting KF. Wife beating in South Africa: An imbalance theory of resources and power. J Interpers Violence. 2008;23(6):834-852. doi: 10.1177/0886260507313951 [doi].
26. Gass JD, Stein DJ, Williams DR, Seedat S. Gender differences in risk for intimate partner violence among South African adults. J Interpers Violence. 2011;26(14):2764-2789. doi: 10.1177/0886260510390960 [doi].
27. Groves AK, Moodley D, McNaughton-Reyes L, Martin SL, Foshee V, Maman S. Prevalence, rates and correlates of intimate partner violence among South African women during pregnancy and the postpartum period. Matern Child Health J. 2014. doi:
10.1007/s10995-014-1528-6 [doi].
28. Bamiwuye SO, Odimegwu C. Spousal violence in sub-Saharan Africa: Does household poverty-wealth matter? Reprod Health. 2014;11:45-4755-11-45. doi: 10.1186/1742-4755-11-45 [doi].
29. Allen C, Straus M. Resources, power, and husband-wife violence. In: Straus M, Hotaling G, eds. Social causes of husband-wife violence. Minneapolis: University of Minnesota Press; 1980:188-208.
30. Atkinson MP, Greenstein TN, Lang MM. For women, breadwinning can be
dangerous: Gendered resource theory and wife abuse. Journal of Marriage and Family. 2005;67(5):1137-1148. doi: 10.1111/j.1741-3737.2005.00206.x.
31. Kaukinen C. Status compatibility, physical violence, and emotional abuse in intimate relationships. Journal of Marriage and Family. 2004;66(2):452-471. doi: 10.1111/j.1741-3737.2004.00031.x.
32. National Institute of Statistics of Rwanda (NISR), Ministry of Finance and Economic Planning (MINECOFIN). Fourth population and housing census, Rwanda 2012. Final results: Main indicators report. 2012.
33. Mukamana D, Collins A. Rape survivors of the Rwandan genocide. Int J Crit Psychol. 2006;17:140-166.
34. MenEngage-UNFPA. Sexual violence in conflict and post-conflict: Engaging men and boys. MenEngage-UNFPA. 2012.