Alisa R. Hutchison. Librarian and User Perspectives of Durham County Public Library Services. A Master’s Paper for the M.S. in L.S degree. April, 2009. 77 pages. Advisor: Deborah Barreau.
This study determined the differences between users’ and librarians’ use, beliefs about importance, and satisfaction with services in one public library system. It also assessed whether librarians accurately gauge the users’ perspectives. 51 library users and 18 librarians participated in the study. The results indicate that these users and librarians use services to different extents and have different beliefs about the importance of services. The librarians did not accurately gauge users’ use or satisfaction with some services. However, these users and librarians have similar levels of satisfaction with many services and the librarians accurately gauged the users’ beliefs about importance of most services. This research suggests a new direction for library service evaluation: taking the
librarians’ perspectives into account.
Headings:
Public Libraries -- North Carolina Use Studies
LIBRARIAN AND USER PERSPECTIVES OF
DURHAM COUNTY PUBLIC LIBRARY SERVICES
by
Alisa R. Hutchison
A Master’s paper submitted to the faculty of the School of Information and Library Science of the University of North Carolina at Chapel Hill
in partial fulfillment of the requirements for the degree of Master of Science in
Library Science.
Chapel Hill, North Carolina April 2009
Approved by
1
Table of Contents
List of Tables ...2
Introduction and Background ...3
Method… ...9
Library ... 9
Participants... 10
Procedure ... 12
Results…...14
Visit frequency... 14
Reasons for visiting the library... 15
Frequency of use of services... 18
Users compared to librarians ... 18
Users’ responses compared to librarians’ perceptions... 24
Librarians compared to their perception of users ... 24
Importance of services ... 29
Users compared to librarians ... 29
Users’ responses compared to librarians’ perceptions... 33
Librarians compared to their perceptions of users... 35
Satisfaction with services... 35
Users compared to librarians ... 35
Users’ responses compared to librarians’ perceptions... 40
Librarians compared to their perceptions of users... 43
Discussion ...46
Conclusion ...53
References...54
Appendixes A. List of Durham County Library services ... 55
B. User Recruitment Flier ... 57
C. Librarian Recruitment E-mail ... 58
D. User Questionnaire... 59
E. Librarian Questionnaire... 65
2
List of Tables
Table 1: Users’ and Librarians’ Estimations of Library Visit Frequency of Users ...14 Table 2: Comparisons of Users’ and Librarians’ Perceptions of Users’ Reasons to Visit
the Library...19 Table 3: Users’ and Librarians’ Responses to Their Frequency of Use of Library
Services ...21 Table 4: Comparison of Users’ and Librarians’ Frequency of Use of Library Services ...23 Table 5: Comparison of Users’ Responses and Librarians’ Perceptions of Users’
Frequency of Use of Library Services ...25 Table 6: Librarians’ Perceptions of Users’ Frequency of Use of Library Services...26 Table 7: Comparisons of Librarians’ Responses and Perceptions of Users’ Frequency
of Use of Library Services ...27 Table 8: Responses to Importance of Library Services ...30 Table 9: Comparisons of Users’ and Librarians’ Beliefs about Importance of Library
Services ...32 Table 10: Comparisons of Users’ Responses and Librarians’ Perceptions of
Importance of Library Services to Users ...34 Table 11: Comparisons of Librarians’ Responses and Perceptions of Importance of
Library Services to Users...36 Table 12: Responses to Satisfaction with Library Services...38 Table 13: Comparisons of Users’ and Librarians’ Satisfaction with Library Services ...41 Table 14: Comparisons of Users’ Responses and Librarians’ Perceptions of Users’
Satisfaction with Library Services ...42 Table 15: Comparisons of Librarians’ Responses and Perceptions of Users’
3
Introduction and Background
In the wake of 21st Century technology, many public libraries are hurriedly adding more and more digital resources in an effort to attract users they feel are slipping out of their grasp. Librarians are constantly preoccupied with trying to keep their libraries up-to-date in the future-focused world of Web 2.0, Barnes & Noble, and Google. It is not enough for many public libraries to provide “free” books and information; now, they all want to go one step further and provide more of everything for “free.”
The changing image for public libraries is hotly debated within the Library and Information Science world, but it is not apparent how the users of these libraries feel about the paradigm shift. So many important decisions in public libraries are based on what librarians think they know about their patrons. They gather insight about patrons’ perceptions of their libraries through interactions in the library, patron surveys, and hearsay in the LIS news about other libraries (Stephens, 2006). The librarians then interpret the interactions, survey responses, and hearsay using their own expectations and perceptions about the library as a baseline.
It is important to recognize the librarians’ perspectives in order to better
4
when librarians do not know their patrons as well as they believe, the decisions they make only perpetuate the misunderstanding.
It is possible that librarians value certain services more than the users, which would affect their decision making process when evaluating supposedly user-centric services. Calling those services user-centric, when in fact they exist for the staff’s benefit may cause problems. It is therefore important to determine where the line, albeit fuzzy, may be drawn between services for users and services for staff. It is also important for the librarians to recognize this line so important resources are not wasted on promoting library services that exist primarily to help staff serve the users, rather than help users help themselves.
There is some opinion that the future of public libraries is without staff altogether. One strong opinion suggests that purely digital user-centric services will eventually replace librarians and libraries will be essentially assimilated by the internet. In a very provocative article, Coffman weighs the costs and benefits of brick-and-mortar libraries with human librarians to a centralized information intelligence system run purely using futuristic technology, like e-reference kiosks and print-on-demand stations. This all sounds very Science Fiction, but he points to present-day applications of these exact fantasies: the entirely self-service Singapore National Library and Brewster Kahle’s Internet Bookmobile (Coffman, 2006).
5
Libraries must not let the current focus on technology overshadow the activity of people who still read books for pleasure and visit their library in search of free, portable entertainment…. They may want more technology, but I’m not
convinced that they want it at the expense of books (Magzis, 2007).
These are just two examples of librarians’ opinions on the matter. Research indicates that Magzis’ opinions more accurately reflect the public library users’
preferences. In 2005, the Online Computer Library Center (OCLC) conducted an online survey to which almost 2000 U.S. residents responded about their perceptions and preferences of public libraries and electronic information resources. Of the respondents, 96% had visited a library in person, however 31% had used a library website.
Surprisingly, over half of the respondents did not know if their library had an online librarian question service (e-reference), e-books, electronic magazines/journals, online databases, or audiobooks. Additionally, 16% had used an online database, 13% had used an e-book, 9% had used an audiobook, and 5% had used e-reference. While most
respondents stated that their main purpose of using the library was for information, about a third responded that their main purpose was for books (De Rosa & OCLC, 2005). This data suggests that U.S. public library users are not quite ready for Coffman’s purely digital library.
6
Libraries (ARL) in association with Texas A&M. LibQUAL+™ measures service quality among three dimensions: affect of service, information control, and library as place. It asks survey respondents to rate a series of statements on a 9-point Likert Scale according to their minimum service level accepted, desired service level, and perceived service performance. Although originally intended for academic libraries, research has shown it to be a valid measure for the public library service context (Ladhari & Morales, 2008).
Before LibQUAL+™ came to the scene, SERVQUAL was used frequently to evaluate library services. It measured service quality among five dimensions: tangibles, reliability, responsiveness, assurance, and empathy. In 1994, Edwards and Browne published one of the few studies that evaluated the gaps between the expectations and perceptions of academic librarians and users for these broad service dimensions. The researchers found that for the most part, users and librarians agreed upon the ranked importance of the dimensions, but that librarians tended to over and under estimate the users’ perceptions of quality of certain services (Edwards & Browne, 1995).
7
One of the only other studies comparing librarians’ and users’ perceptions and expectations was done in 2003 in a New Zealand Academic Library. In this study, Xia focused on users’ satisfaction with and preferences for the digital library services offered by the University and the librarians’ perceptions of those preferences. Rather than using LibQUAL+™ or another standardized survey, the researcher created questionnaires for each group of participants that were based on those standardized measures to “determine the value and importance of the features of specific digital services from the perspective of the users” (Xia, 2003). This study found that there were differences between users’ and librarians’ perceptions and expectations of digital services. The librarians tended to favor certain services more than the users and were unaware that users felt there was a lack of information about some services (Xia, 2003).
Now, more than ever, libraries need to reevaluate the services they are providing to users. Because of the current economic crisis, budget cuts are being made in all levels of the government. Those are putting a considerable strain on public libraries, which now all have to make tough decisions about their provision of services. The services that are most effective and important to users need to be retained while under-used services may need to be considered for temporary elimination or reduction. Without asking library users and librarians what services they use and value, the wrong services may be cut or implemented.
This research study investigated the gap between user and librarian perspectives by exploring the following questions:
8 • Do users and librarians have different beliefs in the importance of any
services?
• Are users and librarians satisfied with the public library’s provision of services?
• Do librarians accurately gauge users’ perceptions and expectations of the public library’s services?
9
Method Library
This research was conducted at the Durham County Library system in Durham, North Carolina. There are a total of 256,000 residents in Durham County and over half of those (146,700) have a library card (G. Rozier, personal communication, January 7, 2009). The library system is composed of the downtown Main Library, two regional libraries (East Regional and North Regional), and four branch libraries (Bragtown, McDougald Terrace, Parkwood, and Stanford L. Warren) (Durham County Library, 2009). The library system circulated a total of 1,779,071 materials throughout the 2008 fiscal year (G. Rozier, personal communication, January 7, 2009). Among the circulating materials are audiobooks, videos, and over 470,000 fiction and non-fiction books. The library also has two special collections: North Carolina Collection and the Selena W. Wheeler Collection of African-American materials. They provide outreach library services to those outside of the physical libraries through the bookmobile and the Older Adult and Shut-In Service (OASIS) (Durham County Library, 2009).
10
Durham County Library Tech Talk (tech tips from staff), What’s up @ your Library (teen blog), and Discover Your Health Blog (health & wellness blog). Additionally, there are two staff member blogs: The Other Ebert (movie reviews) and Booklios (discussions on books, literature, technology, and libraries) (Durham County Library, 2009). A list of 23 services, ranging from traditional to digital, was compiled from the many offered by the Durham County Library system (see Appendix A).
Participants
The first group of participants consisted of a sample of 18 staff members of the Durham County Library system. In order to participate in the study, the staff members had to work at a public service desk and be over 18 years of age. There were a total of 72 out of 165 staff members who met the requirements. Library pages, temporary
employees, volunteers, or any staff members without any public service desk shifts were unable to participate. Among the respondents in this group, 16 were female and 2 were male. Eight were between ages 25 and 34, two were between 45 and 54 and eight were between 55 and 64. Additionally, five had five or less years of experience, seven had between 6 and 10 years of experience, five had between 11 and 30 years of experience, and one had 40 years of experience. Although 15 had a MLS or equivalent degree and 3 were para-professionals, this group will be referred to collectively as “librarians.” No ethnic, racial, or socio-economic data were collected.
11
the option of completing the survey during work hours, they did not receive monetary compensation for their participation.
The second group of participants consisted of a sample of 51 users of the Durham County Library system. In order to participate, the users were required to read and understand English, knowledgeably use the computer, have access to the internet, and be over 18 years of age. Among this group of respondents, 33 were female and 17 were male. Five were between the ages of 18 and 24, 17 were between 25 and 34, nine were between 35 and 44, nine between 45 and 54, nine between 55 and 64, and one was above 65 years of age. One respondent had a professional degree of some type, three had a doctoral degree, eight had a master’s degree, 15 had a 4-year college degree, three had a 2-year college degree, 13 had attended but not completed college, six had a high school diploma or GED, and two had not completed high school. No ethnic, racial, or socio-economic data was collected.
12
Participants in the library user group had a chance to enter a drawing for one of three $30 SuperCertificates from GiftCertificates.com. These certificates were able to be redeemed online for a gift certificate to one of hundreds of different retailers, restaurants, or hotels. A participant was required to get to the end of the survey in order to enter their e-mail address for the drawing. Data was collected for one month, and at the end of that time period, three random numbers were generated using Random.org’s Random Integer Generator. The e-mail addresses that corresponded to those random numbers were selected as the winners.
Procedure
The library users and librarians answered different but complementary surveys. The user survey took an average of 7 minutes to complete and the librarian survey took an average of 15 minutes to complete. Qualtrics Survey Software was used to design and host the surveys.
Users and librarians were asked to rate their frequency of use, beliefs of importance, and satisfaction with their library’s provision of each of the 23 services listed. Frequency of use was measured on a 7-point scale: daily, weekly, monthly, several times a year, at least once a year, not even once a year, or never. Importance and
satisfaction were also measured on 7-point scales from extremely important or very satisfied (7) to not at all important or very dissatisfied (1).
13
asked to rank 8 pre-selected reasons for visiting the library in order from the most common reason to visit (1) to the least common reason to visit (8). They were also
14
Results Visit frequency
Almost half of the users responded that they visited the library on a weekly basis. About one quarter responded that they visited daily. No users responded that they visited less than several times per year. Similarly, 44% of the librarians responded that they thought the “typical user” visited the library on a weekly basis. A quarter of the librarians responded that they thought the “typical user” visited on a monthly basis. No librarians responded that the “typical user” visits less than several times per year. Exact percentages of responses for each frequency level can be seen in Table 1. An independent samples t-test confirmed that there is no significant difference (p > .05) between the users’ self-reported visit frequency and the librarians’ estimation of users’ visit frequency. Table 1
Users’ and Librarians’ Estimations of Library Visit Frequency of Users
Frequency Users (n = 51) Librarians’ estimation (n = 16)
Daily 27% 19%
Weekly 49 44
Monthly 18 25
Several times per year 6 13
At least once per year 0 0
Not even once per year 0 0
15
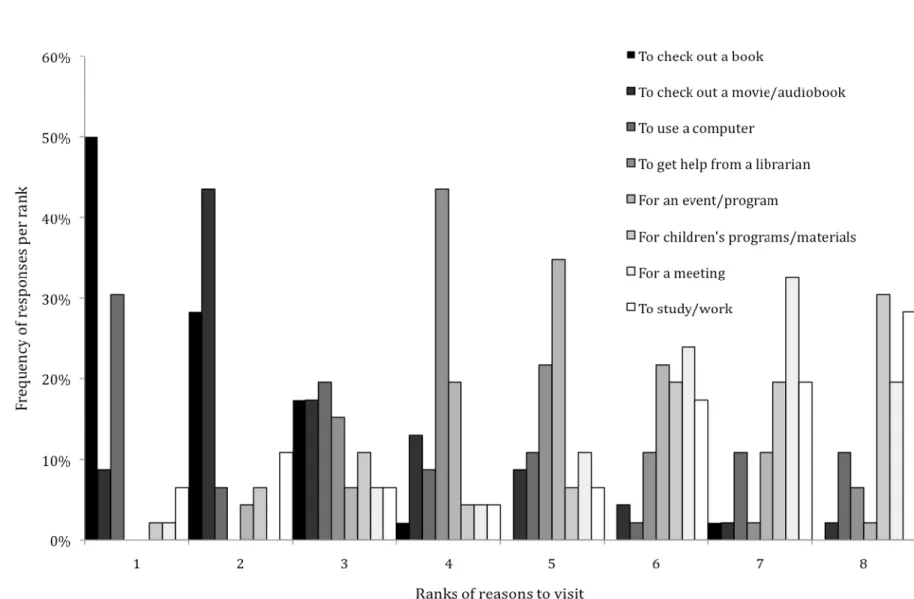
Reasons for visiting the library
Half of the users ranked “To check out a book” as the number one reason to visit the library. About one third of the users ranked “To use a computer” as the number one reason to visit the library. No users rated “To get help or ask a librarian a question” or “For an event or program” as the number one reason to visit the library. Nearly half of the users ranked “To check out a movie or audiobook” as the second most-common reason to visit the library. “For a children’s program” and “To study/work” were the two reasons most commonly rated as the 8th reason to visit the library (see Figure 1).
The following three text responses were given by users as other reasons to visit the library:
• Research, e-mail and letter-writing
• 1) To use business and/or job-hunting resources 2) Once a year, I get ta[x] forms from the library
• To feel like part of the community
Figure 1. Users’ assigned ranks for reasons to visit the library in order from most frequent reason to visit the library (1) to least
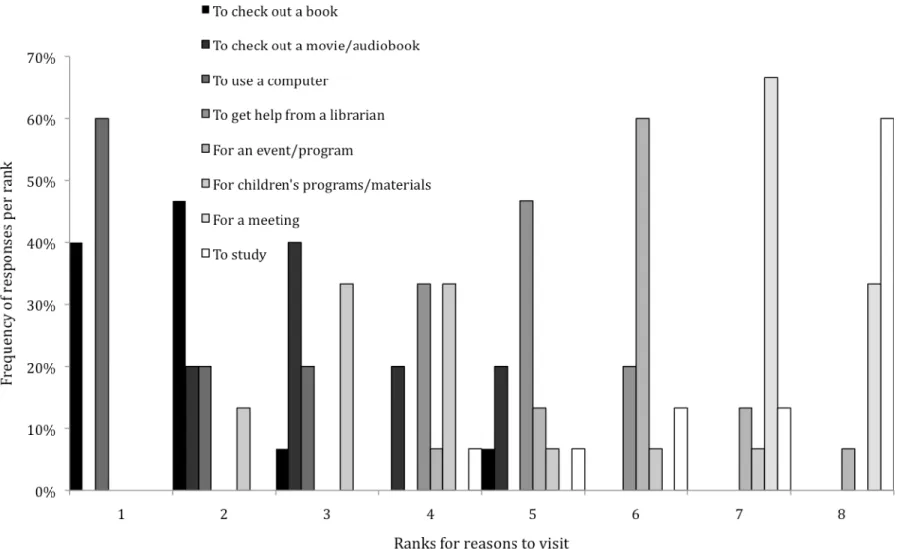
Figure 2. Librarians’ assigned ranks for their perception of users’ reasons to visit the library in order from most frequent reason to
18
The following five text responses were given by librarians as additional reasons users visit the library:
• To look for a job, to get a tax form, to get a voter registration form, to stay warm, to use the bathroom
• People regularly use the library for shelter • To socialize and pass time
• Socialize
• To do research and complete projects
To determine the alignment between the users’ and librarians’ perceptions of users’ reasons to visit the library, the mean scores for each of the reasons were converted back into ranks. The reasons with the lowest mean and highest mean were assigned the ranks of 1 and 8, respectively (see Table 2). A negative rank difference indicates that users ranked the reason higher on their list of reasons to visit and a positive rank
difference indicates that librarians ranked the reason higher. “For a meeting” was ranked as number 8 by users and librarians, indicating that both groups think it is the least common reason to visit the library. Five of the reasons had a small rank difference of -1. “To use a computer” had a rank difference of 2 and “For children’s programs or
materials” had a rank difference of 3, which suggest that the librarians over-estimated those as users’ reasons to visit the library.
Frequency of use of services
Users compared to librarians. The frequency of users’ responses for many
Table 2
Comparisons of Users’ and Librarians’ Perceptions of Users’ Reasons to Visit the Library
Users (n = 46) Librarians (n = 15) Comparisons
Reasons M SD Rank M SD Rank t df p Rank Difference
To check out a book 1.83 1.14 1 1.87 1.06 2 -1.05 36.78 0.30 -1
To check out a movie/audiobook 3.02 1.61 2 3.40 1.06 3 4.90** 58.90 0.00 -1
To use a computer 3.67 2.48 3 1.60 0.83 1 -0.95 42.93 0.35 2
To get help 4.61 1.31 4 4.87 0.74 5 -3.11** 33.94 0.00 -1
For an event/program 5.04 1.32 5 6.00 0.93 6 4.60** 36.36 0.00 -1
To study/work 5.65 2.35 6 7.13 1.30 7 -0.20 25.80 0.85 -1
For children’s programs/materials 5.96 2.08 7 3.80 1.37 4 -4.19** 58.94 0.00 3
For a meeting 6.22 1.59 8 7.33 0.49 8 -3.07** 44.06 0.00 0
**p < .01.
Librarian and User Perspectives 20
for “daily.” In order to better distinguish how often each of the services tend to be used, the response categories were collapsed into “at least monthly,” “at least yearly,” and “not even yearly/never” (see Table 3).
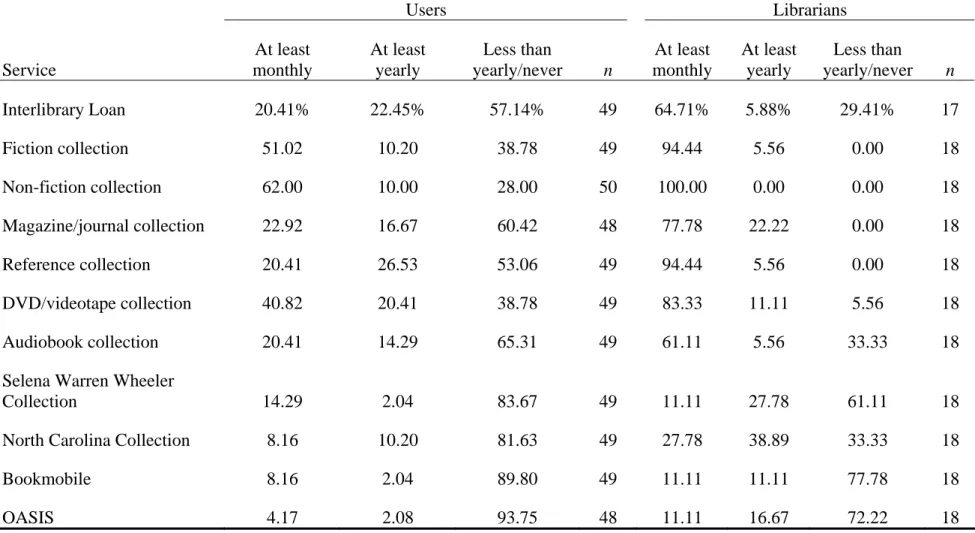
Over half of the users responded that they had either never used or use on a less than yearly basis 16 of the 23 services listed. Even more striking was that over three-quarters of the users had never used or use less than yearly 11 of those 16 services. However, more than half of the users also responded that they use six services at least monthly.
Over 60% of the librarians responded that they use 13 of the 23 services at least monthly. All of the librarians use the library website and collection of non-fiction books at least monthly. All but one librarian use the online catalog, collection of fiction books, reference books, and online events calendar at least monthly. However, over half of the librarians responded that they had either never used or use on a less than yearly basis six services.
An independent samples t-test comparing the means (M) of each service for both groups revealed that librarians use every service significantly more than users (p < .05), except for downloadable e-books, online access to My Account, Ask-A-Librarian chat reference, the Selena Warren Wheeler Collection, and the bookmobile (see Table 4). As seen in Table 3, over a third of the users and half of the librarians had never used
Table 3
Users’ and Librarians’ Responses to Their Frequency of Use of Library Services
Users Librarians
Service At least monthly At least yearly Less than
yearly/never n
At least monthly
At least yearly
Less than
yearly/never n
Library website 64.71% 17.65% 17.65% 51 100.00% 0.00% 0.00% 18
Online catalog 58.82 11.76 29.41 51 94.44 5.56 0.00 18
E-audiobooks 4.08 12.24 83.67 49 22.22 27.78 50.00 18
E-books 4.08 10.20 85.71 49 22.22 16.67 61.11 18
E-magazines/journals 12.50 10.42 77.08 48 61.11 22.22 16.67 18
Online access to My Account 67.35 8.16 24.49 49 72.22 0.00 27.78 18
Facebook Page 6.12 4.08 89.80 49 41.18 11.76 47.06 17
Library blogs 6.12 2.04 91.84 49 61.11 27.78 11.11 18
Library computer stations 54.00 10.00 36.00 50 83.33 0.00 16.67 18
Ask-A-Librarian 8.00 10.00 82.00 50 27.78 5.56 66.67 18
Online events calendar 27.45 19.61 52.94 51 94.44 0.00 5.56 18
NoveList 12.77 8.51 78.72 47 77.78 16.67 5.56 18
Table 3 (continued)
Users Librarians
Service At least monthly At least yearly Less than
yearly/never n
At least monthly
At least yearly
Less than
yearly/never n
Interlibrary Loan 20.41% 22.45% 57.14% 49 64.71% 5.88% 29.41% 17
Fiction collection 51.02 10.20 38.78 49 94.44 5.56 0.00 18
Non-fiction collection 62.00 10.00 28.00 50 100.00 0.00 0.00 18
Magazine/journal collection 22.92 16.67 60.42 48 77.78 22.22 0.00 18
Reference collection 20.41 26.53 53.06 49 94.44 5.56 0.00 18
DVD/videotape collection 40.82 20.41 38.78 49 83.33 11.11 5.56 18
Audiobook collection 20.41 14.29 65.31 49 61.11 5.56 33.33 18
Selena Warren Wheeler
Collection 14.29 2.04 83.67 49 11.11 27.78 61.11 18
North Carolina Collection 8.16 10.20 81.63 49 27.78 38.89 33.33 18
Bookmobile 8.16 2.04 89.80 49 11.11 11.11 77.78 18
OASIS 4.17 2.08 93.75 48 11.11 16.67 72.22 18
23
Table 4
Comparison of Users’ and Librarians’ Frequency of Use of Library Services
Users Librarians
Independent Samples T-test
Service M SD M SD t df p
Library website 4.86 2.04 6.89 0.32 -6.85** 56.53 .000 Online catalog 4.24 2.28 6.72 0.75 -6.82** 66.89 .000
E-audiobooks 1.57 1.19 2.72 1.87 -2.43* 22.25 .023
E-books 1.53 1.24 2.44 1.79 -2.00 23.30 .058
E-magazines/journals 1.90 1.63 4.89 1.94 -5.83** 26.52 .000 Online access to My Account 4.69 2.22 4.83 2.31 -0.22 29.32 .826 Facebook Page 1.51 1.34 3.29 2.20 -3.15** 20.27 .005 Library blogs 1.45 1.21 4.61 1.69 -7.30** 23.73 .000 Library computer stations 4.12 2.49 5.78 2.26 -2.59* 32.84 .014 Ask-A-Librarian 1.72 1.43 2.67 2.30 -1.64 21.90 .116 Online events calendar 2.78 2.01 6.28 1.45 -7.89** 41.55 .000
NoveList 1.83 1.70 5.39 1.50 -8.24** 34.68 .000
Interlibrary Loan 2.57 1.74 4.41 2.12 -3.22** 23.93 .004 Fiction collection 3.76 2.34 6.67 0.77 -7.66** 64.58 .000 Non-fiction collection 4.26 2.16 6.78 0.43 -7.84** 58.30 .000 Magazine/journal collection 2.65 2.05 5.72 1.13 -7.74** 54.75 .000 Reference collection 2.73 1.88 5.94 0.94 -9.23** 58.83 .000 DVD/videotape collection 3.57 2.25 5.44 1.65 -3.71** 41.16 .001 Audiobook collection 2.37 1.94 4.39 2.25 -3.37** 26.86 .002 Selena Warren Wheeler
Collection 1.65 1.54 2.39 1.79 -1.55 26.77 .133
North Carolina Collection 1.67 1.33 3.28 1.87 -3.34** 23.59 .003
Bookmobile 1.53 1.46 2.11 1.68 -1.30 27.04 .205
OASIS 1.29 1.15 2.11 1.53 -2.07* 24.54 .050
24
Users’ responses compared to librarians’ perceptions. An independent samples
t-test revealed that librarians significantly over-estimated users’ frequency of use for all services listed (p < .05), except for online access to My Account (see Table 5). Table 6 shows the librarians’ responses to how frequently they believe users tend to use the library services. Over half of the librarians predicted that users utilize 12 services on at least a monthly basis. Of those 12 services, 100% of the librarians responded that they thought users use the library website, online catalog, library computer stations, and collections of fiction, non-fiction, and DVDs/videotapes on at least a monthly basis. Over half of the librarians also predicted that users use six services on at least a yearly basis. As seen in Table 3, a majority of users responded that they either never used or use less than once per year the electronic magazines/journals and the collection of audiobooks, however no librarians thought that was the case.
Librarians compared to their perception of users. There were significant
moderate to marked positive correlations between librarians’ ratings of their own frequency of use compared to librarians’ ratings of their perceptions of users’ frequency of use of five services. A paired samples t-test demonstrated that librarians rated their own use of six of the services as significantly more frequent (t > 0, p < .05) than their estimation of the users’ use (see Table 7). However, the librarians also rated their
25
Table 5
Comparison of Users’ Responses and Librarians’ Perceptions of Users’ Frequency of Use of Library Services
Users Librarians’
Perception
Independent Samples T-test
Service M SD M SD t df p
Library website 4.86 2.04 6.00 0.66 -3.43** 63.39 .001 Online catalog 4.24 2.28 5.93 0.59 -4.80** 63.64 .000 E-audiobooks 1.57 1.19 4.29 1.59 -5.93** 17.38 .000
E-books 1.53 1.24 3.50 1.74 -3.95** 16.96 .001
E-magazines/journals 1.90 1.63 4.21 0.98 -6.61** 36.12 .000 Online access to My Account 4.69 2.22 5.33 1.45 -1.31 35.97 .200 Facebook Page 1.51 1.34 3.38 1.76 -3.58** 15.89 .003 Library blogs 1.45 1.21 3.85 1.35 -5.83** 17.50 .000 Library computer stations 4.12 2.49 6.33 0.72 -5.56** 63.00 .000 Ask-A-Librarian 1.72 1.43 3.92 1.38 -5.08** 19.24 .000 Online events calendar 2.78 2.01 5.47 1.06 -6.83** 45.21 .000
NoveList 1.83 1.70 4.29 1.54 -5.11** 23.25 .000
Interlibrary Loan 2.57 1.74 3.73 1.62 -2.38* 24.73 .025 Fiction collection 3.76 2.34 6.07 0.62 -6.22** 60.88 .000 Non-fiction collection 4.26 2.16 5.86 0.66 -2.72** 62.00 .008 Magazine/journal collection 2.65 2.05 4.79 1.37 -4.55** 31.76 .000 Reference collection 2.73 1.88 4.15 1.14 -3.42** 31.34 .002 DVD/videotape collection 3.57 2.25 6.07 0.59 -7.02** 61.44 .000 Audiobook collection 2.37 1.94 5.40 0.83 -8.65** 55.23 .000 Selena Warren Wheeler
Collection 1.65 1.54 3.31 1.55 -3.43** 18.76 .003
North Carolina Collection 1.67 1.33 4.00 1.41 -5.50** 20.04 .000
Bookmobile 1.53 1.46 4.71 1.33 -7.74** 22.81 .000
OASIS 1.29 1.15 4.31 1.32 -7.53** 17.27 .000
26
Table 6
Librarians’ Perceptions of Users’ Frequency of Use of Library Services
Service At least monthly At least yearly Less than
yearly/never n
Library website 100.00% 0.00% 0.00% 15
Online catalog 100.00 0.00 0.00 15
E-audiobooks 50.00 28.57 21.43 14
E-books 28.57 35.71 35.71 14
E-magazines/journals 28.57 71.43 0.00 14
Online access to My Account 86.67 6.67 6.67 15
Facebook Page 23.08 38.46 38.46 13
Library blogs 23.08 61.54 15.38 13
Library computer stations 100.00 0.00 0.00 15
Ask-A-Librarian 30.77 53.85 15.38 13
Online events calendar 80.00 20.00 0.00 15
NoveList 42.86 50.00 7.14 14
Interlibrary Loan 20.00 53.33 26.67 15
Fiction collection 100.00 0.00 0.00 14
Non-fiction collection 100.00 0.00 0.00 14
Magazine/journal collection 71.43 14.29 14.29 14
Reference collection 38.46 46.15 15.38 13
DVD/videotape collection 100.00 0.00 0.00 15
Audiobook collection 86.67 13.33 0.00 15
Selena Warren Wheeler
Collection 23.08 38.46 38.46 13
North Carolina Collection 35.71 57.14 7.14 14
Bookmobile 71.43 21.43 7.14 14
Table 7
Comparisons of Librarians’ Responses and Perceptions of Users’ Frequency of Use of Library Services
Response Perception Paired Samples T-test
Paired Samples Correlations
Service M SD M SD t df p r p
Library website 6.87 0.35 6.00 0.66 5.25** 14 .000 .310 .261
Online catalog 6.73 0.80 5.93 0.59 3.29** 14 .005 .110 .695
E-audiobooks 2.93 2.02 4.29 1.59 -3.18** 13 .007 .630* .016
E-books 2.64 1.95 3.50 1.74 -1.99 13 .068 .624* .017
E-magazines/journals 4.86 2.14 4.21 0.98 1.24 13 .238 .421 .134
Online access to My Account 4.47 2.36 5.33 1.45 -1.75 14 .103 .579* .024
Facebook Page 3.69 2.29 3.38 1.76 0.56 12 .584 .550 .051
Library blogs 4.85 1.52 3.85 1.35 2.14 12 .053 .314 .296
Library computer stations 5.53 2.42 6.33 0.72 -1.15 14 .271 -.272 .326
Ask-A-Librarian 2.92 2.50 3.92 1.38 -1.40 12 .188 .215 .480
Online events calendar 6.20 1.57 5.47 1.06 1.91 14 .077 .413 .126
Table 7 (continued)
Response Perception Paired Samples T-test
Paired Samples Correlations
Service M SD M SD t df p r p
Interlibrary Loan 4.47 2.13 3.73 1.62 1.55 14 .143 .554* .032
Fiction collection 6.71 0.83 6.07 0.62 2.39* 13 .033 .043 .883
Non-fiction collection 6.79 0.43 5.86 0.66 4.19** 13 .001 -.117 .691
Magazine/journal collection 5.64 1.08 4.79 1.37 1.94 13 .075 .100 .733
Reference collection 5.92 0.95 4.15 1.14 4.48** 12 .001 .088 .775
DVD/videotape collection 5.60 1.68 6.07 0.59 -1.05 14 .313 .100 .722
Audiobook collection 4.67 2.16 5.40 0.83 -1.30 14 .215 .160 .570
Selena Warren Wheeler
Collection 2.38 1.81 3.31 1.55 -2.14 12 .053 .580* .038
North Carolina Collection 3.14 1.92 4.00 1.41 -1.24 13 .239 -.199 .496
Bookmobile 2.07 1.69 4.71 1.33 -4.17** 13 .001 -.231 .427
OASIS 2.00 1.41 4.31 1.32 -4.51** 12 .001 .090 .771
*p < .05. **p < .01.
29
Importance of services
Users compared to librarians. The respondents’ beliefs about importance of
services were measured on a 7-point scale, ranging from “not at all important” (1) to “extremely important” (7). The midpoint of the scale, 4, is neutral. If a service received a mean score of greater than 4, it was considered to be important and a mean score of less than 4, not important (see Table 8).
Users rated 21 of the 23 services as important. The only services users rated as not important (M < 4.00) were the Facebook Page (M = 3.88, SD = 1.76) and the library blogs (M = 3.67, SD = 1.80). The highest mean importance rating was for the library website (M = 6.04, SD = 1.36), which was the only service with a mean score of over 6. A close second place was the online catalog (M = 5.94, SD = 1.55).
Librarians rated all the listed services as important (M > 4.00). The lowest mean importance rating was for the Facebook Page (M = 4.06, SD = .97), which is only slightly above the midpoint of the 7-point scale. Both the fiction and non-fiction collections had the highest importance ratings (M = 6.94, SD = .24). A close third place was the online catalog (M = 6.88, SD = .33).
Table 8
Responses to Importance of Library Services
Users Librarians
Librarians’ Perceptions of Importance to Users
Service n M SD n M SD n M SD
Library website 50 6.04 1.36 17 6.59 1.23 15 5.93 1.39
Online catalog 48 5.94 1.55 17 6.88 0.33 15 6.13 1.77
E-audiobooks 49 4.51 1.61 17 5.00 1.06 15 4.93 1.28
E-books 49 4.49 1.69 17 4.59 1.00 14 4.71 1.07
E-magazines/journals 48 4.58 1.64 17 5.76 1.30 15 4.67 1.29
Online access to My Account 49 5.76 1.69 17 6.24 1.20 14 6.00 1.30
Facebook Page 49 3.88 1.76 17 4.06 0.97 15 3.47 1.19
Library blogs 49 3.67 1.80 17 4.59 0.80 15 3.60 1.12
Library computer stations 50 5.56 1.92 17 6.65 1.46 15 6.40 1.35
Ask-A-Librarian 50 4.78 1.81 17 5.12 1.17 15 4.40 1.40
Online events calendar 50 5.16 1.74 17 6.35 0.70 15 5.47 1.41
Table 8 (continued)
Users Librarians
Librarians’ Perceptions of Importance to Users
Service n M SD n M SD n M SD
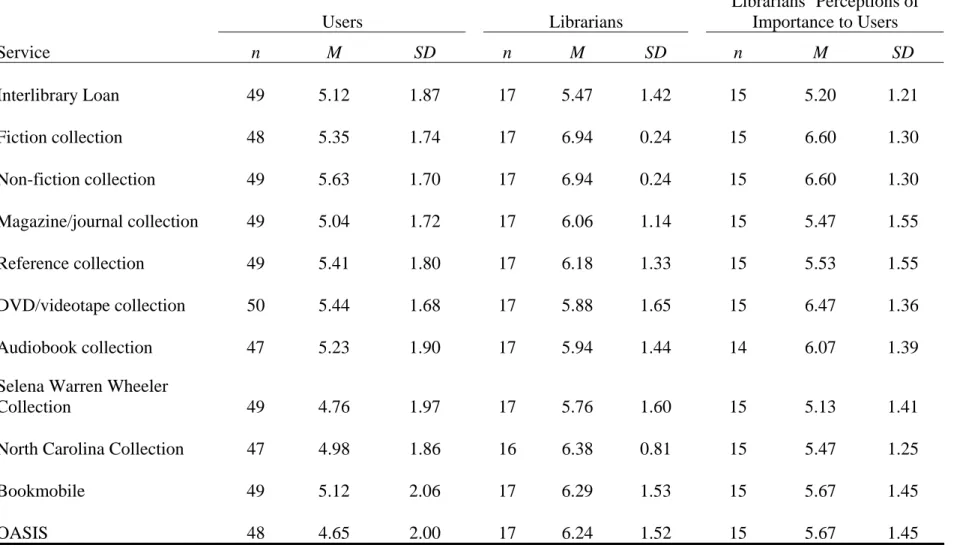
Interlibrary Loan 49 5.12 1.87 17 5.47 1.42 15 5.20 1.21
Fiction collection 48 5.35 1.74 17 6.94 0.24 15 6.60 1.30
Non-fiction collection 49 5.63 1.70 17 6.94 0.24 15 6.60 1.30
Magazine/journal collection 49 5.04 1.72 17 6.06 1.14 15 5.47 1.55
Reference collection 49 5.41 1.80 17 6.18 1.33 15 5.53 1.55
DVD/videotape collection 50 5.44 1.68 17 5.88 1.65 15 6.47 1.36
Audiobook collection 47 5.23 1.90 17 5.94 1.44 14 6.07 1.39
Selena Warren Wheeler
Collection 49 4.76 1.97 17 5.76 1.60 15 5.13 1.41
North Carolina Collection 47 4.98 1.86 16 6.38 0.81 15 5.47 1.25
Bookmobile 49 5.12 2.06 17 6.29 1.53 15 5.67 1.45
OASIS 48 4.65 2.00 17 6.24 1.52 15 5.67 1.45
32
Table 9
Comparisons of Users’ and Librarians’ Beliefs about Importance of Library Services
Rank Independent Samples
T-test
Service Users Librarians Difference t df p
Library website 1 5 -4 -1.55 30.29 .132
Online catalog 2 3 -1 -3.98** 57.16 .000
Online access to My Account 3 9.5 -6.5 -1.27 39.36 .212 Non-fiction collection 4 1.5 2.5 -5.23** 53.22 .000
Library computer stations 5 4 1 -2.44* 36.35 .020
DVD/videotape collection 6 14 -8 -0.95 28.07 .351
Reference collection 7 11 -4 -1.86 37.64 .071
Fiction collection 8 1.5 6.5 -6.14** 51.82 .000
Audiobook collection 9 13 -4 -1.59 37.53 .120
Online events calendar 10 7 3 -3.98** 62.99 .000
Interlibrary Loan 11.5 8 3.5 -0.80 36.57 .429
Bookmobile 11.5 18 -6.5 -2.47* 37.43 .018
Magazine/journal collection 13 12 1 -2.75** 42.26 .009
North Carolina Collection 14 6 8 -4.13 57.27 .000
Ask-A-Librarian 15 19 -4 -0.89 43.43 .381
Selena Warren Wheeler
Collection 16 16.5 -0.5 -2.10* 34.14 .043
OASIS 17 9.5 7.5 -3.40** 36.76 .002
E-magazines/journals 18 16.5 1.5 -3.00** 35.18 .005
E-audiobooks 19 20 -1 -1.42 42.68 .163
E-books 20 21.5 -1.5 -0.29 47.46 .775
NoveList 21 15 6 -4.25** 42.71 .000
Facebook Page 22 23 -1 -0.53 51.44 .601
Library blogs 23 21.5 1.5 -2.85** 60.05 .006
33
13 and no service would have a rank of 12 or 14. A negative rank indicates the users ranked the service relatively higher in importance and a positive rank indicates the librarians ranked the service relatively higher. Items with large or significant differences in means did not necessarily have large differences in ranks. Similarly, items with large differences in ranks did not necessarily have large or significant differences in means.
There was a difference of greater than five ranks for 7 of the 23 services. Of those, only the fiction collection, bookmobile, OASIS, and NoveList had significant differences in means between the two groups. Librarians rated 12 of the services as significantly more important than the users. Users rated no services significantly higher in importance and no significant difference was observed for 11 of the 23 services.
Users’ responses compared to librarians’ perceptions. An independent samples
t-test revealed no significant differences (p > .05) between the users’ importance ratings and the librarians’ perception of importance to the users for 19 of the 23 services (see Table 10). However, librarians’ perceptions of importance of services to the users differed significantly (p < .05) from users’ reported importance for the non-fiction collection, DVD/videotape collection, fiction collection, and OASIS. As seen in Table 9, users did rate all of these as important services.
34
Table 10
Comparisons of Users’ Responses and Librarians’ Perceptions of Importance of Library Services to Users
Rank Independent Samples
T-test Service Users
Librarians’
Perceptions Difference t df p
Library website 1 8 -7 0.26 22.63 .795
Online catalog 2 5 -3 -0.39 21.17 .704
Online access to My Account 3 7 -4 -0.58 26.87 .568 Non-fiction collection 4 1.5 2.5 -2.34* 30.21 .026
Library computer stations 5 4 1 -1.90 32.61 .066
DVD/videotape collection 6 3 3 -2.43* 28.16 .022
Reference collection 7 11 -4 -0.26 26.61 .795
Fiction collection 8 1.5 6.5 -2.97** 31.28 .006
Audiobook collection 9 6 3 -1.81 29.12 .081
Online events calendar 10 13 -3 -0.70 28.13 .491
Interlibrary Loan 11.5 9.5 2 -0.19 36.32 .851
Bookmobile 11.5 15 -3.5 -1.15 33.00 .261
Magazine/journal collection 13 13 0 -0.91 25.45 .373 North Carolina Collection 14 13 1 -1.16 35.51 .254
Ask-A-Librarian 15 21 -6 0.86 29.36 .399
Selena Warren Wheeler
Collection 16 16 0 -0.82 32.50 .417
OASIS 17 9.5 7.5 -2.16* 32.17 .038
E-magazines/journals 18 20 -2 -0.20 29.36 .840
E-audiobooks 19 17 2 -1.05 28.85 .302
E-books 20 19 1 -0.60 33.44 .552
NoveList 21 18 3 -1.48 33.01 .148
Facebook Page 22 23 -1 1.04 34.68 .308
Library blogs 23 22 1 0.19 37.82 .850
35
the differences in means were not significant. Means and standard deviations for the librarians’ perceptions of importance of services to users may be found in Table 8.
Librarians compared to their perceptions of users. There were significant
moderate to marked positive correlations between librarians’ responses and their predictions of users’ responses for eight of the services. Librarians rated six services significantly (p < .05) higher in importance for themselves than for users. For each of those services, the mean importance scores for librarians were significantly higher than the mean importance scores for the users, except in one case. The librarians expected the Facebook Page to be significantly more important to themselves than to the users, when actually the Facebook Page was one of the least important services for both groups (see Table 11). The services with correlations were not necessarily the same as the services with ratings that significantly differed.
Satisfaction with services
Users compared to librarians. The respondents’ satisfactions with services were
measured on a 7-point scale, ranging from “very dissatisfied” (1) to “very satisfied” (7). At the middle of the scale, 4 is neutral. If a service received a mean score of less than 4, it was considered that the group of respondents was dissatisfied. Likewise, if a service received a mean score of greater than 4, it was considered that the group of respondents was satisfied (see Table 12).
Table 11
Comparisons of Librarians’ Responses and Perceptions of Importance of Library Services to Users
Rank Paired Samples T-Test
Paired Samples Correlations
Service Response Perception Difference t df p r p
Fiction collection 1.5 1.5 0 0.96 14 .353 -.085 .763
Non-fiction collection 1.5 1.5 0 0.96 14 .353 -.085 .763
Online catalog 3 5 -2 1.70 14 .111 .375 .168
Library computer stations 4 4 0 0.45 14 .663 .286 .301
Library website 5 8 -3 2.07 14 .057 .654** .008
Online events calendar 6 13 -7 2.23* 14 .043 .117 .678
North Carolina Collection 7 13 -6 3.79** 13 .002 .657* .011
Bookmobile 8 9.5 -1.5 1.33 14 .205 .490 .064
Online access to My Account 9.5 7 2.5 0.49 13 .635 .641* .014
OASIS 9.5 9.5 0 1.13 14 .277 .453 .090
Reference collection 11 11 0 1.47 14 .164 .546* .035
Magazine/journal collection 12 13 -1 1.32 14 .209 .179 .522
Table 11 (continued)
Rank Paired Samples T-Test
Paired Samples Correlations
Service Response Perception Difference t df p r p
Audiobook collection 13 6 7 -0.25 13 .810 -.067 .819
DVD/videotape collection 14 3 11 -1.18 14 .259 .012 .966
NoveList 15 18 -3 3.24** 14 .006 .554* .032
Selena Warren Wheeler
Collection 16.5 16 0.5 1.07 14 .301 .396 .144
E-magazines/journals 16.5 20 -3.5 2.48* 14 .026 .121 .668
Interlibrary Loan 18 15 3 0.77 14 .452 .535* .040
Ask-A-Librarian 19 21 -2 2.00 14 .065 .524* .045
E-audiobooks 20 17 3 0.17 14 .865 .246 .377
E-books 21.5 19 2.5 -0.64 13 .533 .329 .250
Library blogs 21.5 22 -0.5 4.18** 14 .001 .585* .022
Facebook Page 23 23 0 2.47* 14 .027 .510 .052
Note. Paired samples tests compare means from Table 8. *p < .05. **p < .01.
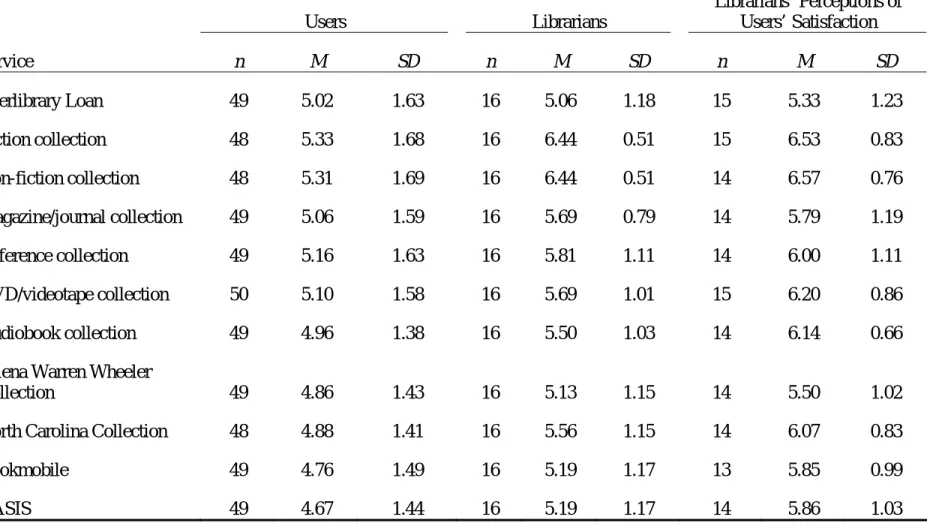
Table 12
Responses to Satisfaction with Library Services
Users Librarians
Librarians’ Perceptions of Users’ Satisfaction
Service n M SD n M SD n M SD
Library website 50 5.6 1.702 16 6.00 0.97 15 6.13 1.06
Online catalog 49 5.63 1.56 16 5.75 1.00 15 5.80 1.32
E-audiobooks 49 4.69 1.50 16 4.69 1.08 14 5.36 1.15
E-books 49 4.67 1.49 16 4.38 1.15 14 4.93 1.27
E-magazines/journals 48 4.81 1.54 16 5.50 1.10 14 5.57 0.94
Online access to My Account 50 5.64 1.47 16 5.81 1.17 15 5.67 1.23
Facebook Page 48 4.56 1.49 16 5.06 1.18 14 4.93 1.14
Library blogs 49 4.59 1.49 16 5.00 1.37 14 5.00 1.30
Library computer stations 50 5.30 1.62 16 5.13 1.20 15 5.07 2.02
Ask-A-Librarian 50 4.88 1.56 16 4.88 1.31 14 5.07 0.92
Online events calendar 50 5.12 1.52 16 5.56 1.15 15 5.53 1.30
Table 12 (continued)
Users Librarians
Librarians’ Perceptions of Users’ Satisfaction
Service n M SD n M SD n M SD
Interlibrary Loan 49 5.02 1.63 16 5.06 1.18 15 5.33 1.23
Fiction collection 48 5.33 1.68 16 6.44 0.51 15 6.53 0.83
Non-fiction collection 48 5.31 1.69 16 6.44 0.51 14 6.57 0.76
Magazine/journal collection 49 5.06 1.59 16 5.69 0.79 14 5.79 1.19
Reference collection 49 5.16 1.63 16 5.81 1.11 14 6.00 1.11
DVD/videotape collection 50 5.10 1.58 16 5.69 1.01 15 6.20 0.86
Audiobook collection 49 4.96 1.38 16 5.50 1.03 14 6.14 0.66
Selena Warren Wheeler
Collection 49 4.86 1.43 16 5.13 1.15 14 5.50 1.02
North Carolina Collection 48 4.88 1.41 16 5.56 1.15 14 6.07 0.83
Bookmobile 49 4.76 1.49 16 5.19 1.17 13 5.85 0.99
OASIS 49 4.67 1.44 16 5.19 1.17 14 5.86 1.03
40
Librarians were also not dissatisfied with any of the services. The only services with mean satisfaction ratings that were under 5 were books (M = 4.38, SD = 1.15), e-audiobooks (M = 4.69, SD = 1.08), and Ask-A-Librarian (M = 4.88, SD = 1.31).
Librarians were most satisfied with the non-fiction and fiction collections (M = 6.44, SD = .51).
The groups’ mean satisfaction ratings were also converted into ranks. The service with the highest mean was given the rank of 1, while the service with the lowest mean was given the rank of 23 (see Table 13). There was a difference of five or more ranks for six of the services. Of those, only NoveList had a significant difference in means between the two groups. The largest rank difference was for computer stations (-10.5), suggests that users are relatively more satisfied with the library computer stations than the librarians, even though their mean satisfaction ratings are very similar.
An independent samples t-test revealed that librarians were significantly more satisfied with the fiction, non-fiction, and magazine/journal collections, and NoveList. No services were given significantly higher satisfaction ratings by users. There was no
significant difference between users’ and librarians’ satisfactions of 19 services.
Users’ responses compared to librarians’ perceptions. An independent samples
41
Table 13
Comparisons of Users’ and Librarians’ Satisfaction with Library Services
Rank Independent Samples
T-test
Service Users Librarians Difference t df p
Online access to My Account 1 5 -4 -0.48 31.54 .633
Online catalog 2 7 -5 -0.35 40.46 .728
Library website 3 3 0 -1.17 45.78 .247
Fiction collection 4 1.5 2.5 -4.03** 61.81 .000
Non-fiction collection 5 1.5 3.5 -4.08** 61.77 .000 Library computer stations 6 16.5 -10.5 0.46 33.91 .647
Reference collection 7 6 1 -1.80 37.63 .081
Online events calendar 8 10.5 -2.5 -1.23 33.20 .227 DVD/videotape collection 9 8.5 0.5 -1.74 39.99 .090 Magazine/journal collection 10 8.5 1.5 -2.08* 52.04 .043
NoveList 11 4 7 -2.49* 37.54 .017
Interlibrary Loan 12 18.5 -6.5 -0.11 35.11 .911
Audiobook collection 13 12.5 0.5 -1.66 34.08 .105
Ask-A-Librarian 14.5 10.5 4 0.01 29.82 .990
North Carolina Collection 14.5 21 -6.5 -1.95 31.18 .060 Selena Warren Wheeler
Collection 16 16.5 -0.5 -.76 31.51 .452
E-magazines/journals 17 12.5 4.5 -1.95 36.23 .059
Bookmobile 18 14.5 3.5 -1.20 32.43 .240
E-audiobooks 19 22 -3 0.02 35.59 .985
E-books 20.5 14.5 6 0.84 32.98 .410
OASIS 20.5 23 -2.5 -1.44 31.08 .159
Library blogs 22 20 2 -1.02 27.52 .319
Facebook Page 23 18.5 4.5 -1.37 32.14 .180
42
Table 14
Comparisons of Users’ Responses and Librarians’ Perceptions of Users’ Satisfaction with Library Services Rank Independent Samples T-test Service Users Librarians’
Perceptions Difference t df p
Online access to My Account 1 12 -11 -0.07 27.00 .945
Online catalog 2 10 -8 -0.41 27.15 .685
Library website 3 5 -2 -1.46 37.61 .152
Fiction collection 4 2 2 -3.70** 48.71 .001
Non-fiction collection 5 1 4 -3.97** 49.47 .000
Library computer stations 6 19.5 -13.5 0.41 19.73 .686
Reference collection 7 7 0 -2.22* 30.69 .034
Online events calendar 8 14 -6 -1.04 26.53 .310
DVD/videotape collection 9 3 6 -3.49** 43.79 .001
Magazine/journal collection 10 11 -1 -1.86 27.67 .074
NoveList 11 18 -7 -0.49 29.80 .629
Interlibrary Loan 12 17 -5 -0.79 30.34 .434
Audiobook collection 13 4 9 -4.46** 46.14 .000
Ask-A-Librarian 14.5 6 8.5 -0.58 36.30 .565
North Carolina Collection 14.5 19.5 -5 -3.98** 36.89 .000 Selena Warren Wheeler
Collection 16 15 1 -1.89 29.21 .069
E-magazines/journals 17 13 4 -2.27* 35.41 .030
Bookmobile 18 9 9 -3.14** 28.38 .004
E-audiobooks 19 16 3 -1.77 27.02 .088
E-books 20.5 8 12.5 -0.64 24.27 .530
OASIS 20.5 22.5 -2 -3.46** 29.08 .002
Library blogs 22 21 1 -1.00 23.60 .326
Facebook Page 23 22.5 0.5 -0.98 27.20 .335
43
Three services had a difference of greater than 10 ranks. My Account had the highest ranked satisfaction for users (1) and was ranked 12th by the librarians’ perception of users. The computer stations had a rank of 6 for users and the librarians expected a rank of 19.5. The librarians expected a rank of 8 for users’ satisfaction of e-books, but it was actually ranked as a 20.5. None of those three services with large rank difference had significant difference in means. However, the large differences in ranks indicate a large difference in relative satisfaction levels between users and the librarians’ perception of users.
Librarians compared to their perceptions of users. There were significant
moderate to high positive correlations between librarians’ satisfactions and their
perceptions of users’ satisfactions of 10 of the services (see Table 15). A paired samples t-test indicated that librarians rated their perception of users’ satisfaction of downloadable audiobooks and the collection of audiobooks as significantly higher than their own
satisfaction level. As seen in Table 13, there were actually no significant differences in satisfaction ratings between the users and librarians for the downloadable audiobooks or the collection of audiobooks. The librarians accurately estimated that they were
Table 15
Comparisons of Librarians’ Responses and Perceptions of Users’ Satisfaction with Library Services
Rank Paired Samples T-Test
Paired Samples Correlations
Service Response Perception Difference t df p r p
Non-fiction collection 1 1 0 -0.69 13 .500 .311 .279
Fiction collection 2 2 0 -0.62 14 .546 .304 .271
Library website 3.5 5 -1.5 -0.62 14 .546 .674** .006
NoveList 3.5 18 -14.5 3.29** 13 .006 .609* .021
Online access to My Account 5 12 -7 0.34 14 .737 .240 .390
Reference collection 6 7 -1 -0.82 13 .426 .618* .018
Online catalog 7 10 -3 -0.32 14 .751 .796** .000
Magazine/journal collection 8 11 -3 -0.43 13 .671 .874** .000
DVD/videotape collection 9 3 6 -1.59 14 .135 .079 .779
E-magazines/journals 10.5 13 -2.5 0.00 13 1.000 -.043 .884
North Carolina Collection 10.5 6 4.5 -1.61 13 .131 .292 .311
Online events calendar 12 14 -2 0.00 14 1.000 .773** .001
Table 15 (continued)
Rank Paired Samples T-Test
Paired Samples Correlations
Service Response Perception Difference t df p r p
Audiobook collection 13 4 9 -3.02* 13 .010 .378 .183
OASIS 14 8 6 -1.98 13 .069 .405 .151
Bookmobile 15 9 6 -2.00 12 .069 .369 .215
Library computer stations 16 19.5 -3.5 0.16 14 .876 .593* .020
Facebook Page 17.5 22.5 -5 0.41 13 .686 .395 .162
Selena Warren Wheeler
Collection 17.5 15 2.5 -1.15 13 .272 .106 .719
Library blogs 19.5 21 -1.5 0.00 13 1.000 .711** .004
Interlibrary Loan 19.5 17 2.5 -1.44 14 .173 .726** .002
Ask-A-Librarian 21 19.5 1.5 -0.64 13 .533 .444 .112
E-audiobooks 22 16 6 -2.35* 13 .035 .481 .082
E-books 23 22.5 0.5 -2.09 13 .057 .548* .043
Note. Paired samples tests compare means from Table 12. *p < .05. **p < .01.
46
Discussion
The results support the hypotheses that these users and these librarians use different services to different extents and have different beliefs about the importance of different services. The results also indicate that these users and these librarians tend to have similar levels of satisfaction with many, but not all, of the services.
Librarians were able to accurately gauge the frequency of users’ visits to the library and for the most part were accurate about the reasons users visit the library. A few librarians had relatively cynical views about why some of the library users visit the library: “to socialize and pass time” and “people regularly use the library for shelter.” However, considering the Main Library’s proximity to several downtown Durham homeless shelters and some of the other locations being located in neighborhoods with several large schools, these are most likely accurate statements.
The results indicate that librarians are unable to accurately gauge users’ frequency of use of the library services. Librarians over-estimated users’ frequency of use of every service except for online access to My Account. The users’ responses indicate that those who use that service tend to use it on a regular basis, while others do not use it at all. The librarians’ perceptions reflect that trend. However, for every other service provided by the library, the librarians were unable to estimate average use. The reason for their over-estimation may be that they see many of the services used every day. Perhaps the
47
yearly usage statistics, but conceivably the librarians’ responses would align with those statistics better.
The results also show that librarians are accurately gauging the importance of most of the library services to the users. The only significant over-estimations were of the importance of the fiction collection, non-fiction collection, DVD/videotape collection, and OASIS. The reasons for the librarians’ over-estimation of the fiction, non-fiction, and DVD/videotape collection could be related to their over-estimation of the frequency of use of the services. The fiction and non-fiction collections are very heavily used and librarians perceived the DVD/videotape collection to be as well. Ladhari and Morales (2008) discovered a trend that when service quality is high, the perceived value of that service is also high. By extension, it is possible that when use is high, the perceived value is also high, but these results are unable to indicate if that is the case. It would be an interesting extension of this research to examine correlations between frequency of use, perceived importance, and satisfaction.
48
unable to respond because they are frequent users of OASIS, the service is presumably very important.
Librarians were slightly less accurate when it came to gauging the users’
satisfaction and over-estimated users’ satisfaction with nine of the services. Once again, the librarians perceived users to be more satisfied with the fiction collection, non-fiction collection, and DVD/videotape collection than they actually were. These trends reflect Ladhari and Morales’ (2008) findings. However, they also over-estimated the users’ satisfaction with the reference collection, audiobook collection, North Carolina Collection, and e-magazines/journals. Users were not dissatisfied with any of those services, so it is not a serious misperception. Librarians also perceived users to be more satisfied with OASIS and the bookmobile than users’ responses indicated. However, the bookmobile is similar to OASIS in that it provides library services to users outside of the physical libraries, so the primary users of those services were probably not the
respondents in the study. The results do not accurately reflect the relation between the users of those services and the librarians.
49
Librarians rated their perceptions of users’ beliefs of importance of most services similarly to their own. They did perceive the online events calendar, North Carolina Collection, NoveList, e-magazines/journals, library blogs, and the Facebook Page to be more important to themselves than the users. These are all services that librarians use on a regular basis in order to provide services to users. Most users had either never used or used less than yearly all of those services. It is likely that the librarians recognize that they are using these tools to help users and that the services are therefore more important to them than to the users who are indirectly using the services.
The results indicate that librarians perceived the users’ satisfaction with most of the services to be the same as their own. They estimated that users were significantly more satisfied with e-audiobooks and the audiobook collection and that librarians were more satisfied with NoveList. The librarians significantly over-estimated the users’ use of e-audiobooks and the audiobook collection. Perhaps their perception of those as heavily-used services caheavily-used the librarians to believe users are more satisfied with the services than the librarians. NoveList is an online reader’s advisory database mostly used by librarians rather than users, so the librarians probably took that into account when they perceived their own satisfaction with the service as higher than the users’ satisfaction.
50
not use those services frequently either. It may be that because e-audiobooks, e-books, and My Account, are all services that users pursue on their own without librarian
assistance that librarians have no interactions with users about those services on which to establish a baseline for their estimation of use. The Selena Warren Wheeler Collection is a special collection housed in the Stanford L. Warren branch. It is not used frequently by many of the librarians or users, however it is used on a regular basis by a few.
When librarians gave high importance ratings to the library website, the North Carolina Collection, online access to My Account, the reference collection, NoveList, Interlibrary Loan, Ask-A-Librarian, and library blogs, they believed users would also rate those high in importance, and vice versa. The North Carolina Collection is a special collection housed in the Main Library. Like the Selena Warren Wheeler collection, it is not used frequently by many of the librarians or users. It is likely that many librarians don’t see users using the collection, so they are only able to estimate users’ beliefs about importance of the collection off their own beliefs. The same applies to My Account, NoveList, Ask-A-Librarian, and library blogs. The results do not indicate whether the users receive assistance from librarians when they use the reference collection. It is likely that some do and that others do not, but the librarians are still likely to base their
estimation of users’ beliefs off their own.
51
pursue on their own without librarian assistance, so the librarians appear not to have much interaction with users about the services.
The only services that showed no significant correlations between librarians’ own ratings and their perception of users’ ratings were e-magazines/journals, the Facebook Page, the bookmobile, OASIS, and the fiction, non-fiction, DVD/videotape, and audiobook collections. The librarians are constantly around people who use the collections of materials in the library and are able to pick up their perspectives about those collections through their interactions. This does not necessarily apply to the e-magazines/journals, the Facebook Page, or the two outreach services. The sample size of librarians was very small (N = 18) and when the results for the two perspectives were paired, the number shrank to under 15. Therefore, the observed correlations are unable to indicate any trends. In order to better understand the relationship between librarians’ own opinions and their perceptions of users, a much larger sample is needed.
In fact, the sample size of both groups was much smaller than expected. The Raosoft sample size calculator showed that for a population of 72 librarians and a
confidence level of 95%, that a sample size of 61 would produce a margin of error of 5%. A sample size of 18 gives a margin of error of 20.14%. The calculator also indicated that for a population of 146,700 residents with a library card and a confidence level of 95%, that a sample size of 300 would produce a margin of error of 5.65%. A sample size of 51 gives a margin of error of 13.72%. Because of the small sample sizes, these results cannot be generalized to other public libraries.
52
recruitment methods for users such as an advertisement on the library webpage could not be used. Because of time limitations, the researcher was also unable to speak to users in the library about the study and ask them to participate. Participation relied on library users either sitting down at a computer station or checking out materials at circulation desks. It is very likely that many users of various library services other than computers and circulating materials did not see the recruitment flier at all.
Recruiting staff to participate using e-mail was another challenge that is probably related to the low sample size. In order to distribute the recruitment e-mail to all staff, the researcher had to mail the Deputy Director of the system, who then forwarded the e-mail to the staff listserv. However, the Deputy Director was very busy and the e-e-mail was not forwarded until six days later. The data collection period for librarians was therefore a week shorter than for users. Additionally, the messages sent with the forwarded e-mails did not enthusiastically represent the study. Many staff members who received the
recruitment e-mail were likely also busy and may not have even looked at the study information.
53
Conclusion
Regardless of the inability to generalize these results to other public libraries, this research suggests a new direction for library service evaluations. In order to better determine the use, perceptions, and expectations of library services, everyone who uses those services needs to be consulted. This includes the library cardholders and the librarians who work alongside those services daily. The decision-makers perceive the library users’ perspectives to be most important because they see the library as a user-centered operation. But the librarians may use some services more often than those cardholders, and frequently as a means to serve the users. Their perspectives about services should matter when evaluations are conducted to see the bigger picture. A key recommendation is that administrators engage users and librarians in order to make informed policy decisions.
54
References
Coffman, S. (2006). Building a new foundation: Library funding. Searcher, 14(1), 26-34. De Rosa, C. & OCLC. (2005). Perceptions of libraries and information resources: A
report to the OCLC membership. Dublin, Ohio: OCLC.
Durham County Library (1997). Discover @ Durham County Library. Retrieved April 17, 2009, from Durham County Library Website: http://www.durhamcounty library.org
Edwards, S., & Browne, M. (1995). Quality in information services: Do users and librarians differ in their expectations? Library & Information Science Research, 17(2), 163-182.
Ladhari, R., & Morales, M. (2008). Perceived service quality, perceived value and recommendation: A study among Canadian public library users. Library Management, 29(4-5), 352-366.
Magzis, L. (2007). Books, books, books! Library Journal, 132(4), 50.
Raosoft (2004). Sample size calculator. Retrieved April 17, 2009, from http://www. ezsurvey.com/samplesize.html
Stephens, A. K. (2006). Twenty-first century public library adult services. Reference & User Services Quarterly, 45(3), 223-235.
55
Appendix A
List of Durham County Library services
(Compiled from the Durham County Library website, 2009) 1. Library website: http://www.durhamcountylibrary.org
2. Online catalog: Dynix’s Horizon Information Portal 3.08 3. E-audiobooks: Overdrive
4. E-books: Overdrive and NetLibrary
5. E-magazines/journals: Many various databases provided by NCLIVE 6. Online access to My Account: Dynix’s Horizon Information Portal 3.08 7. Facebook Page:
http://www.facebook.com/pages/Durham-NC/Durham-County-Library/8888690705
8. Library blogs: http://www.durhamcountylibrary.org/blogs.php
9. Library computer stations: Access to internet and basic word processing
10. Ask-A-Librarian: E-mail reference, http://www.durhamcountylibrary.org/ask.php 11. Online events calendar: http://host4.evanced.info/durhamcounty/evanced/
eventcalendar.asp?EventType=ALL&Lib=ALL
12. NoveList: Online reader’s advisory database provided by NCLIVE 13. Interlibrary Loan: Requests made at reference desks
56
17. Reference collection 18. DVD/videotape collection 19. Audiobook collection
20. Selena Warren Wheeler Collection: Special collection of books on African-American life and history housed in the Stanford L. Warren Branch
21. North Carolina Collection: Special collection of materials preserving the history of Durham
22. Bookmobile: Visits preschools, daycares, public housing neighborhoods, shopping centers, and communities not located near libraries
57
58
Appendix C
Librarian Recruitment E-mail Dear Durham County Library staff,
I am conducting a research study about library staff and user perceptions of public libraries and would like to include your opinions. The survey will take less than 20 minutes to complete. Participation is voluntary. You may decline to participate, without consequence to your employment. If you choose to participate, you may complete the survey on worktime.
As library staff members who work at public service desks, you encounter library users every day. Your opinions about these users' library activities and your library services are very important to this research. Your responses are anonymous and will be held in the strictest of confidence and will only be used for research purposes.
Please click on the link below to view more information and for a link to the survey. If you can't click on the text below, you can copy and paste it into your web browser. http://www.unc.edu/~ahutch/libsurvey/info.html
Please note: This survey will only be available online for a limited time. I truly value your participation!
Thank you,
Alisa Ryan Hutchison MSLS Candidate, 2009
59
65
74