The Utility of an Electronic Patient Portal in Improving Patient Engagement and Outcomes in Elderly Patients
By Danielle Day
A Master’s Paper submitted to the faculty of the University of North Carolina at Chapel Hill
in partial fulfillment of the requirements for the degree of Master of Public Health in
the Public Health Leadership Program
Chapel Hill Summer 2017
Advisor and First Reader
14 July 2017
Date
Second Reader
17 July 2017
ABSTRACT
Danielle Day: The Utility of an Electronic Patient Portal in Improving Patient Engagement and Outcomes in Elderly Patients
(Under the Direction of Sue Tolleson-Rinehart)
Introduction:
ED use for ambulatory sensitive conditions (ASCs) accounts for a third of annual ED visits. 1 Addressing this issue has the potential to reduce costs, improve patient outcomes and prevent ED overcrowding. Electronic patient portals (EPPs) are widely implemented and can improve access to care. Since some older patients use the Internet less regularly than others, 2 the utility of EPPs especially needs to be investigated in this population. The aim of this study was to identify whether the UNC EPP, My UNC Chart, is associated with emergency department visits for ASCs in geriatric patients.
Methods:
This was a survey study design of a cross sectional convenience sample from the waiting room of the Geriatrics Specialty Clinic at UNC performed in June 2017. The primary outcome was recent ED visit for an ASC. Secondary outcomes included ED visits and hospital admissions in the past year. The exposure variable was use of My UNC Chart, an online patient portal.
Bivariate and multivariate analyses included important covariates and the outcomes of interest.
PCP contact type via My UNC Chart was statistically significantly associated with the primary outcome (R:-0.5, CI: -0.99, -0.01). The additional covariates investigated in the bivariate analysis included whether, how often, and via what kind of device patients used My UNC Chart. I also measured opinions about My UNC Chart (helpfulness, enjoyability, assistance with managing care), patients' general health status, and change in that status over the past month and past year. I created a general technology use score, and asked participants about their most recent ED visit, primary care provider contact before ED visit, and, finally, their sex, race, age. and education level. I found no significant associations between My UNC Chart use and the secondary outcomes of frequency of ED visits and hospitalizations in the past year. The
multivariate analysis also failed to produce significant relationships. I did not find a correlation between the technology use score and use of My UNC Chart.
Conclusion:
ACKNOWLEDGEMENTS
I would like to acknowledge and thank Dr. Jan Busby-Whitehead and Dr. Lindsay Wilson for allowing me to conduct this research in the Geriatric Specialty Clinic as well as all of the
TABLE OF CONTENTS
ABSTRACT……….iii
ACKNOWLEDGEMENTS………v
LIST OF TABLES……….……….viii
LIST OF FIGURES………..ix
LIST OF ABBREVIATIONS………x
INTRODUCTION…...………1
METHODS………..………...5
RESULTS………….………8
DISCUSSION………….……….10
REFERENCES……….…51
TABLE 1……….………..35
TABLE 2………….…….……….………39
TABLE 3………...……….………..………..……….40
TABLE 4………...……….………..………41
TABLE 5………...……….………..………42
TABLE 6………...……….………..………43
TABLE 7………...……….………..………44
TABLE 9………...……….………..………47
TABLE 10………...……….……….………..………48
FIGURE 1……...……….………..………...34
FIGURE 2……...……….………..……….36
FIGURE 3……...……….………..……….37
FIGURE 4……...……….………..……….38
FIGURE 5……...……….………..……….45
APPENDIX 1: STUDY TOOLS…..……….………15
SURVEY………15
SURVEY SCRIPT……….………21
APPENDIX 2: ELECTRONIC PATIENT PORTALS AND PATIENT ENGAGEMENT: A SYSTEMATIC REVIEW………..22
INTRODUCTION………22
METHODS……….………24
RESULTS……….………26
DISCUSSION……….………30
LIST OF TABLES
Table 1 – Baseline Characteristics by My UNC Chart Use
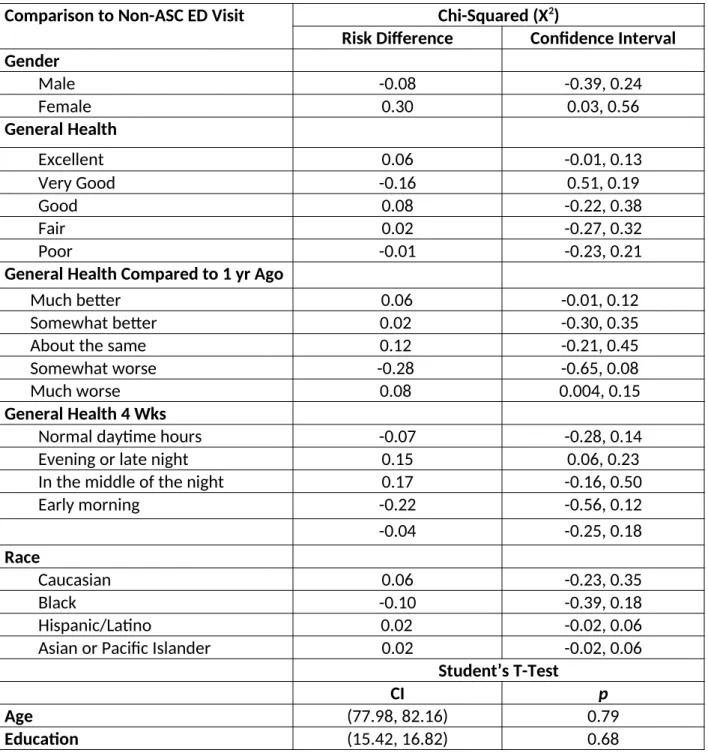
Table 2 – Bivariate Analysis for Relationship of Baseline Demographic Variables with Recent ED Use for Non-ASC
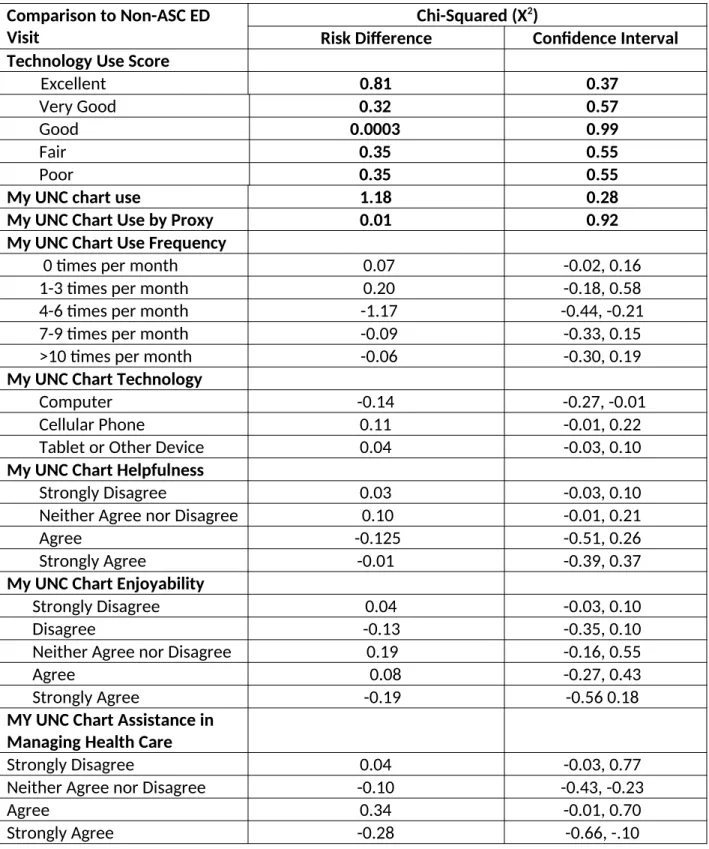
Table 3- Bivariate Analysis for Relationship of Baseline Technology and My Chart Use Variables with Recent ED Use for Non-ASC
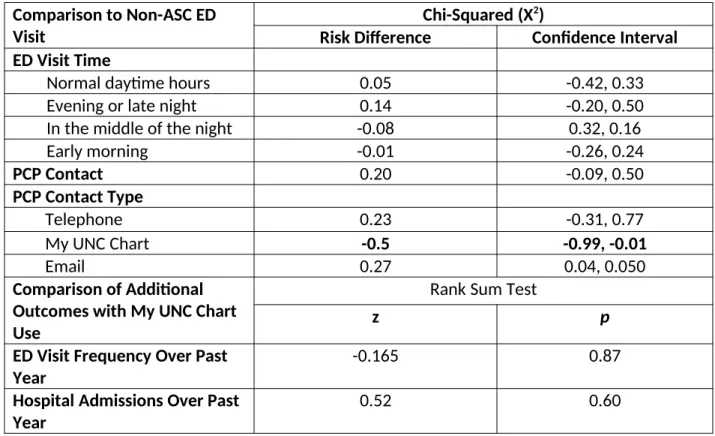
Table 4- Bivariate Analysis for Relationship of ED Visit and Hospitalization Variables with Outcomes
Table 5- Multivariable Analysis for Predictors of Recent ED use for Non-ASCs Table 6- Systematic Review Inclusion and Exclusion Criteria
Table 7- Systematic Review Detailed Search Strategy Table 8 -Systematic Review Study Characteristics Table 9 - Risk of Bias Within Each Study
LIST OF FIGURES
Figure 1 - Coding Scheme for Ambulatory Sensitive Conditions
Figure 2 – Recent ED visit for Ambulatory Sensitive Condition by My UNC Chart Use Figure 3 - ED Visits and Hospitalizations in the Past Year by My UNC Chart Use Figure 4 - General Health Rating by My UNC Chart Use
LIST OF ABBREVIATIONS
ACA- Affordable Care Act
AHRQ - Agency for Healthcare Research and Quality ASC - Ambulatory sensitive condition
CMS - Centers for Medicaid and Medicare Services ED - Emergency Department
EHR – Electronic Health Record EPP- Electronic Patient Portal PCC- Patient Centered Care PQI – Patient Quality Indicators
HIT – Health Information Technology for Economy and Clinical Health Act HITECH – Health Information Technology
INTRODUCTION:
Use of the emergency department (ED) for conditions that could be managed by a primary physician can contribute both to higher healthcare costs and ED overcrowding. 3-5 Seeking treatment for so-called “ambulatory sensitive conditions,” in the ED rather than in a primary care office or retail health centers results in higher costs for similar diagnoses and treatments. 4,5 The Agency for Healthcare Research and Quality (AHRQ) has defined ambulatory sensitive conditions (ASCs) as conditions that outpatient care or early intervention could have prevented. 7 These are measured with analysis of inpatient data for 16 defined “prevention quality indicators” (PQIs), which help to identify ASCs by measuring the efficacy of the patients outpatient care. 7 The health care transformation initiated by the Affordable Care Act (ACA) has shown promise in addressing specific access, coordination and population specific causes for inappropriate ED use.
One goal of the ACA has been the improvement and wide spread implementation of the Electronic Health Record (EHR), which was incentivized under the 2009 Health Information Technology for Economic and Clinical Health Act (HITECH). 8-10 HITECH offered billions of dollars in incentives for eligible hospitals and providers that adapted EHRs, adhered to meaningful use criteria and exchanged health information electronically with key health care partners through the Health Information Exchange (HIE). 8 The “meaningful use” requirements of the EHR include recording quality measures, e-prescriptions, decision support tools, and participation in the HIE. 10
electronic patient health records that are linked to the EHR 12 and empower patients to engage in shared decision-making 13,14 as well as improve communication between health care providers and patients. 15-17 Patient portals allow patients to securely communicate with providers after-hours, access their medical records, schedule appointments, refill prescriptions and pay medical bills. 15 Access to health information and shared decision making inspired by the use of HIT empowers patients to engage in patient-centered care (PCC). A recent survey demonstrated that patients are more engaged and pay more attention when they have access to their health information, which is especially true for those of lower socioeconomic statuses. 15 In addition to empowering patients with information, patient portals improve communication between providers and patients through patient messaging. Secure patient messaging has been associated with higher Health Effectiveness Data and Information Set (HEDIS) scores by improving patient engagement, connectedness and continuity of care 15 as well as some improved outcomes. 13,15,16 A quasi-experimental study conducted by Beth Israel Deaconess Medical Center primary care physicians showed that giving patients access to clinic notes was associated with improved medication adherence, improved communication, increased
understanding of care plans, improved patient engagement and patient and provider satisfaction. 16 A cluster-randomized controlled trial by Schnipper et al. demonstrated that patient engagement in medication reconciliation through the patient portal lead to reduction in dangerous discrepancies between medications recorded in the EHR and reported by patients. 18
were developed as ways to offset barriers related to cost. 13 Additionally, patient adaptation to electronic patient portals can be influenced by a multitude of factors. The “digital divide,” or patient access to the internet and computer literacy, as well as individual patient characteristics including health literacy, have been associated with use of the electronic patient portal. 12 An additional and related barrier to electronic patient portal use is access to technology that enables electronic patient portal use, which is a potential barrier in patients of lower socioeconomic statuses.
Regardless of the barriers to implementing electronic patient portals, other mechanisms for minimizing use of the ED for ASCs aim to broaden availability of primary care services, improve care coordination, and address the needs of patients who utilize the emergency department most often are resource intensive and costly. For example, one intervention is extending primary care office hours to increase access to health care. In a study completed in Italy, increasing PCP operating hours to 12 hours per day lead to a 10-15% reduction in inappropriate ED visits. 19 However, this intervention requires extra resources and funds from the clinic to open for longer hours. A second intervention, hiring care coordinators, is aimed at improving fragmented and poor communication between providers that often leads to
25% of ED visits. 22 Super Utilizers are defined by the Center for Medicare and Medicaid Services (CMS) as patients who visit the emergency department and are admitted to the hospital with extreme frequency, for causes that could have been prevented with better primary care. 22 Super Utilizer (SU) programs aim at addressing inappropriate care for these patient populations by guiding them to primary care resources and following up with them to troubleshoot any noncompliance or barriers they may have. 22,23 The results of SU programs vary and have demonstrated reductions in ED visits from 0-83% and cost benefit information is limited. 22
The electronic patient portal is an already established, affordable solution that aims to both increase patient engagement and access to care, two mechanisms by which inappropriate emergency department visits can be minimized. Unlike other initiatives with similar goals, the electronic patient portal’s upfront implementation costs are supplemented with meaningful use incentives. Because of this, the electronic patient portal is arguably the most feasible
intervention available to prevent emergency department visits for ambulatory sensitive conditions.
of the UNC Geriatrics clinic.
METHODS
Study Design
This study uses a “paper and pencil” questionnaire to survey a cross sectional
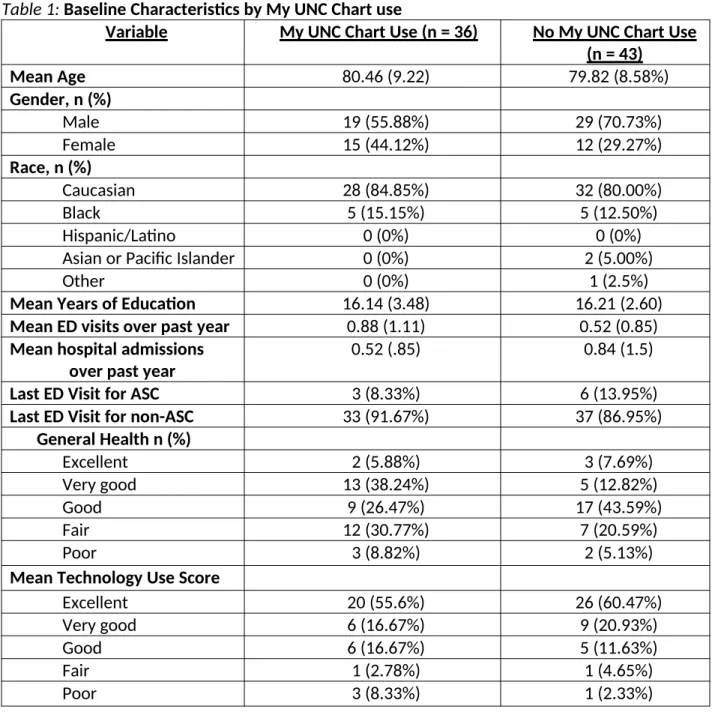
convenience sample of patients in the UNC Health Care Geriatrics Clinic. I recruited volunteer participants in the clinic’s waiting room on numerous days from May 11 2017 through June 1, 2017. The University of North Carolina Institutional Review Board approved this study. Patient participation was voluntary and all patients were consented prior to completing the survey. Eighty-one (81) patients in the Geriatrics Specialty Clinic at UNC in Chapel Hill, North Carolina, who presented for an appointment while I was present in the Clinic waiting room, consented to participate. Participants completed my questionnaire without my assistance. Patients who appeared to have dementia or would not be able to complete their survey independently for other reasons were not approached. The questionnaire and recruitment script can be seen in Appendix 1. The descriptive results for the 81 volunteers are presented in Table 1 as well as Figures 2-4 (Appendix 3).
We hypothesized that use of the UNC electronic patient Portal, My UNC Chart, would be associated with lower frequencies of ED visits and hospitalizations in the past year as well as lower use of the ED for ambulatory sensitive conditions (ASCs).
Outcomes
This study had three primary outcomes, including ED visits for ambulatory sensitive conditions (ASCs) as well as ED visits and hospitalizations in the past. The survey included questions quantifying ED visits and hospitalizations in the past year. I compared the results of an open-ended question asking about the reason for the most recent ED visit to the AHRQ list of ambulatory sensitive conditions. 7 Answers that did qualify as an ambulatory sensitive conditions were recorded as well. If I could not ascertain the reason for the ED visit, I treated the answer as missing.
Covariates
I measured technology use by a series of questions asking about the type and frequency of technology used by participants. Information about attempts to contact primary care
providers before last ED visit was included in the survey. Demographic information (age, sex, race and education) and health status was also asked in the survey.
Analytic Approach
not apply to the geriatric population (low birth weight admissions and asthma exacerbation in young adults). The categories used for ambulatory sensitive conditions included short term diabetes complications, perforated appendix, COPD/asthma exacerbation, hypertension, heart failure, dehydration, bacterial pneumonia, UTI, angina, uncontrolled diabetes, and lower extremity amputation among patients with diabetes. The principal investigator of the study adjudicated patient responses as ambulatory sensitive or coded them using a category of greater than 2000. These categories included trauma, chest pain, palpations, MI, dyspnea of unknown cause, pneumothorax, abdominal pain, varies, intestinal issue of unknown origin, nausea, GI Bleed, Renal Issue of unknown etiology, weakness/abnormal labs, syncope,
unknown cause, back pain, groin pain, knee injury, uncontrolled epistaxis, detox, gout, cancer complication, nutrition, flu, Lyme disease, common cold, stroke, Bells Palsy, ophthalmic complaints, and surgical complication. If I was unable to categorize a participant's response, I gave it a code of 5000 and did not use the data in the analysis. A description of this coding scheme is included in Figure 1 (Appendix 3). I ran individual Chi-squared tests with variables for gender, race, general health status, changes in health status in the past year and past 4 weeks, My UNC Chart use by the participant and My UNC Chart use by a proxy, ED visit time, attempt to contact the PCP before the ED visit and a technology use score.
I used rank sum tests to determine if My UNC Chart use was correlated with ED visits and hospitalizations in the past year, since these variables had a non-normal distribution across these outcomes. I used simple t-tests for the bivariate analysis of the variables for education level and age and the outcome of ED visit for ASC.
I employed a logistic regression modeling approach in order to determine which variables predicted use of the emergency department for ambulatory sensitive conditions vs. non-ambulatory sensitive conditions, ceteris paribus. The covariates included in the full model were race, sex, education level, general health status, and attempt to contact primary care provider before most recent ED visit. Because the study population was limited to geriatric patients, age was not included in the model, though it was tested for in the bivariate analysis. All analyses were performed in June 2017 using STATA 14.0 (StataCorp, LP, College Station, TX) software.
My Chart use and technology use score were also compared using a Spearman’s Correlation test.
RESULTS
Of the total 81 patients who volunteered to complete the study survey, 62 had
3.02) years of education on average. The baseline characteristics of participants who use My UNC Chart were relatively similar to those who did not use My UNC Chart, with the exception of differences in sex and health status (Appendix 3, Table 1).
The most recent ED visit for a non- ASC was statistically significantly associated with PCP contact type via My UNC Chart (R:-0.5, CI: -0.99, -0.01). As shown in Tables 2 through 4, none of the other independent variables were statistically significantly associated with ED visits for ambulatory sensitive conditions. Frequency of ED visits and hospital admissions in the past year were not associated with either My UNC Chart use or ED visits for non-ASCs (Appendix 3, Table 4). Spearman’s Rho did not suggest significant collinear relationships among any of the
covariates, including the technology use score and use of My UNC chart (Rho: -0.08, p=0.49). The final logistic regression model included demographic covariates hypothesized to influence the outcome variables for this study’s conceptual model. The variables included in the final model were education in years, gender, race, general health rating, PCP contact before most recent ED use, and use of My UNC Chart. Even though PCP contact type via My UNC Chart was associated with the primary outcome (R:-0.5, CI: -0.99, -0.01) this variable had 57 missing data points. PCP contact before most recent ED visit was correlated with the PCP contact type variable (Rho: -0.45, p=0.05), but had only 15 cases of missing data, making it more appropriate for inclusion in the multivariate analysis. None of the variables in the logistic regression
DISCUSSION
The purpose of this study was to investigate the association of electronic patient portal use with recent ED visits for ASCs among elderly patients attending a geriatrics clinic. This topic is important because electronic patient portals are already established mechanisms for assisting patients with care coordination and extended access to health care. These two solutions have been shown to improve patient outcomes, however they are resource-consuming and
expensive, so they are not widely implemented. 19-21 Since elderly individuals are less likely to use technology in the same way younger populations do 2, the present study aimed to
characterize how well the electronic patient portal is working for older patients, to help them reduce their use of the ED for ASCs, volume of ED visits over the past year, and volume of hospitalizations over the past year.
in this geriatric population. If this is the case, then it is important that future research strives to understand why. In this study we found no relationship between technology use and My UNC Chart use, so there may be additional barriers that we do not know of. Alternatively, a major limitation of our study was that it only included 80 participants and many of the variables had substantial levels of missing data. It is possible that additional participants and a complete database would create enough power to uncover important relationships.
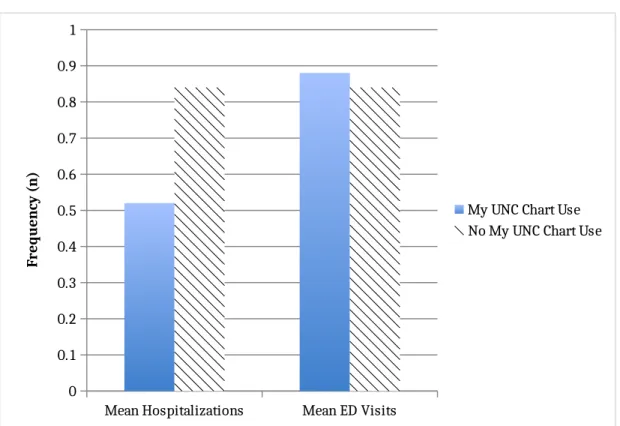
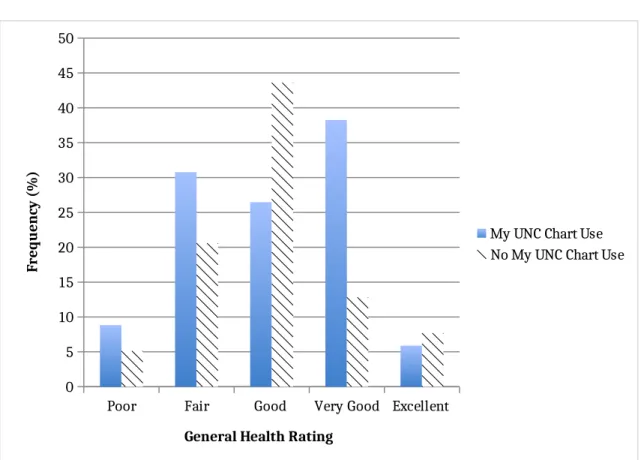
Moreover, in this study I focused on a small sample of older adults in Chapel Hill and implemented my survey at one geriatric clinic. The group of people that made up my sample happened to be exceptionally well educated and technologically savvy. Additionally, a majority of both My UNC Chart users and non-users in this group rated their health as “good” or “very good” (Appendix 3, Figure 4). Furthermore, these study participants averaged less than one ED visit and hospitalization per year. It is reasonable to surmise that the lack of association found in this group of well educated, technologically savvy, healthy elderly patients may have resulted from a “ceiling effect.” This population may not be using the emergency department already because of their various societal advantages and there is little that can be done to decrease their already infrequent ED visits. This group is also, by nature of this study, already connected with primary care, which may also contribute to their low number of emergency department visits. In a population like this that is already doing well, the effects of the electronic patient portal may be limited. Much larger studies with more diverse study populations are needed in order to explore these questions further.
hospitalized patients rather than for patients in the emergency department. Some of these PQI’s include information that is not apparent until later in the hospital course. Two examples illustrate this: “PQI 13 - Angina without procedure admission rate” or “PQI 02- Perforated appendix admission rate.” 7 These PQI’s are better suited for analyzing a patient’s condition during the hospital course than during their visit to the emergency department. Second, attributing the cause of an ED visit to an ASC is challenging when we are deriving data from an open ended question, completed by participants without probing or guidance, and may be more accurately derived via interviews. Many responses to the open-ended question were short and ambiguous. For example “my heart” could not clearly be identified as a serious emergent condition, a symptom, or an ambulatory sensitive condition. Other vague answers such as “kidney problem” and “eye issue” could have been ambulatory sensitive complications of uncontrolled diabetes, for example, but there was not enough information from the
respondents to determine either way. Furthermore, it is also a possibility that AHRQ’s PQIs work better in younger populations and are not applicable in this population.
In addition to the limitations mentioned above, survey research has an inherent limitation of recall bias. However, we focused on each participant’s most recent emergency department visit and because visits to the ED are often stressful and memorable, it is more likely that these events would be remembered more clearly by participants.
or ED use specifically. Many of the alternative approaches to reducing ED visits for ASCs as well as ED visits and hospitalizations work better in specific populations. There are no studies currently investigating interventions for improving these outcomes in elderly populations specifically. This is an important topic to understand since ED use increases with age. 33
Future research on the utility of electronic patient portals in reducing ASC in the
emergency department should work to identify PQIs specific to the ED for determining whether a condition is ambulatory sensitive while the patient is in the emergency department.
Moreover, we need more and better mechanisms for identifying reasons for ED department visits. Though patients may be able to accurately recall why they went to the emergency department, the diagnosis should be verified using medical records to see if the cause could have been prevented in the ambulatory care setting. Additionally, larger and more diverse elderly populations should be studied in order to accurately characterize electronic patient portal use in this population. More research also must be conducted to determine how to improve electronic patient portals and make them more user friendly. Less than half of the participants in our study used My UNC Chart even though they all had access. Further characterizing the potential barriers to electronic patient portal use in various patient
populations is an important step toward optimizing this interventions ability to improve patient outcomes.
CONCLUSION
APPENDIX !: STUDY TOOLS
Exhibit 1: Survey
Thank you very much for participating in this short research survey! I am
studying the ways patients use technology as part of their care. Your answers to
this survey will help us find ways to improve technology use in health care. This
survey will take you just a few minutes to complete. Your answers are
completely confidential. My faculty advisors and I do not want to ask for any
information that will identify you in any way. We only want to know some of
your recent experiences with your care.
This study has been approved by the Institutional Review Board at the
University of North Carolina. You can stop it at any time or skip any questions
that make you feel uncomfortable.
If you have questions, you can reach the IRB at 919-966-3113 and you can call
my faculty advisor, Dr. Sue Tolleson-Rinehart, at 919-843-9477.
Phone and Computer Use:
Do you own a cellular/mobile phone?
Circle one: YES NO
Is your cellular/mobile phone an Iphone, Android, or a Blackberry?
How many times a day do you use your cellular/mobile phone for any purpose?
____________________________________________________
Do you own a computer?
Circle one: YES NO
How many times per week do you use your computer? Your best guess is fine!
____________________________________________
___________
Do you use an Ipad, tablet, or any other device on a regular basis?
Circle one: YES NO
Which device do you use? ______________________________________
How many times per week do you use this device?
__________________
UNC My Chart:
Have you ever used My UNC Chart?
Circle one: YES NO
If you answered “NO” to the question above, does anyone use My UNC Chart for
you?
Circle one: YES NO
If you answered “no” to both the two questions above, you can skip to the
"recent healthcare experiences section" on page 5. If you answered yes, we
have a few more questions for you!
Does anybody help you use My UNC Chart or use it for you?
Circle one: YES NO
How many times per month do you use My UNC Chart? Circle one:
0
1-3
4-6
7-9
>10
What do you use My UNC Chart for?
a. Sending messages to providers
b. Paying bills
If other, please specify what you use My UNC Chart for:
____________________________________________________________
If you do use My UNC Chart, how do you prefer to use it? Please circle all that
apply
a. On my computer at home
b. On my cellular phone
c. On my tablet or other device
If you use My UNC Chart, we’d like to know what you think of it. The next few
questions are about your use of this tool.
My UNC Chart is...
(Circle one in each row.)
Strongly Disagree
Disagree Neither Agree nor Disagree
Agree Strongly Agree
Helpful
1
2
3
4
5
Enjoyable to use
1
2
3
4
5
Has helped me
manage my
Healthcare
Now we’d like to ask about some of your recent health care experiences:
Think back to your last Emergency room visit…
What was the main reason you came to the emergency room?
____________________________________________________________
____________________________________________________________
What time of day did you come to the emergency room?
a.
Normal daytime hours
b.
Evening or late night
c.
In the middle of the night
d.
Early morning
Did you try to reach your primary care provider before you went to the
emergency room?
Circle one: YES NO
If you did try, how did you go about contacting your primary care provider?
a.
Telephone
b.
My UNC Chart
c.
d.
Text
e.
Other (Please specify:____________________________________)
If you answered “other” in the previous question, can you tell us about that?
How many times have you visited the emergency room in the past year? Your
best guess is enough, if you’re not sure!
____________________________________________________________
How many times were you admitted to the hospital in the past year? Again, your
best guess is enough!
Now we would like to know a few more things about you:
In general, how would you rate your health right now?
a. Excellent
b. Very good
c. Good
d. Fair
e. Poor
Compared to one year ago, how would you rate your general health today?
a. Much better now than one year ago
b. Somewhat better now than one year ago
c. About the same
d. Somewhat worse now than one year ago
e. Much worse now than one year ago
During the past 4 weeks, have health or emotional problems interfered with your
normal day to day life with family, friends, neighbors, or groups?
a. Not at all
b. Slightly
c. Moderately
d. Quite a bit
e. Extreme
A few last questions:
Are you…(please circle one):
Male
Female
I describe myself another way
Decline to say
How would you describe yourself? Circle all that apply:
Caucasian
Asian or Pacific Islander
Other _____________
In what year were you born? ____________________________________
Would you mind telling us how many years of school you have? ________
Exhibit 2: Survey Script
Script for Utility of My UNC Chart Study
Hello! My name is Danielle Day and I am a medical student here at UNC. I am conducting a research study on how our patients use technology to help them with their health care. I have a very short, simple survey about what kinds of technology you use. Would you be willing to answer it? It will take you just a few minutes.
It asks what kinds of technology you use. It asks you a few questions about your health, and some questions about yourself. It does not ask you any information that identifies you in any way.
I will treat your answers with great respect and confidentiality. You are welcome to stop the survey at any time.
Would you be interested in participating? Patient: No
DD: Okay, thank you so much for hearing about my study. I hope you have a nice day! Patient: Yes
Partial Systematic Review
INTRODUCTION
Use of the emergency department (ED) for ambulatory sensitive conditions (ASCs) imposes a significant financial and resource depleting burden on the United States health care system. 3-5 Treatment for ASCs is more expensive in the ED than in the primary care setting, resulting in higher costs for similar diagnoses and treatments. 4,5 Many of the methods introduced to prevent use of the emergency department for ASCs aim to increases access to primary care 19, improve care coordination 20 and address the needs of patients that use the emergency department the most often are labor intensive and costly. 22 Use of electronic patient portals is one proposed mechanism for to improve access to care and stimulate patient engagement through providing after hours contact with physicians, access to personal health records, electronic prescription refill requests, appointment reminders and in some cases electronic visits with providers.
The electronic patient portal was developed as part of the electronic health record (EHR). Optimization and wide spread implementation of the EHR was incentivized under the 2009 Health Information Technology for Economic and Clinical Health Act (HITECH). 8-10 HITECH offered billions of dollars in incentives for eligible hospitals and providers that adapted EHRs, adhered to meaningful use criteria and exchanged health information electronically with key health care partners through the Health Information Exchange (HIE). 8 The “meaningful use” requirements of the EHR, include recording quality measures, e prescribing, decision support tools, and participation in the HIE. 10 The development of the EHR began in 1980’s for
1990’s. 11 In the early 2000’s these charts were expanded to include non-clinical health information, earning the name “electronic health record. 11
In addition to recording patient information, EHRs are now being used to encourage patient engagement and to improve access to the health care system through the development of components like EHR-based patient portals. 11 However, the effectiveness of patient portals is hard to determine. Patient engagement is defined in numerous ways 34-36 and the literature describing the ability of the electronic patient portal to effect outcomes and quality of care is sparse. 37-39 Since patient engagement is a proposed intermediate variable through which portal use affects outcomes, an important first step for understanding the effectiveness of patient portals is to analyze the association between patient engagement and portal use.
Even though electronic patient portals have been implemented in health care systems widely, there are numerous barriers to its use. Certain patient populations, such as the elderly, may not be using electronic patient portals to their full potential. Technology use is growing in elderly populations, 24 but previous studies have shown that less than 60% of people over 65 are regular internet users. 2 The elderly population represents a large proportion of the United States population, thus it is important to understand how older adults use patient portals and how it affects their health care.
To this date, there have been no systematic reviews identified that address the
use. This study specifically looked at patients over the age of 55 and compared patients that use the electronic patient portal with those who do not use it or that use it less often.
METHODS
I followed a standard protocol that we developed specifically for this study. This protocol has not been previously used or published.
Key Question and Analytic Framework
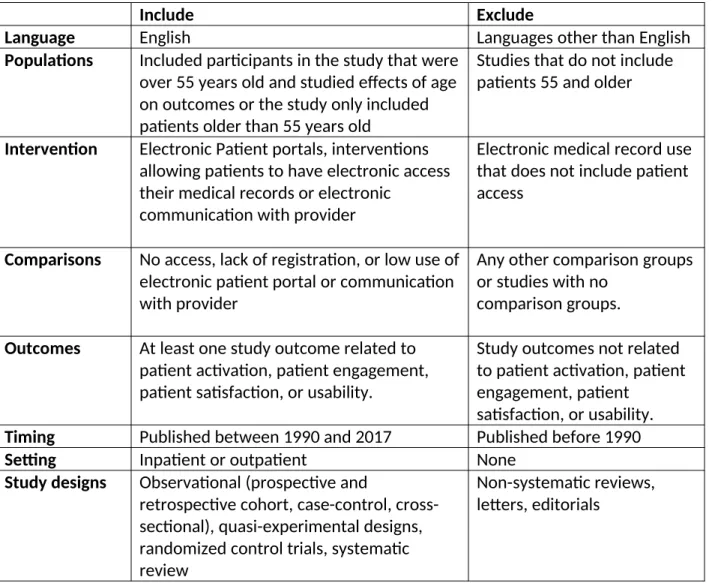
The purpose of this systematic review was to answer my key question about the association of electronic patient portal with patient engagement in patients over the age of 55 and characterize attitudes about electronic patient portals that exist in this population. I used an analytic framework that I developed before completing the literature review, which included detailed criteria for study selection including language, patient population, interventions, outcomes, comparators, study time periods, study settings and which study designs would be included (Appendix Figure 1).
Data Sources and Searches
My search strategy included searching PUBMED and the Cochrane Library for studies published between January 1990 and the last date the search was conducted, April 20, 2017. The start date for selected studies was determined by the date when the first electronic
Study Selection
Inclusion and exclusion criteria was developed before the database search and included detailed requirements the study languages, population, intervention, comparators, outcomes, timing, setting and study designs included in the study (Appendix 3, Figure 1). The study types I included were observational (prospective and retrospective cohort, case-control,
cross-sectional), quasi-experimental designs, randomized control trials and systematic reviews. I included studies that either only studied patients 55 years and older or that included patients 55 years old and older and completed an analysis that looked at the association of age with the study outcomes. Because the definition of electronic patient portals can vary by institution, my criteria included interventions that allowed patients to access their medical records or
communicate with their primary care provider electronically. Intervention groups had to be compared to patients with either no access to, low use of, or lack of registration for the electronic patient portal. Studies had to have at least one study outcome related to patient activation, patient engagement, patient satisfaction, or usability.
I applied exclusion and Inclusion criteria to titles and abstracts and then to the full text of the remaining articles to identify articles used in the final analysis.
Data Extraction and Quality Assessment
I completed data extraction using a structured form from our standard study protocol. Extraction items included information about the study design, population, intervention, comparators, outcomes, timing and setting.
assessed the selection of cases/cohorts, treatment of confounders, methods of outcome assessment, length of follow up and statistical analysis of each study. The quality of evidence for each outcome was then rated as good, fair or poor based on the cumulative evidence from the study level quality assessment for each outcome measured.
Data Synthesis and Analysis
Evidence was collected and stratified by outcomes, including patient engagement in their healthcare after use of the electronic patient portal, patient satisfaction with the
electronic patient portal, usability of the electronic patient portal, and barriers to patient portal use. A qualitative analysis and synthesis of data was conducted using available evidence in the included studies. Since there is currently little data on this topic, low quality studies were included in this synthesis. However, the quality of the evidence for each outcome was taken into account in the results and conclusion sections.
Funding
There was no funding for this study and the investigators have no financial conflicts of interest.
RESULTS
Study Selection
included in the appendix (Appendix 3 Figure 1).
Study Characteristics
The studies in my final analysis (n = 3) included one cross sectional survey study, 27 one pre-test/post-test survey design, 28 and one cluster randomized control trial. 29 Sample sizes ranged from 453- 1390 participants (Appendix 3 Table 8). The average time frame of the studies varied from no time (cross-sectional study) to one year. Two of the studies were completed in the Netherlands 27,28 and one study was completed in the United States. 29 One study focused specifically on patients with Rheumatoid Arthritis 28, one study focused specifically on patients with diabetes 27 and the third study looked at patients that were
diagnosed with hypertension. 29 All three studies used survey data to measure at least some of their outcomes. One study looked at EMR data in addition to survey data 27 and the other used measures taken at health visits. 29
Risk of Bias within Studies
The risk of bias within the studies with the predetermined critical appraisal template resulted in ratings of “good” for all three studies. 27-29 The individual ratings for each category of the predetermined critical appraisal template are included in Appendix 3 Table 9.
Synthesis of Bias Across Studies
Synthesis of results
Results for each studied are summarized in Table 10 in Appendix 3.
Patient engagement and activation with the electronic patient portal
Two of the three studies included in this systematic review reported on patient engagement and activation with use of electronic patient portals 28,29. The cluster-randomized trial by Wagner et al. found that there was no impact of the patient health record (PHR) on patient activation in the population they studied (p=0.23 for the Patient Activation
Measurement (PAM) and p= 0.963 for the Patient Empowerment Score (PES)). 29 In the pre- and post-test survey study by van der Vaart et al., the measures on patient activation and
engagement included involvement in treatment, knowledge about the treatment, quality of care, knowledge about the disease, understanding of what care providers explain, self efficacy in communication with care providers, trust in care provider, understanding of requirement for medications, medication adherence, communication with other regarding disease, and online searches for health information. None of these variables were statistically significantly different between non-users, website users and login users. 28
Patient satisfaction and Usability of the electronic patient portal
pre-test post-pre-test study, investigated patient satisfaction with the electronic patient portal by looking at ease of login, compression of login pages, finding incorrect or out of date information and encountered problems when attempting to log in. 28 These variables were scored on a 5 point likert scale (1 being very negative and 5 being very positive) and since the pre-test was the comparison group for this study there were only descriptive statistics given for these outcomes. For the ease of login variable, the following was reported: ease of use (4.4 +/- 0.8), clarity (4.3 +/- 0.7), usefulness (4.3 +/- 0.7), and completeness (4.1 +/- 0.9). For the
comprehension of login page, the following was reported: disease activity (3.4 +/- 0.7), medication (3.5 0.6), blood results (3.5 0.5), and feedback on monitored data (3.5 +/-0.6). There were 15 (17%) participants that encountered at least 1 problem when logging into the patient portal and 2 (2%) that encountered 2 problems when logging into the patient portal. 28 There was no statistically significant difference between nonusers in satisfaction and trust in their care providers. 28
Usefulness of the electronic patient portal
Patient Portal Use in the Elderly
All three studies included patients aged 55 and older. 27-29 None of the studies analyzed patients 55 and older separately. However, since these studies were on patient populations with chronic disease (diabetes, rheumatoid arthritis and hypertension) the mean age in each of the three studies was above 54. For the study by Ronda et al. the mean age was 63.9 (+/- 12.2). 27 The mean age in the van der Vaart et al. was (62 +/- 13.2) and the mean age in the Wagner et al. study was (54.8 +/- 12.4). All three studies included age in their multivariable analysis for predicting electronic patient portal use and all three studies found that increasing age was a predictor of using the electronic patient portal less often. 27-29 The Ronda et al. study found that increasing age was associated with not using a portal (OR: 1.04, CI: 1.00-1.08). 27 The Wagner et al. study showed that a higher age of enrollment in their cluster-randomized control trial was associated with no use of the PHR (OR: 0.96, CI: 0.93-1.00). 29 The van der Vaart et al. study found that web portal use was significantly predicted by age (b=0.09, X2 (1)= 4.74) in their logistic regression model.
DISCUSSION
Summary of Evidence
electronic patient portal use. One of the studies looked at usefulness of the electronic patient portal and found that most of the elements making up this variable were moderate to positively rated. One study looked at usefulness of the electronic patient portal and found that subjects that chose to use the portal more often rated the usefulness of its various elements as higher. For the association of age with electronic patient portal use, all three studies found that increasing age negatively predicted use or higher frequency of use of the electronic patient portal.
For the patient engagement and activation variable, there is low to moderate evidence that there is no association with patient portal use. The two studies that looked at this outcome were large and included two different types of study designs. Because the studies for this outcome looked at heterogeneous patient populations both in disease profile and location, it is difficult to extrapolate this finding to the general public. There is uncertain evidence for patient satisfaction with and usability of the patient portal variable. The evidence for patient
satisfaction with their clinical care varied in the two studies where it was investigated and only one study described the usability of the patient portal but it did not test any hypotheses. Additionally, these two studies were conduction on two different patient populations
(hypertension and rheumatoid arthritis) in two different countries. Thus, it is difficult to draw broad conclusions on this variable that can be applied to patient populations that are 55 and older with different characteristics. The usefulness of the electronic patient portal variable was only reported on in one study and this study focused on patients with diabetes in the
this systematic review agreed on this variable increases the strength of evidence. However, as with the other variables, since the studies focus on patients only with hypertension, diabetes or rheumatoid arthritis, it is difficult to generalize these findings to the elderly in total.
Limitations
There are numerous limitations to this systematic review. There is currently limited research describing the ability of the electronic patient portal to increase patient engagement specifically in elderly patients. All of the studies included larger samples that looked at the association of age with outcomes in secondary analyses. More studies are needed to investigate the utility of the electronic patient portal in improving outcomes in older adults, because in there is strong evidence that predict elderly do not use the electronic patient portal as often as younger adults and further interventions may be necessary to making the electronic patient portal suitable for this population. Another limitation of this study is that there was only one investigator reviewing the articles and extracting data for analysis. This review is also limited because it only included a search of only 2 databases, PubMed and Cochrane. There was no searching of the gray literature done for this study. This systematic review included patients with heterogeneous characteristics, however, each study only looked at patients with specific chronic diseases (hypertension, diabetes, and rheumatoid arthritis). There are currently a lack of data about how electronic patient portals work in healthy older patients.
CONCLUSION
of the variables explored in this study. It is important that future studies attempt to strengthen the evidence on this topic as well as other characteristics of patient portal use in elderly
APPENDIX 3: Tables and Figures
Figure 1: Coding Scheme for Ambulatory Sensitive Conditions
What is the main reason that you went to the emergency room?
Unable to acertain Short-term diabetes complications, perforated appendix, COPD/asthma exacerbation, hypertension, heart failure, dehydration, bacterial pneumonia, UTI, angina, uncontrolled diabetes, and lower extremity amputation among patients with diabetes
Trauma, chest pain, palpations, MI, dyspnea of unknown cause, pneumothorax, abdominal pain, varices, intestinal issue of unknown origin, nausea, GI Bleed, Renal Issue of unknown etiology, weakness/abnormal labs, syncope,
unknown cause, back pain, groin pain, knee injury, uncontrolled epistaxis, detox, gout, cancer complication, nutrition, flu, Lyme disease, common cold, stroke, bells palsy, eye issue, and surgical complication
Table 1: Baseline Characteristics by My UNC Chart use
Variable My UNC Chart Use (n = 36) No My UNC Chart Use
(n = 43)
Mean Age 80.46 (9.22) 79.82 (8.58%)
Gender, n (%)
Male 19 (55.88%) 29 (70.73%)
Female 15 (44.12%) 12 (29.27%)
Race, n (%)
Caucasian 28 (84.85%) 32 (80.00%)
Black 5 (15.15%) 5 (12.50%)
Hispanic/Latino 0 (0%) 0 (0%)
Asian or Pacific Islander 0 (0%) 2 (5.00%)
Other 0 (0%) 1 (2.5%)
Mean Years of Education 16.14 (3.48) 16.21 (2.60)
Mean ED visits over past year 0.88 (1.11) 0.52 (0.85)
Mean hospital admissions over past year
0.52 (.85) 0.84 (1.5)
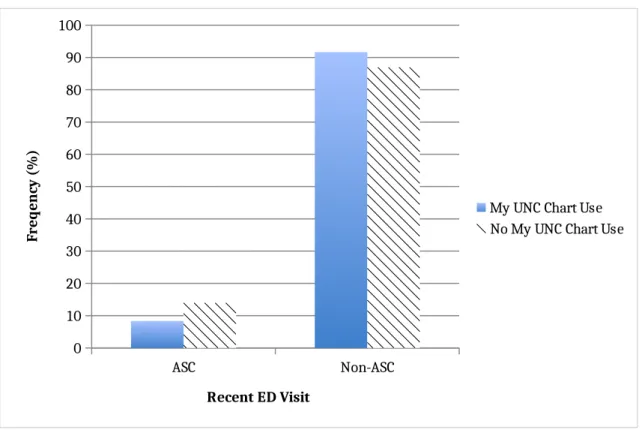
Last ED Visit for ASC 3 (8.33%) 6 (13.95%)
Last ED Visit for non-ASC 33 (91.67%) 37 (86.95%)
General Health n (%)
Excellent 2 (5.88%) 3 (7.69%)
Very good 13 (38.24%) 5 (12.82%)
Good 9 (26.47%) 17 (43.59%)
Fair 12 (30.77%) 7 (20.59%)
Poor 3 (8.82%) 2 (5.13%)
Mean Technology Use Score
Excellent 20 (55.6%) 26 (60.47%)
Very good 6 (16.67%) 9 (20.93%)
Good 6 (16.67%) 5 (11.63%)
Fair 1 (2.78%) 1 (4.65%)
Figure 2: Recent ED visit for Ambulatory Sensitive Condition by My UNC Chart Use
ASC Non-ASC
0 10 20 30 40 50 60 70 80 90 100
My UNC Chart Use No My UNC Chart Use
Recent ED Visit
Fr
eq
en
cy
(
%
)
ED = Emergency Department
Figure 3: ED Visits and Hospitalizations in the Past Year by My UNC Chart Use
Mean Hospitalizations Mean ED Visits 0
0.1 0.2 0.3 0.4 0.5 0.6 0.7 0.8 0.9 1
My UNC Chart Use No My UNC Chart Use
Fr
eq
u
en
cy
(
n
)
Figure 4: General Health Rating by My UNC Chart Use
Poor Fair Good Very Good Excellent 0
5 10 15 20 25 30 35 40 45 50
My UNC Chart Use No My UNC Chart Use
General Health Rating
Fr
eq
u
en
cy
(
%
)
UNC = University of North Carolina
Comparison to Non-ASC ED Visit Chi-Squared (X2)
Risk Difference Confidence Interval
Gender
Male -0.08 -0.39, 0.24
Female 0.30 0.03, 0.56
General Health
Excellent 0.06 -0.01, 0.13
Very Good -0.16 0.51, 0.19
Good 0.08 -0.22, 0.38
Fair 0.02 -0.27, 0.32
Poor -0.01 -0.23, 0.21
General Health Compared to 1 yr Ago
Much better 0.06 -0.01, 0.12
Somewhat better 0.02 -0.30, 0.35
About the same 0.12 -0.21, 0.45
Somewhat worse -0.28 -0.65, 0.08
Much worse 0.08 0.004, 0.15
General Health 4 Wks
Normal daytime hours -0.07 -0.28, 0.14
Evening or late night 0.15 0.06, 0.23
In the middle of the night 0.17 -0.16, 0.50
Early morning -0.22 -0.56, 0.12
-0.04 -0.25, 0.18
Race
Caucasian 0.06 -0.23, 0.35
Black -0.10 -0.39, 0.18
Hispanic/Latino 0.02 -0.02, 0.06
Asian or Pacific Islander 0.02 -0.02, 0.06
Student’s T-Test
CI p
Age (77.98, 82.16) 0.79
Education (15.42, 16.82) 0.68
Comparison to Non-ASC ED Visit
Chi-Squared (X2)
Risk Difference Confidence Interval
Technology Use Score
Excellent 0.81 0.37
Very Good 0.32 0.57
Good 0.0003 0.99
Fair 0.35 0.55
Poor 0.35 0.55
My UNC chart use 1.18 0.28
My UNC Chart Use by Proxy 0.01 0.92
My UNC Chart Use Frequency
0 times per month 0.07 -0.02, 0.16
1-3 times per month 0.20 -0.18, 0.58
4-6 times per month -1.17 -0.44, -0.21
7-9 times per month -0.09 -0.33, 0.15
>10 times per month -0.06 -0.30, 0.19
My UNC Chart Technology
Computer -0.14 -0.27, -0.01
Cellular Phone 0.11 -0.01, 0.22
Tablet or Other Device 0.04 -0.03, 0.10
My UNC Chart Helpfulness
Strongly Disagree 0.03 -0.03, 0.10
Neither Agree nor Disagree 0.10 -0.01, 0.21
Agree -0.125 -0.51, 0.26
Strongly Agree -0.01 -0.39, 0.37
My UNC Chart Enjoyability
Strongly Disagree 0.04 -0.03, 0.10
Disagree -0.13 -0.35, 0.10
Neither Agree nor Disagree 0.19 -0.16, 0.55
Agree 0.08 -0.27, 0.43
Strongly Agree -0.19 -0.56 0.18
MY UNC Chart Assistance in Managing Health Care
Strongly Disagree 0.04 -0.03, 0.77
Neither Agree nor Disagree -0.10 -0.43, -0.23
Agree 0.34 -0.01, 0.70
Strongly Agree -0.28 -0.66, -.10
Comparison to Non-ASC ED Visit
Chi-Squared (X2)
Risk Difference Confidence Interval
ED Visit Time
Normal daytime hours 0.05 -0.42, 0.33
Evening or late night 0.14 -0.20, 0.50
In the middle of the night -0.08 0.32, 0.16
Early morning -0.01 -0.26, 0.24
PCP Contact 0.20 -0.09, 0.50
PCP Contact Type
Telephone 0.23 -0.31, 0.77
My UNC Chart -0.5 -0.99, -0.01
Email 0.27 0.04, 0.050
Comparison of Additional Outcomes with My UNC Chart Use
Rank Sum Test
z p
ED Visit Frequency Over Past Year
-0.165 0.87
Hospital Admissions Over Past Year
0.52 0.60
Table 5:Multivariable Analysis for Predictors of Recent ED use for Non-ASCs
Appropriate ED Use for Non-ASCs
My UNC Chart Use 10.72 0.66, 174.61
Gender
Female 0.18 0.02, 2.08
Education 0.98 0.65, 1.5
Race
Black 0.07 0.003, 1.79
General Health
Very good 1.52 0.03, 75.66
Good 3.79 0.06, 242.89
Fair 0.85 0.02, 37.50
PCP Contact 21.50 0.52, 888.66
Include Exclude
Language English Languages other than English
Populations Included participants in the study that were over 55 years old and studied effects of age on outcomes or the study only included patients older than 55 years old
Studies that do not include patients 55 and older
Intervention Electronic Patient portals, interventions allowing patients to have electronic access their medical records or electronic
communication with provider
Electronic medical record use that does not include patient access
Comparisons No access, lack of registration, or low use of electronic patient portal or communication with provider
Any other comparison groups or studies with no
comparison groups.
Outcomes At least one study outcome related to patient activation, patient engagement, patient satisfaction, or usability.
Study outcomes not related to patient activation, patient engagement, patient
satisfaction, or usability.
Timing Published between 1990 and 2017 Published before 1990
Setting Inpatient or outpatient None
Study designs Observational (prospective and
retrospective cohort, case-control, cross-sectional), quasi-experimental designs, randomized control trials, systematic review
Non-systematic reviews, letters, editorials
Database Search Terms Used
Cochrane (elderly OR geriatric OR aged) AND
(electronic patient portal OR electronic medical record) AND (Patient engagement OR patient activation)
PubMed ("Meaningful Use"[Mesh] OR "Patient
Portals"[Mesh] OR "Electronic Health Records"[Mesh] OR "Medical Record Linkage"[Mesh]) AND ("Aged"[Mesh] OR "Aged, 80 and over"[Mesh] OR
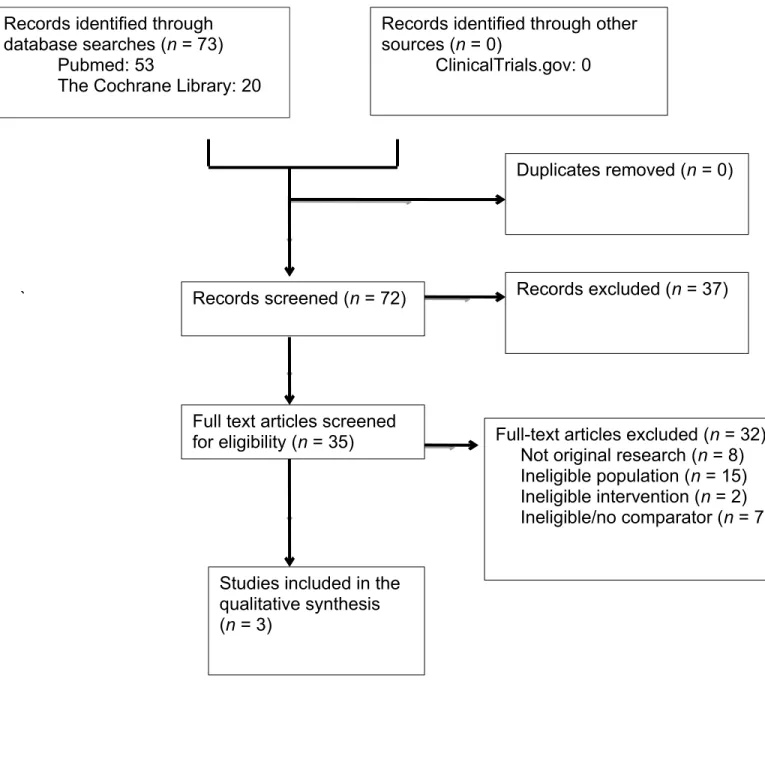
Figure 2: Systematic Review Summary of Evidence Search and Selection.
`
Table 8: Systematic Review Study Characteristics
Records identified through other sources (n = 0)
ClinicalTrials.gov: 0 Records identified through
database searches (n = 73) Pubmed: 53
The Cochrane Library: 20
Duplicates removed (n = 0)
Records screened (n = 72) Records excluded (n = 37)
Studies included in the qualitative synthesis (n = 3)
Full text articles screened
Table 9: Risk of Bias Within Each Study
Study Sample
Size
Time Frame
Intervention Outcomes Comparator
Ronda MCM et. al. 1390 NA (cross-sectional survey study) Web portal login and access Patient Characteristics, attitudes about portal
No web portal login and access
Van der Vaart R et al.
360 6 months Home access to EMR Usability, management of care Pre-test survey data before intervention
Wagner et al. 453 1 year Personal Health
Record (PHR) Biological outcomes for hypertension, patient empowerment, patient perception of quality of care and use of medical services
#DM = Diabetes Mellitus, *EHR = Electronic Health Record, %PAM = Patient Activation Measure, &PACIC = Patient Empowerment Scale^, CAHPS =
Consumer Assessment of Healthcare Providers and Systems
Table 10: Systematic Review Results
Study Selection of Cases/Cohorts Assessment for Confounders Methods of Outcome Assessment Length of Follow Up Statistical Analysis
Ronda MCM et. al.
Survey sent to patients with Type I and II DM#
at 62 Prisma Practices and 1 outpatient clinic in the Netherlands GOOD None FAIR Patients EHR* and 2 different questionnaires designed for each group GOOD NA (cross-sectional survey study) FAIR -Chi-square, t-tests and Mann Whitney tests for all variables, Multivariable logistic
regression used to look at association between patient characteristics and not requesting login GOOD Van der Vaart R
et al. Patients diagnosed with Rheumatoid Arthritis were selected from patient database in the Netherlands (arthritis Centre Twente in Enschede) GOOD None POOR
Pre- and Post test survey before and after launching a hospital based web portal GOOD 6 Months FAIR -chi squared tests, Mann Whitney and Kruskal-Wallis for Univariate -Multinomial regression modeling to find variables predictive of portal use
GOOD Wagner et al. -Physicians were
recruited (from one family medicine and one internal medicine clinic) and randomly assigned to each intervention -13 intervention and 11 control -Patients of these physicians were study participants POOR None POOR -Repeated Measures of Study Variables at Four Visits (baseline, 3 months, 6 months) -Biologic Measures, PAM%
PACIC&, Patient
Empowerment Scale, CAHPS^
Study Ronda MCM et. al. Van der Vaart R et al. Wagner et al.
Funding The Diabetes Fund, The
Netherlands Organization for Scientific Research in Diabetes
Unrestricted educational grant from Pfizer, Inc. with no involvement in data collection, analysis, or manuscript preparation and submission by the company.
Grant from the Agency for Healthcare Research & Quality
Design Survey study Pre-test Post-test Prospective two-group
cluster-randomized effectiveness trial
Intervention “Digitaal Logboek” (electronic patient portal) use
Hospital-based patient web portal
Electronic PHR# Access
Comparison No electronic patient portal use Pre- hospital portal group compared to post-hospital portal group
No Personal Health Record Access
Inclusion Diagnosed with diabetes Patients diagnosed with
rheumatoid arthritis
Documented
hypertension based on JNC 7 guidelines
Exclusion None Being deceased, last
consultation longer than one year ago, no diagnosis with RA, severe comorbidity, change of hospital
Physician request, Patient decline, acute illness
Population Characteristics
The mean age was 63.9 years old. There were more males in the participant group than in the nonparticipant group.
-No difference between gender/ age at t0
-Difference between responders and nonresponses in age at T1 (MD: 4.2, p = 0.02), but no difference in gender
The mean age of study population was 55, including 50% white and 46% black participants. There were more female participants in the intervention group than in the control group. There was a higher average REALM score (adult literacy) in the intervention group. All remaining characteristics were similar.
Outcome Assessment
Data obtained from questionnaires included education level, ethnicity, living status, employment status, medications, smoking, drinking, fluency in Dutch language, and access to Internet/computer. Patient information including age, diabetes type, duration of diabetes, setting of diabetes treatment, HbA1c, and total cholesterol were abstracted from electronic health records.
Pre- survey was implemented at T0 and included baseline information about socio-demographics, health literacy, use of the internet, and information about rheumatoid arthritis history. Additional validated study instruments were used to measure satisfaction with care, trust in physician, self-efficacy in patient-provider
communication, illness
Researchers met with patients at each study visit to collect data (3 months, 6 months, 9 months-1 year). Measures included changes in BP, patient empowerment (Patient Activation Measure and Patient Empowerment Scale) and quality of care (Clinician Group
perception and medication adherence. The post-survey was conducted at T1 and did not include health literacy but included use of the website section/login section of the portal, perceived usability of the portal, problems encountered, difficulties understanding information in the login section and incorrect information in the login section.
Patient Assessment of Chronic Illness Care). Medical care use was self-reported.
Results A majority of non-users stated their reason for not using the electronic patient portal as not knowing it existed (72.4%). Multivariable analysis found
older age and smoking to be associated with not using the patient portal. Treatment by an internist instead of a general practitioner, more education, using insulin, polypharmacy, better diabetes knowledge and increased incidence of
hyperglycemic episodes were not associated with web portal use. More users vs. non-users were informed of the web portal’s existence by their physicians (94.9%). Non-users perceived web content as less useful than users.
54% of respondents with access to internet used portal. Age, amount of internet use, and self perceived use of internet predicted portal use. 44% of patients who used portal felt more involved in their
treatment and 37% felt like they had more knowledge about their treatment. One patient felt less involved and less
knowledgeable in their treatment after portal use.
There were no changes in BP, patient activation, patient perceived quality of care and medical care use observed in the intention to treat analysis. Sub analysis of patients assigned to intervention who identified themselves as active users showed a reduction in BP. Frequency of PHR use was associated with younger age, computer skills (self-reported) and increased ratings of positive provider communication.
Analysis Chi-squared, t-tests and Mann-Whitney tests completed to compare covariates.
Multivariable logistic regression was done to investigate associations between patient characteristics and not requesting a login.
Kruskal-Wallis tests were applied for continuous variables and chi-squared tests were applied for discrete variables to explore investigate associations between patient characteristics and portal usage.
Intention to treat analysis was conducted with adjusted intra-class correlation coefficients (ICC) and design effects that were calculated for selected variables using baseline data with cluster-randomized design (subjects nested within physician clusters).
Attrition (overall)
31.6% questionnaire participation with returned questionnaire and signed consent form.
46% of respondents did not complete both of the surveys
Attrition (exposure specific)
Cross-sectional. Not applicable. Of the people sent
questionnaires (372) 30% did not complete survey at T0 and 41% did not complete survey at T1.
In the intervention group, 44 (23%) were lost to follow up and did not attend visit 4 and 20 (10%) attended visit 1 only. In the non-intervention group, 45 (18%) were lost to follow up and did not attend visit 4 and 16 (6.3%) attended visit 1 only. One patient was excluded from main analysis in the intervention group because HTN* was not verified in their chart. Two patients were excluded from the analysis in the comparison group because blood pressure was not recorded at visit 1 (n=1) and hypertension was not verified in their chart (n=1).
Adverse Event None One patient felt less involved
and less knowledgeable in their treatment after portal use.
None
Quality Rating Fair Good Good
REFERENCES:
1. National center for health statistics: Emergency department. CDC: Centers for Disease Control and Prevention Web site.
https://www.cdc.gov/nchs/fastats/emergency-department.htm. Updated 2017. Accessed 1/21/2017, 2017.
2. Gordon NP, hornbrook MC. differences in access to and preferences for using patient portals and other eHealth technologies based on race, ethnicity, and age: A database and survey study of seniors in a large health plan. eysenbach G, ed. journal of medical internet research. 2016;18(3):e50. doi:10.2196/jmir.5105. .
3. Wexler R, Hefner JL, Sieck C, et al. Connecting emergency department patients to primary care. The Journal of the American Board of Family Medicine. 2015;28(6):722-732. doi: 10.3122/jabfm.2015.06.150044.
4. DeVries A, Li CH, Oza M. Strategies to reduce nonurgent emergency department use:
Experience of a northern virginia employer group. Med Care. 2013;51(3):224-230. doi: 10.1097/ MLR.0b013e3182726b83 [doi].
5. Gill JM. Nonurgent use of the emergency department: Appropriate or not? Ann Emerg Med. 1994;24(5):953-957. doi: A59556 [pii].
6. Ku BS, Fields JM, Santana A, Wasserman D, Borman L, Scott KC. The urban homeless: Super-users of the emergency department. Popul Health Manag. 2014;17(6):366-371. doi: