Pulse
Research Report
May 2014
Sydney CBD Office
Conversions: Manhattan – a
template for Sydney?
Conversion of office space to residential uses is an emerging theme across Australia’s CBD markets. The Sydney CBD market is a prominent participant in this trend. Support drivers are:
Historically low residential mortgage rates
A long term undersupply of dwellings in the Sydney Metropolitan area
Rising office market vacancy and declining effective rents, particularly in secondary grade buildings
Rising levels of offshore interest in the Sydney residential market on both the supply side (as developers) and the demand side (as investors). The sharp rise in inner-city education and social infrastructure facilities in Manhattan may provide a template for the future trends in the Sydney CBD.
The economic backdrop
Below trend GDP growth and a rising unemployment rate saw the RBA lower the cash rate by 0.25bps to a record low of 2.5% in August 2013.The record low interest rates and home mortgage rates that emerged during 2013 have stimulated a rise in demand for residential properties nationally, but particularly in NSW. Across Greater Sydney large developers are competing for prime residential sites. The city has experienced a residential
undersupply, with the past five financial years seeing completed dwellings total only 79,500, against an estimated underlying demand of 122,900. JLL Research estimates that an additional 43,400 dwellings were required to put the demand and supply into
balance for the Greater Sydney1. An expected pick up in supply
over FY2014-FY2015 should help reduce this net shortfall in housing stock and help bring the market into balance.
Deloitte Access Economics forecasts that residential construction activity will rise by 12.6% during the year in NSW. The Sydney market is particularly attractive to developers and investors because mortgages tend to be higher than other cities, so demand is more sensitive to lower interest rates, the market is in long-term under-supply and as an international gateway city, Sydney is attractive and familiar to many foreign investors and developers.
The Q1/2014 NAB Residential Property Survey revealed that foreign investors currently account for 14% of all new property demand, and 10% of the established property market demand, with particular demand for dwellings in the Sydney CBD and inner city markets. In the 2013 financial year, the Foreign Investment Review Board (FIRB) approved $17.16 billion of investments into the residential market, with 62.9% of this attributed to new developments. This compares with $19.7 billion in 2012. The FIRB also recorded that $5.73 billion of this total were for ‘off the plan’ investments, with foreign parties seeking to sell ‘off the plan’ apartments in the Asia Pacific region.
The scarcity of prime institutional grade stock available for investment in the Sydney CBD office market, and softening investor demand for secondary office stock, has seen yield spreads between prime and secondary grade stock widen. Currently JLL Research estimates this spread to be 100 basis points compared to a ten-year average of 95 basis points. The reduction in the relative value of secondary grade office stock is encouraging developers and investors acquire secondary grade office assets with the potential for conversion or redevelopment into residential use. Supporting the rise in development activity, 2013 saw strong interest in inner city and CBD apartments, particularly from Asia.
1
JLL, Research: The positive signs of Sydney’s residential market upturn – February 2014
National Trends
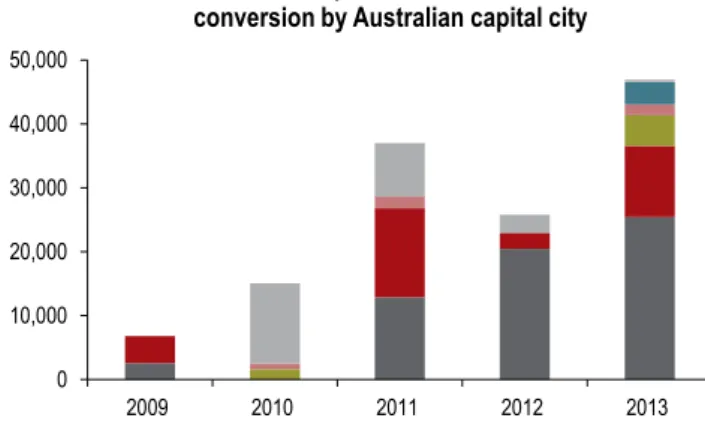
JLL Research estimates that nationally, 46,940 sqm of office property was withdrawn for residential development in 2013 – up from 25,794 the year prior. Much of this increase has been driven by activity from Asian developers. Over the past five years, there has been a rise in conversion of office space into residential uses, particularly in Sydney. The chart below includes withdrawals across the CBD and suburban office markets that JLL monitors.
Source: JLL Research 0 10,000 20,000 30,000 40,000 50,000 2009 2010 2011 2012 2013
Quantum of office space withdrawn for residential conversion by Australian capital city
Sydney Melbourne Brisbane Adelaide Perth Canberra
Table 1: Sydney CBD Activity – CBD office conversions
Address Precinct Office GFA Residential GFA Units Stage Owner Origin
19-31 Pitt Street Core 7,000 sqm 4,607 sqm 19 DA Approved Australia
Quay Quarter, 2-10 Loftus & 9-17
Young Street Core 15,731sqm 11,271 sqm DA Submitted Australia
Goldfields House, 1 Alfred Street Core 24,097 sqm 40,341 sqm 197 DA Approved US 60%
Netherlands 40% Coca Cola Amatil Building, 71 – 79
Macquarie Street Core 9,918 sqm 12,819 sqm DA Approved Australia
Hudson House,127-131 Macquarie
Street Core 12,168 sqm 12,168 sqm 12 DA Approved N/A - Strata
161-165 Clarence Street & 304 Kent
Street Western Corridor 5,408 sqm 15,902 sqm 220 DA Approved Australia
60 – 68 Bathurst Street/ 286 Sussex
Street Western Corridor 5,200 sqm 16,126 sqm 180 Proposed China
333 Kent Street Western Corridor 10,055 sqm 16,698 sqm 175 DA Submitted Australia
Australian Consolidated Press building,
50 – 58 Park Street Mid-town 17,870 sqm 26,741 sqm 284 Proposed Australia
The Castlereagh,141-149 Bathurst
Street & 209 Castlereagh Street Mid-town 1,418 sqm 4,957 sqm 54 DA Approved China
York & George, 379-385 George Street
& 38-48 York Street Mid-town 10,178 sqm 15,207 sqm 199 DA Approved Australia
Greenland Centre (Sydney Water
Site), 115-119 Bathurst Street Mid-town 5,000 sqm 66,720 sqm 595 DA Approved (Stg 1) China
110-118 Bathurst Street & 203
Castlereagh Street Mid-town 1,079 sqm 19,544 sqm DA Approved (Stg 1) Australian
Eliza, 141-143 Elizabeth Street Mid-town 1,600 sqm - 19 Completed Australia
227 Elizabeth Street Mid-town 17,052 sqm 22,570 sqm 140 DA Submitted Singapore
168-190 Day Street Mid-town 1,385 sqm - 127 DA Submitted Australia
Ausgrid building, 570 George Street Mid-town 21,930 sqm - 200 Proposed Singapore
JLL Research anticipates the upwards trend will continue into 2014-15, with more buildings already sold with Development Approval to turn them into residential towers across the CBD and Inner City locations.
Since Q1/2013, seven office buildings have been sold in the Sydney CBD with residential conversion the intended use, with a potential unit yield of 1,950 apartments and a total sale value of AUD 667.3 million. These include 227 Elizabeth Street and 570 George Street purchased by Singapore’s Far East Organisation; the Sydney Water Site on the corner of Bathurst Street and Pitt Street, bought by Greenland Group; and 286 Sussex Street by Ausbao Pty Ltd.In addition to this, five office buildings in the CBD were withdrawn over the course of 2013 for residential conversion (14,000sqm). With ID Consulting projecting a 116% increase in the population living in the CBD by 2036, the highest and best use of a selection of the secondary office stock is residential. This creates the potential for future withdrawals in the CBD market over the next three years. If all conversions listed in Table 1 go ahead, a total of 179,583 sqm or 3.61% of total Sydney CBD office stock will have been withdrawn for conversion to residential. This rise in office conversions is set to see the Mid-town precinct become the most active residential development market in terms of converted apartments and residential floor space (Table 1).
Offshore Investment
Although foreign investor levels remain relatively high in
comparison to recent years, the 2013 FIRB investment figures ’for development’ have gradually declined from 2011. Meanwhile the proposed foreign investment in ‘developed’ residential real estate has continued to grow. As a whole, foreign approved proposals to invest in residential real estate is up on quantity but down on value, with the FIRB reporting a 19% yearly increase in the number of residential investments (from 9,768 to 11,668), whilst the value of investments decreased by 13%, from $19.7 billion to $17.2 billion over the 2013 financial year. This increase in volume but decline in value is reflective of the increase in the number of offshore buyers of end product nationally.According to the Australian FIRB rules, foreign non-residents or short term visa holders (e.g. on student visas) can invest in Australian real estate only if that investment adds to the housing stock. This generally occurs by acquiring new dwellings, off-the-plan properties under construction or yet-to-be-built or vacant land for development. With the high rise residential trend spreading through both international and domestic developers in all CBD precincts, and the standard bank variable interest rate expected to remain at or around historically low levels through 2014 and 2015, residential investors are expected to remain active through 2014.
However, the question is: is this a long-term trend or is the current level of activity in Sydney vulnerable to a rise in interest rates?
The residential future of the
CBD
An increasing level of high density living in the Sydney CBD and inner city suburbs is bound to be accompanied by an increasing number of families with children moving into and staying in the CBD and inner city. With id Consulting forecasting a 53% population growth in the City of Sydney between FY2014 and FY2036, there is a growing need for increased education and health care infrastructure that will cater for all cohorts of the growing population.
Social infrastructure demands
The population anticipated from the high density residential developments in the City of Sydney will drive a number of changes in the area with part of the City’s community strategic plan ‘Sustainable Sydney 2030’ aiming to ensure ‘every resident will be within walking distance to most local services including fresh food, childcare, health services and leisure, social, learning and cultural infrastructure’.2
The City of Sydney’s residents aged 0-17 is expected to increase 80.6% by 2036. As a result, there is particular focus on the City’s educational infrastructure.
The continuous growth in the population residing in the CBD will correspond with a higher cost of living meaning that parents will need to work and will require Early Childhood Education and Care (ECEC). Therefore, the ECEC sector will require substantial expansion to cater for the expected population as it currently proves to be a critical issue for the City of Sydney. The City has been exposed to a considerable level of public enquiry on the future options for ECEC, which has led to a comprehensive study on the supply and demand. As at July 2013, there were 4,502 center-based ECEC places available across 87 centers, and 195 family day care places. CBD localities saw 90% of spaces utilised by workers, whilst areas outside the CBD have 40% of space utilised by workers. Overall the current shortfall of ECEC places is 3,104, and is projected to rise to 5,976 places by 2031 unless a substantial level supply is forthcoming, which will require a combined effort from the private and public sector.
2
Currently, primary and secondary schools located in the City of Sydney cater for approximately 16,700 students from K-12. Of these students 78.8% reside in the City of Sydney with the remaining 21.2% coming from other areas. By 2036, the City of Sydney’s schooling population (5-17years) will grow by 81.9% (to 15,330). If the current trend in local school attendance for the City of Sydney’s schooling population continues, the future population will indefinitely exceed the current educational capabilities of the area, forcing families to send their children on a daily commute to school.
The CBD alone caters for 2,200 students from K-12, but with a potential increase of 1,950 residential units from converted office space, and an additional 700 units being constructed in
Barangaroo, demand will outstrip supply in the 5-17 age bracket, raising the possibility of a similar trend to that occurring in Manhattan, where primary and secondary educational facilities are moving into high rise buildings in the CBD.
Manhattan – a template for Sydney?
The 2008 economic recession resulted in a significant increase in Manhattan office vacancy rates, which opened the door for tenants outside of the Financial, Insurance, Real Estate, and Professional Services sectors, that historically dominate
the Manhattan office market. The increase in vacancy rates combined with the decrease in effective rents appealed to the education sector tenants in particular, while the population in the under-14 age category doubled, in line with an almost doubling in the number of residential units to more than 27,800, in Lower Manhattan between 2000 and 2010.
Between 2005 and 2012, the education sector’s position in the Lower Manhattan market increased by 47% with major leases signed for schools ranging from primary to tertiary education. Avenues: The World School, catering for pre-kindergarten to year 12 students now resides in a 10 storey building after taking up 22,300 sqm at 259 Tenth Avenue in 2010. Similarly, Leman Manhattan Preparatory School which also caters for pre-kindergarten to year 12 students, took up 19,000 sqm at 25 Broadway in 2009.
The growth in Manhattan’s residential population and the increased enrollment at educational institutions has fueled the growth of the educational sector in the existing office market. With high vacancy rates, an ageing office stock, and a growing residential population, is Sydney set to follow the Manhattan trend?
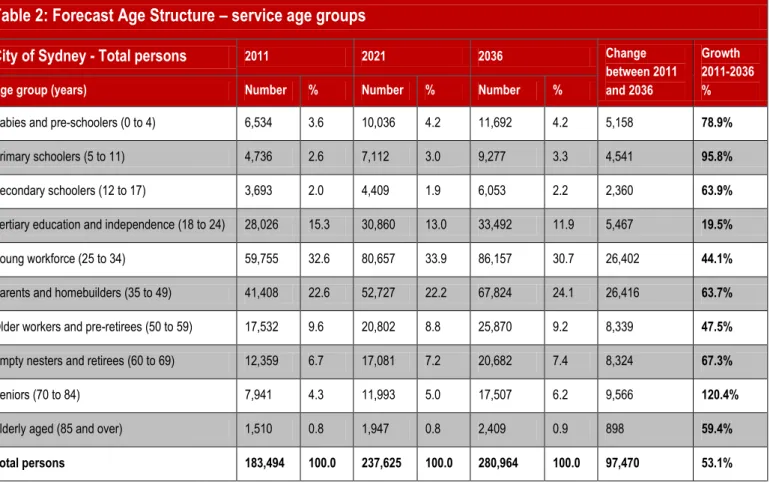
Table 2: Forecast Age Structure – service age groups
City of Sydney - Total persons 2011 2021 2036 Change between 2011 and 2036
Growth 2011-2036 %
Age group (years) Number % Number % Number %
Babies and pre-schoolers (0 to 4) 6,534 3.6 10,036 4.2 11,692 4.2 5,158 78.9%
Primary schoolers (5 to 11) 4,736 2.6 7,112 3.0 9,277 3.3 4,541 95.8%
Secondary schoolers (12 to 17) 3,693 2.0 4,409 1.9 6,053 2.2 2,360 63.9%
Tertiary education and independence (18 to 24) 28,026 15.3 30,860 13.0 33,492 11.9 5,467 19.5%
Young workforce (25 to 34) 59,755 32.6 80,657 33.9 86,157 30.7 26,402 44.1%
Parents and homebuilders (35 to 49) 41,408 22.6 52,727 22.2 67,824 24.1 26,416 63.7%
Older workers and pre-retirees (50 to 59) 17,532 9.6 20,802 8.8 25,870 9.2 8,339 47.5%
Empty nesters and retirees (60 to 69) 12,359 6.7 17,081 7.2 20,682 7.4 8,324 67.3%
Seniors (70 to 84) 7,941 4.3 11,993 5.0 17,507 6.2 9,566 120.4%
Elderly aged (85 and over) 1,510 0.8 1,947 0.8 2,409 0.9 898 59.4%
Total persons 183,494 100.0 237,625 100.0 280,964 100.0 97,470 53.1%
For more information, please contact: Alison Spiteri
Analyst, Market Research Research and Consulting JLL
tel: +61 2 9220 8753 [email protected]
www.jll.com.au
Rupa Ganguli
Director, Strategic Research Research and Consulting JLL
tel: +61 2 9220 8496 [email protected]
Jones Lang LaSalle offices Adelaide
Level 22, Grenfell Centre 25 Grenfell Street Adelaide SA 5000 tel +61 8 8233 8888
Melbourne
Level 21, Bourke Place 600 Bourke Street Melbourne VIC 3000 tel +61 3 9672 6666
Brisbane
Level 33, Central Plaza One 345 Queen Street
Brisbane QLD 4000 tel +61 7 3231 1311
North Sydney
Level 27, North Point 100 Miller Street North Sydney NSW 2060 tel +61 2 9936 5888
Canberra
Level 7, 121 Marcus Clarke Street Canberra, ACT, 2601
tel +61 2 6274 9888
Parramatta
Level 8, 79 George Street Parramatta NSW 2150 tel +61 2 9806 2800
Glen Waverley
Building 2
540 Springvale Road Glen Waverley VIC 3150 tel +61 3 9565 6666
Perth
Level 29, Central Park 152-158 St George’s Terrace Perth WA 6000
tel +61 8 9322 5111
Mascot
Level 3, Sydney Airport Centre 15 Bourke Road
Mascot, NSW, 2020 tel +61 2 9693 9800
Sydney
Level 25, 420 George Street Sydney NSW 2000
tel +61 2 9220 8500
www.jll.com.au