20
THE INFLUENCE OF THE DENSITY
OF
THE
NATURAL
REGENERATION
OF
THE SEEDLINGS OF HUNGARIAN (QUERCUS FRAINETTO) AND
TURKEY OAK (QUERCUS CERRIS) ON THE INDIVIDUAL CHANGES OF
TREES FOLLOWING THE WOODLAND STAGE
BERCEA IULIAN1 NICULESCU MARIANA2
1Faculty of Agriculture and Horticulture, University of Craiova, [email protected]
2Faculty of Agriculture and Horticulture, University of Craiova, [email protected]
Key words: Hungarian oak, Turkey oak, seedlings, thickness,competition
ABSTRACT
The woodland stage in the mixed stands of Hungarian and Turkey oak triggers ecosystem processes on account of the passage from the individual growth stage to gregarious growth. Interspecific and intraspecific competition due to density and competition for resources leads to a level of self-regulating of the ecosystem that makes each tree to behave according to the global strategy of the stand to ensure maximum stability. In the context of the current climatic changes, the Turkey oak has been affected more than the Hungarian oak, which has taken advantage of the well-known frequency rate (2-5 years), managing to install through higher natural regeneration rates. The proportioning of the mixed stands can be achieved through forestry works. For these reasons, research on the behaviour of the Hungarian oak and the changes at different growth stages is needed. Knowledge about the changes of each individual tree leads to the management of works in space and time in order to protect them in the competition with the Turkey oak.
INTRODUCTION
The need to maintain the Hungarian oak in theGetic Plateau has become a serious concern in forestry. The ecological value of the Hungarian oak is given by its ability to optimallyexploit the areas with heavy compact soils and with a very high content of clay, to which we add the economic value of the Hungarian oak. The physiological decline of the Hungarian oak was highlighted by the decrease of the natural regeneration capacity caused by high frequency rates and/or lack fructification (Bercea, 2008, 2013). In this context, the current climatic changes, in-depth research on the evolution of the Hungarian oaksamplesfollowing the woodland stage is required, not only in terms of the changes caused by the gregarious state, but also regarding its relations with the Turkey oak samples, with a view to protecting the Hungarian oak through forestry works. Our research aims to highlight the changes undergone by the Hungarian oak in the state of thickness of naturally regenerated mixed seedlings, as well as the scientific grounding of the methods to facilitate them.
MATERIALS AND RESEARCH METHODS
The research was conducted in sample areas plantedin 1998, located in phytoclimatic average conditions for the Hungarian and Turkey oak trees in the
widespread forests in the western part of the Getic Plateau,at Simian, Strehaia, Filiaşi,
21
or wilting trees were filled with already existing seedlings of the 1994 low fructification of Hungarian and Turkey oak trees, contributing to the establishment of young stands following the regeneration cutsof the last two decades. Research on the natural regeneration of the seedlings was carried out in the permanent sample areas, and the outcomes were published in journals or presented at conferences (Bercea, 2005, 2007, 2008, 2013); furthermore, research focused on the evolution of the Hungarian and Turkey oak trees during the growth and development stages.
Measurements and observations were carried out in the former open group cuts during the regeneration process by applying progressive cutting to two 2-metre wide samples, one tothe south and the otherto the east-west. The results of the measurements and observations were recorded in tables for each species and for the whole stand. Tables were processed using Excel, and plotted using the same software.
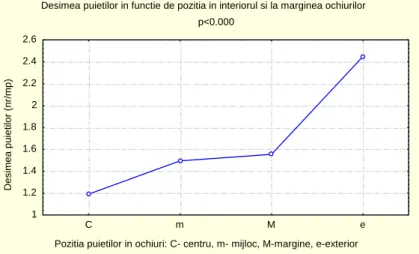
The density of the seedlings, expressed as the number of seedlings/m2 , is
influenced by the area in which they were planted.
The lowest density of seedlings was recorded in the centre (C), followed by a steady increase in the number of seedlings in the middle (m) and peripheralarea (P). Starting from the peripheralarea to the outer area (o) under the woodland, the density of the seedling increases sharply due to the larger number of fully grown trees able to bear fruit and due tothe microclimatic conditions allowing for the planting and growing of seedlings in this area (Fig. 1)
Fig. 1 Density of seedlings according to the position in the group cut (Bercea, 2007)
The high density of seedlings springing out in 2004, in the outer area of the group cuts, was steady all over the years over which measurements were made.
The result of variance analysis on the density of the Hungarian and Turkey oak seedling, depending on the area of the group cut, is indicated as significant (p), highly significant (***), and is explained by the negative effect of heat and light the central (C) and middle (m) areas during summertime (Bercea, 2007).
The continued research in 2012 and 2013 emphasized the natural elimination process characteristic of young trees (Bercea, 2013).
Research was further carried out in the same woodland in 2013 şi 2014 in order to identify and determine the natural trees pruning in the former regeneration group cuts, in compliance with the trial markets to the north-south and east-west. The height of the specimens and the prunned stem were measured for the two species.
Desimea puietilor in functie de pozitia in interiorul si la marginea ochiurilor p<0.000
Pozitia puietilor in ochiuri: C- centru, m- mijloc, M-margine, e-exterior
Des
im
ea
puiet
ilor
(
nr
/m
p)
1 1.2 1.4 1.6 1.8 2 2.2 2.4 2.6
22
RESEARCH FINDINGS AND INTERPRETATION
The intensity of natural pruning was shown by measurements of the length of the bottom of the stems whose branches were wiltering, were wiltered already or had fallen off the stem. The measurement results were centralized in a table and presented graphically using Excel.
As indicated by mainstream literature, the natural trees pruning is performed at a certain density of the stand, which in young seedlings is indicated by the number of
individual trees per area unit (m2). Admittedly, the graphical presentation of the height of
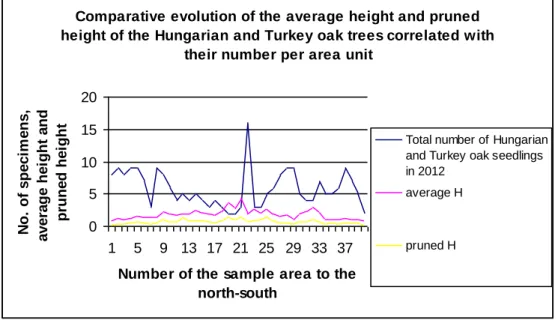
the specimens and the relatedpruned arrais presented in correlation with the density of the young stands (Fig. 2).
Comparative evolution of the average height and pruned height of the Hungarian and Turkey oak trees correlated with
their number per area unit
0 5 10 15 20
1 5 9 13 17 21 25 29 33 37
Number of the sample area to the north-south
N
o.
of
s
pe
c
im
e
ns
,
a
v
e
ra
ge
he
igh
t
a
nd
prun
e
d
he
igh
t
Total number of Hungarian and Turkey oak seedlings in 2012
average H
pruned H
Fig. 2. Distribution of Hungarian and Turkey oak trees, of average and pruned height to the north-south
Figure 2 indicates the following:
- in the peripheral and outer areas of the former regeneration group cuts, the number of of Hungarian and Turkey oak specimens, from north to south, is still large even after six years from the last cut - connection;
- in the middle area, the number is smaller, with one exception;
- the average height of Hungarian and Turkey oak specimens increases from the outer and peripheral areas to the centre of the former group cuts;
- the height of the specimens increases steadily from the outer and peripheral areas to the centre of the former group cuts, which confirms the bell shape and sinuous longitudinal profile of the stand, as described in the literature in the case of progressive cutting;
- the pruned height of Hungarian and Turkey oak specimens increases from the outer and peripheral areas to the centre of the former group cuts, following a curve similar to that of the average height;
- the pruned height is directly proportional to the height of Hungarian and Turkey oak specimens;
- the pruned height of Hungarian and Turkey oak specimens in the thicket, saplings and poles stages is directly influenced by their density;
- in the stage of thicket and saplings of the Hungarian and Turkey oak seedlings, their density influences the natural elimination of weaker specimens;
23
Comparative evolution of the average height and the pruned height of the Hungarian and
Turkey oak trees correlated with the total number per area unit to the north-south
0 1 2 3 4 5 6 7 8 9 10
1 5 9 13 17 21 25 29 33 37
Number of the sample area
T
o
ta
l
n
u
m
b
e
r
o
f
s
p
e
c
im
e
n
s
,
a
v
e
ra
g
e
h
e
ig
h
t
a
n
d
p
ru
n
e
d
h
e
ig
h
t
Density of Hungarian and Turkey oak seedlings average H of Hungarian oak trees
pruned H of
Hungarian oak trees
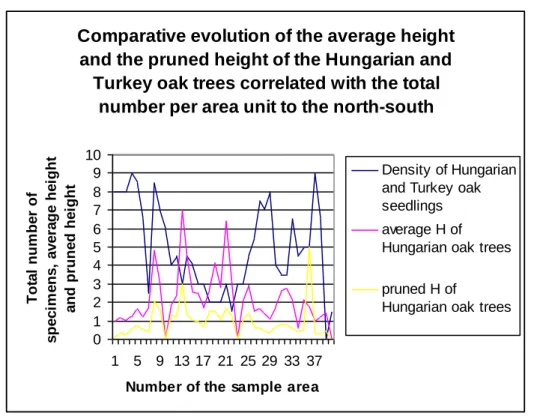
Fig. 3. Comparative evolution of the average height and the pruned height of the Hungarian and Turkey oak trees correlated with the total number per area unit to the north-south
By analyzing diagram 3, we notice the following:
- in the peripheral and outer areas of the former regeneration group cuts, the number of Hungarian and Turkey oak specimens, from north to south, is still large even after six years from the last cut - connection;
- in the middle area, the number of specimens is smaller;
- the average height of the Hungarian oak trees increases from the peripheral and outer areas to the central area of the former regeneration group cuts;
- the average height of the Hungarian oak trees is inversely proportional to the density of Hungarian and Turkey oak trees at thicket, saplings and poles stages;
- the pruned height of Hungarian oak trees increases from the peripheral and outer areas to the central area of the former regeneration group cuts, following a curve similar to that of the average height;
- - the pruned height is directly proportional to the height of Hungarian oak trees;
- the pruned height of Hungarian oak trees, at thicket and poles stages is directly influenced by the density of stands;
- at thicket and saplings stages, the Hungarian and Turkey oak trees density influences the natural elimination of weaker specimens;
24
Comparative evolution of the average height and pruned height of the Turkey oak trees correlated with the total number of Hungarian
and Turkey oak trees to the north-south
0 2 4 6 8 10
1 5 9 13 17 21 25 29 33 37
Number of the sample area
T
o
ta
l
n
u
m
b
e
r
o
f
s
p
e
c
im
e
n
s
,
a
v
e
ra
g
e
h
e
ig
h
t
a
n
d
p
ru
n
e
d
h
e
ig
h
t
Density of Hungarian and Turkey oak seedlings
average H of Turkey oak trees
pruned H of Turkey oak trees
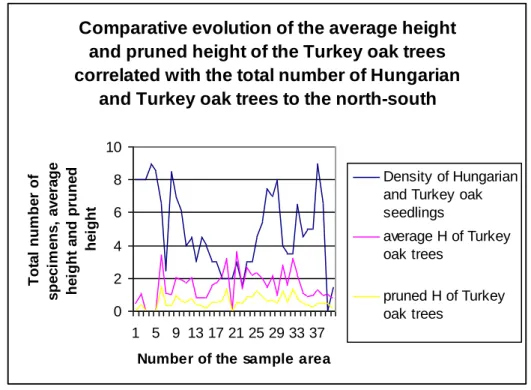
Fig. 4. Comparative evolution of the average height and pruned height of the Turkey oak trees correlated with the total number of Hungarian and Turkey oak trees tot the north-south
The analysis of diagram 4 reveals the following:
- the average height of Turkey oak specimens increases from the peripheral and outer areas of the former regeneration group cuts to the centre, except the sample area with no Turkey oak trees;
- the average height of the Turkey oak trees is inversely proportional to the density of the seedlings;
- the pruned height of Turkey oak trees increases from the peripheral and outer areas to the central area of the former regeneration group cuts, following a curve similar to that of the average height;
- the pruned height is directly proportional to the height of Turkey oak trees;
- the pruned height of Turkey oak trees, at thicket, saplings and poles stages is directly influenced by the density of stands;
- the increase in height of Turkey oak trees simultaneously determines their differentiation and natural pruning.
Diagram 5 shows that:
- in the eastern outer and peripheral areas, the number of Hungarian and Turkey oak specimens is smaller in comparison to the western outer and peripheral areas, which is explained by controlling factors - the temperature and humidity of the group cuts;
- in the western outer and peripheral areas, the number of specimens is large, directly proportional to the positive influence of temperature and humidity during the Hungarian and Turkey oak seeds dissemination process;
25
Comparative evolution of the average height and the pruned height of the Hungarian and Turkey oak trees
correlated with their number per area unit
0 2 4 6 8 10
1 4 7 10 13 16 19 22 25
Number of the sample area to the east-west
N
u
m
b
e
r
o
f
s
p
e
c
im
e
n
s
,
a
v
e
ra
g
e
h
e
ig
h
t
a
n
d
p
ru
n
e
d
h
e
ig
h
t
Total number of Hungarian and Turkey oak seedlings in 2012
average H
pruned H
Fig. 5. Distribution of the number, average height and pruned height of the Hungarian and Turkey oak trees to the east-west
- the average height of the Hungarian and Turkey oak specimens decreases from the eastern peripheral and outer areas of the former regeneration group cuts to the centre, western peripheral and outer areas;
- the pruned height of the Hungarian and Turkey oak specimens decreases from the eastern peripheral and outer areas of the former regeneration group cuts to the centre, western peripheral and outer areas, following a curve similar to that of the average height; - the pruned height to the east-west is directly proportional to the height of Hungarian and Turkey oak trees;
- the pruned height of Hungarian and Turkey oak trees, at thicket, saplings and poles stages, is directly influenced by the density of stands;
- at thicket, poles and saplings stages, the Hungarian and Turkey oak seedlings, their density to the east-west influences the natural elimination of dominated specimens.
The analysis of diagram 6 reveals the following:
- the average height of Hungarian oak specimens decreases from the eastern peripheral and outer areas of the former regeneration group cuts to the centre, and increases in the western outer area;
- the pruned height of the Hungarian oak trees is directly proportional to the average height of the seedlings;
- the pruned height of Hungarian oak trees, at thicket, saplings and poles stages, to the east-west, is directly influenced by the density of stands;
26
Comparative evolution of the average height and pruned height of the Hungarian oak trees correlated with the total number of Hungarian
and oak trees per area unit to the E-W
0 2 4 6 8 10
1 5 9 13 17 21 25
Number of the sample area
T o ta l n u m b e r o f s p e c im e n s , a v e ra g e h e ig h t a n d p ru n e d h e ig h t o f H u n g a ri a n o a k t re e s
Density of Hungarian and Turkey oak trees average H of
Hungarian oak trees pruned H of
Hungarian oak trees
Fig. 6. Comparative evolution of the average height and pruned height of the Hungarian oak trees correlated with the total number of Hungarian and oak trees per area unit to the E-W
Comparative evolution of the average height and pruned height of the Turkey oak trees correlated with the total number of Hungarian and oak trees per area
unit to the E-W
0 2 4 6 8 10
1 4 7 10 13 16 19 22 25
Number of the sample area
T o ta l n u m b e r o f s p e c im e n s , a v e ra g e h e ig h t a n d p ru n e d h e ig h t o f T u rk e y o a k tr e e s Density of Hungarian and Turkey oak trees average H of Turkey oak trees
pruned H of Turkey oak trees
Fig.7. Comparative evolution of the average height and pruned height of the Turkey oak trees correlated with the total number of Hungarian and oak trees per area unit to the east-west
Diagram 7 shows that:
- the average height of the Turkey oak trees is uniform, except the eastern peripheral area, with Turkey oak seedlings, and the western outer area, where it decreases slighthly;
27
CONCLUSIONS
The research findings as reflected in the diagrams above and also deriving from the field trips lead to the folllowing conclusions:
- the Hungarian and Turkey oak seedlings resulting from progressive cuttings show a sinuous profile and lower heights in the peripheral and outer areas of the former group cuts;
- the height of the specimens increases steadily from the peripheral and outer areas to the centre of the former group cuts;
- the average height of the Hungarian oak trees is inversely proportional to the density of the Hungarian and Turkey oak specimens at the thicket, saplings and poles stages;
- the pruned height of the Hungarian and Turkey oak seedlings increases from the peripheral and outer areas of the former group cuts to the centre, following a curve similar to that of the average height;
- the pruned height of the Hungarian and Turkey oak specimens is directly proportional to their height;
- the pruned height of the Hungarian and Turkey oak specimens, at the thicket, saplings and poles stages, is directly influenced by their density;
- the height of the Hungarian and Turkey oak specimens is higher in the eastern peripheral and outer areas of the former group cuts due to the small number of seedlings, in turn, resulting from the higher temperature and lower humidity during the dissemination period;
- the young Hungarian oak specimens display higher heights and pruned heights in comparison with the Turkey oak trees;
- the enhancement of the Hungarian oak trees can be done through the maintenance of the current density, which will trigger the natural elimination of a number of Turkey oak trees, or through the removal of some Turkey oak trees.
BIBLIOGRAPHY
1. Bercea, I., 2007.Cercetări privind regenerarea arboretelor de gârniţă şi cer din partea vestică a Podişului Getic (Research on the Regeneration of the Hungarian and Turkey Oak Seedlings in the Western Part of the Getic Plateau). Doctoral
Thesis. “Transilvania” University of Braşov.
2. Bercea, I.,Cojoacă, F.D., 2013: Structural changes of mixed seedlings of
Hungarian oak (Quercus frainetto) and Turkey oak ( Quercus cerris) trees following
the woodland stage. In Annals of the University of Craiova - Agriculture,
Montanology, Cadastre Series, Vol. XLIII, pp. 47 -53.
3. Bercea Iulian, Mariana Niculescu, 2013: Evolution of thickness of mixed hungarian (Quercus frainetto) and turkey oak (Quercus cerris) trees following the woodland stage ,http://agronomie.administrativ.ucv.ro/aamc/index.php/aamc
4. Mariana Niculescu et. al. 2012: Pteridium aquilinum (l.) Kuhn. – colonising species
in the South-Western of Romania, Annals of the University of Craiova, Agriculture,
Montanology, Cadastre series,
http://old.agro-craiova.ro/index.php/aamc/article/view/748
5. Florescu, I.I., 2004. Silvicultură (Forestry). Arad: "Vasile Goldiş" University Press. 6. Mariana Niculescu, Iulian Bercea, Gerald Matei, Silvestru Ilie Nuta, Ion Iovu,
Stefan Aurelian Ciupitu, Calin Salceanu, 2009: Researches about Quercus cerris forests situated in the North-East of Dolj county, Annals of the University of Craiova,
Agriculture, Montanology, Cadastre series,
http://old.agro-craiova.ro/index.php/aamc/article/view/322/300