M. V. Simkin V. P. Roychowdhury
Department of Electrical Engineering,
University of California, Los Angeles, CA 90095-1594
We report a method for estimating what percentage of people who cited a paper had actually read it. The method is based on a stochastic modeling of the citation process that explains empirical studies of misprint distri-butions in citations (which we show follows a Zipf law). Our estimate is that only about 20% of citers read the original.
Many psychological tests have the so-called “lie-scale.” A small but sufficient number of questions that admit only one true answer, such as: “Do youalwaysreply to letters immediately after reading them?” are inserted among others that are central to the particular test. A wrong reply for such a question adds a point on the lie-scale, and when the lie-score is high, the over-all test results are discarded as unreliable. Perhaps, for a scientist the best candidate for such a lie-scale is the question: “Do you read all of the papers that you cite?”
Comparative studies of the popularity of scientific papers has been a subject of much recent interest [1–8], but the scope has been limited to citation distribution analysis. We have discovered a method of estimat-ing what percentage of people who cited the paper had actuallyreadit. Remarkably, this can be achieved without any testing of the scientists, but solely on the basis of the information available in the ISI citation database.
Freud [9] had discovered that the application of his technique of psy-choanalysis to slips in speech and writing could reveal a lot of hidden information about human psychology. Similarly, we find that the appli-cation of statistical analysis to misprints in scientific citations can give an insight into the process of scientific writing. As in the freudian case, the truth revealed is embarrassing. For example, an interesting statistic revealed in our study is that a lot of misprints are identical. Consider, for example, a four-digit page number with one digit misprinted. There can be 104such misprints. The probability of repeating someone else’s
misprint accidentally is 10!4. There should be almost no repeat
mis-prints by coincidence. One concludes that repeat mismis-prints are due to copying someone else’s reference, without reading the paper in question. In principle, one can argue that an author might copy a citation from an unreliable reference list, but still read the paper. A modest
1 10 100
1 10 100
rank
fr
e
q
u
e
n
cy
Figure 1. Rank–frequency distribution of misprints referencing a paper, which had acquired 4300 citations. There are 196 misprints total, out of which 45 are distinct. The most popular misprint propagated 78 times. A good fit to Zipf’s law is evident.
reflection would convince one that this is relatively rare, and cannot apply to the majority. Surely, in the pre-internet era it took almost equal effort to copy a reference as to type in one’s own based on the original, thus providing little incentive to copy if someone has indeed read, or at the very least has procured access to the original. Moreover, if someone accesses the original by tracing it from the reference list of a paper with a misprint, then with a high likelihood, the misprint has been identified and will not be propagated. In the past decade with the advent of the Internet, the ease with which would-be nonreaders can copy from unreliable sources; as well as would-be readers that can access the original, has become equally convenient. But there is no increased incentive for those who read the original to also make verbatim copies, especially from unreliable resources.1 In the rest of this paper, giving
the benefit of doubt to potential nonreaders, we adopt a much more generous view of a “reader” of a cited paper as someone who at the very least consulted a trusted source (e.g., the original paper or heavily-used and authenticated databases) in putting together the citation list.
As misprints in citations are not too frequent, only celebrated papers provide enough statistics to work with. Figure 1 shows a distribution of misprints in citations to one such paper [10] in the rank–frequency representation, introduced by Zipf [11]. The most popular misprint in
1According to many researchers the Internet may end up even aggravating the copying problem: more users are copying second-hand material without verifying or referring to the original sources.
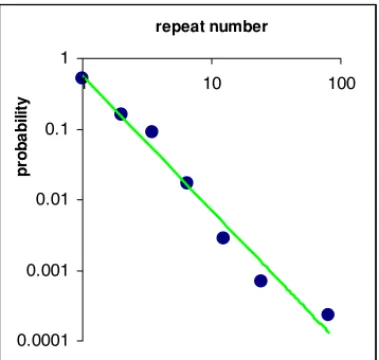
0.0001 0.001 0.01 0.1 1
1 10 100
repeat number
p
ro
ba
b
ili
ty
Figure 2.Same data as in Figure 1, but in the number–frequency representation. Misprints follow a power-law distribution with exponent close to 2.
a page number propagated 78 times. Figure 2 shows the same data, but in a number–frequency format.
As a preliminary attempt, one can estimate an upper bound on the ratio of the number of readers to the number of citersRas the ratio of the number of distinct misprintsDto the total number of misprintsT. Clearly, amongTciters,T!Dcopied, because they repeated someone else’s misprint. For the D others, with the information at hand, we have no evidence that they did not read, so according to the presumed innocent principle, we assume that they did. Then in our sample, we haveDreaders andTciters, which lead to:
R# D
T. (1)
Substituting D $ 45 andT $ 196 in equation (1), we obtain that
R#0.23. This estimate would be correct if the people who introduced original misprints had always read the original paper. However, given the low value of the upper bound onR, it is obvious that many original misprints were introduced while copying references. Therefore, a more careful analysis is neccessary. We need a model to accomplish it.
Our model for misprints propagation, which was stimulated by Si-mon’s explanation of the Zipf law [12] and the idea of link redirection by Krapivsky and Redner [4] is as follows. Each new citer finds the reference to the original in any of the papers that already cite it. With probabilityRhe reads the original. With probability 1!Rhe copies the citation from the paper he found it in. In any case, with probabilityM
The evolution of the misprint distribution (hereNKdenotes the num-ber of misprints that propagatedKtimes, andNis the total number of citations) is described by the following rate equations:
dN1
dN $M!(1!R)%(1!M)% N1
N , dNK
dN $(1!R)%(1!M)%
(K!1)%NK!1!K%NK
N (K>1). (2)
These equations can be easily solved using methods developed in [4] to get:
NK& 1
KΓ( Γ $1)
1
(1!R)%(1!M). (3) As the exponent of the number–frequency distributionΓis related to the exponent of the rank–frequency distributionΑby a relationΓ $1)(1/Α), equation (3) implies that:
Α $(1!R)%(1!M). (4)
The rate equation for the total number of misprints is:
dT
dN $M)(1!R)%(1!M)% T
N. (5)
The stationary solution of equation (5) is:
T$N% M
R)M!MR. (6)
The expectation value for the number of distinct misprints is obviously
D$N%M. (7)
From equations (6) and (7) we obtain:
R$D T %
N!T
N!D. (8)
SubstitutingD$45,T$96, andN$4300 in equation (8), we obtain
R # 0.22, which is very close to the initial estimate obtained using equation (1). This low value ofR is consistent with the “Principle of Least Effort” [11].
One can ask: Why did we not choose to extractRusing equations (3) or (4)? This is because Αand Γare not very sensitive toRwhen it is small. In contrast,Tscales as 1/R.
We can slightly modify our model and assume that original misprints are only introduced when the reference is derived from the original paper, while those who copy references do not introduce new misprints (e.g., they cut-and-paste). In this case one can show that T $N%M
andD$N%M%R. As a consequence, equation (1) becomes exact (in terms of expectation values, of course).
The preceding analysis assumes that the stationary state had been reached. Is this reasonable? Equation (5) can be rewritten as:
d!T N"
M!!T
N"%(R)M!M%R)
$dlnN. (9)
As long asMis small it is natural to assume that the first citation was correct. Then the initial condition isN$1;T$0. Equation (9) can be solved to get:
T$N% M
R)M!M%R%#1!
1
NR)M!M%R$. (10)
This should be solved numerically forR. For our guinea pig, equa-tion (10) givesR$0.17.
Just as a cautionary note, equation (10) can be rewritten as:
T D $
1
x%#1!
1
NX$( x$R)M!M%R. (11)
The definition of the natural logarithm is: lna$lim
x+0 ax!1
x .
Comparing this with equation (11) we see that whenRis small (Mis obviously always small):
T
D #lnN. (12)
This means that a na¨ıve analysis using equations (1) or (8) can lead to an erroneous belief that more cited papers are less read.
One can augment our results with a closer scrutiny of the data. In order to make sure that misprints have not been introduced by the ISI as it sometimes happens [13], we explicitly verified a dozen misprinted citations in the original articles. All of them were exactly as in the ISI database. There are also occasional repeat identical misprints in papers, which share individuals in their author lists. Such events constitute a minority of repeat misprints. It is not obvious what to do with such cases when the author lists are not identical: Should the set of citations be counted as a single occurrence (under the premise that the common co-author is the only source of the misprint); or as multiple repetitions? However, even if we count all such repetitions as only a single misprint occurrence, then the number of citation-copiers (i.e.,T!D) shall drop from 151 to 112, bringing the upper bound forR(equation (1)) from 23% up to 29%. However a more detailed analysis via our model
[14] will bring down the estimate closer to 20%, keeping the original conclusions unaltered.
We conclude that misprints in scientific citations should not be dis-carded as a mere happenstance, but, similar to Freudian slips, analyzed.
Acknowledgments
We are grateful to J. M. Kosterlitz, A. V. Melechko, N. Sarshar, H. Muir, and many others for correspondence.
References
[1] Z. K. Silagadze, “Citations and the Zipf–Mandelbrot Law,” Complex Systems,11(1997) 487–499; http://arxiv.org/abs/physics/9901035. [2] S. Redner,European Physics Journal B,4(1998) 131–134;
http://arxiv.org/abs/cond-mat/9804163.
[3] C. Tsallis, and M. P. de Albuquerque,European Physics Journal B,13
(2000) 777–780; http://arxiv.org/abs/cond-mat/9903433.
[4] P. L. Krapivsky and S. Redner,Physical Review E,63 (2001) Art. No. 066123; http://arxiv.org/abs/cond-mat/0011094.
[5] H. Jeong, Z. Neda, and A.-L. Barabasi, http://arxiv.org/abs/cond-mat/0104131.
[6] A. Vazquez, http://arxiv.org/abs/cond-mat/0105031. [7] H. M. Gupta, J. R. Campanha, and B. A. Ferrari,
http://arxiv.org/abs/cond-mat/0112049. [8] S. Lehmann, B. Lautrup, and A. D. Jackson,
http://arxiv.org/abs/physics/0211010.
[9] S. Freud,Zur Psychopathologie des Alltagslebens(Internationaler psycho-analytischer Verlag, Leipzig, 1920).
[10] Our guinea pig is the Kosterlitz–Thouless paper (J. M. Kosterlitz and D. J. Thouless,Journal of Physics C,6(1973) 1181–1203). The misprint distribution for a dozen other studied papers look very similar.
[11] G. K. Zipf,Human Behavior and the Principle of Least Effort: An Intro-duction to Human Ecology, (Addison-Wesley, Cambridge, MA, 1949). [12] H. A. Simon,Models of Man(Wiley, New York, 1957).
[13] A. Smith,New Library World,84(1983) 198.