Tuberculosis detection and the challenges of
integrated care in rural China: A
cross-sectional standardized patient study
Sean Sylvia1, Hao Xue2, Chengchao Zhou3*, Yaojiang Shi2, Hongmei Yi4, Huan Zhou5, Scott Rozelle6, Madhukar Pai7, Jishnu Das8
1 Department of Health Policy and Management, Gillings School of Global Public Health, University of North
Carolina at Chapel Hill, Chapel Hill, North Carolina, United States of America, 2 Center for Experimental Economics in Education, Shaanxi Normal University, Xi’an, China, 3 Institute of Social Medicine and Health Administration, School of Public Health, Shandong University, Jinan, China, 4 School of Advanced Agricultural Sciences, Peking University, Beijing, China, 5 Department of Health and Social Behavior, West China School of Public Health, Sichuan University, Chengdu, China, 6 Freeman Spogli Institute for International Studies, Stanford University, Stanford, California, United States of America, 7 McGill International TB Centre & Department of Epidemiology, Biostatistics and Occupational Health, McGill University, Montreal, Canada, 8 Development Research Group, The World Bank, Washington, D.C., United States of America
Abstract
Background
Despite recent reductions in prevalence, China still faces a substantial tuberculosis (TB) burden, with future progress dependent on the ability of rural providers to appropriately detect and refer TB patients for further care. This study (a) provides a baseline assessment of the ability of rural providers to correctly manage presumptive TB cases; (b) measures the gap between provider knowledge and practice and; (c) evaluates how ongoing reforms of China’s health system—characterized by a movement toward “integrated care” and promo-tion of initial contact with grassroots providers—will affect the care of TB patients.
Methods/Findings
Unannounced standardized patients (SPs) presenting with classic pulmonary TB symptoms were deployed in 3 provinces of China in July 2015. The SPs successfully completed 274 interactions across all 3 tiers of China’s rural health system, interacting with providers in 46 village clinics, 207 township health centers, and 21 county hospitals. Interactions between providers and standardized patients were assessed against international and national stan-dards of TB care. Using a lenient definition of correct management as at least a referral, chest X-ray or sputum test, 41% (111 of 274) SPs were correctly managed. Although there were no cases of empirical anti-TB treatment, antibiotics unrelated to the treatment of TB were prescribed in 168 of 274 interactions or 61.3% (95% CI: 55%–67%). Correct manage-ment proportions significantly higher at county hospitals compared to township health cen-ters (OR 0.06, 95% CI: 0.01–0.25, p<0.001) and village clinics (OR 0.02, 95% CI: 0.0–0.17, p<0.001). Correct management in tests of knowledge administered to the same 274 a1111111111 a1111111111 a1111111111 a1111111111 a1111111111 OPEN ACCESS
Citation: Sylvia S, Xue H, Zhou C, Shi Y, Yi H, Zhou H, et al. (2017) Tuberculosis detection and the challenges of integrated care in rural China: A cross-sectional standardized patient study. PLoS Med 14(10): e1002405.https://doi.org/10.1371/ journal.pmed.1002405
Academic Editor: Carlton Evans, Universidad Peruana Cayetano Heredia, PERU
Received: April 26, 2017
Accepted: September 8, 2017
Published: October 17, 2017
Copyright:©2017 Sylvia et al. This is an open access article distributed under the terms of the Creative Commons Attribution License, which permits unrestricted use, distribution, and reproduction in any medium, provided the original author and source are credited.
Data Availability Statement: All replication files are available from the Harvard Dataverse:http://dx. doi.org/10.7910/DVN/HGWK6S.
physicians for the same case was 45 percentage points (95% CI: 37%–53%) higher with 24 percentage points (95% CI:−33% to−15%) fewer antibiotic prescriptions. Relative to the current system, where patients can choose to bypass any level of care, simulations suggest that a system of managed referral with gatekeeping at the level of village clinics would reduce proportions of correct management from 41% to 16%, while gatekeeping at the level of the township hospital would retain correct management close to current levels at 37%. The main limitations of the study are 2-fold. First, we evaluate the management of a one-time new patient presenting with presumptive TB, which may not reflect how providers man-age repeat patients or more complicated TB presentations. Second, simulations under alter-nate policies require behavioral and statistical assumptions that should be addressed in future applications of this method.
Conclusions
There were significant quality deficits among village clinics and township health centers in the management of a classic case of presumptive TB, with higher proportions of correct case management in county hospitals. Poor clinical performance does not arise only from a lack of knowledge, a phenomenon known as the “know-do” gap. Given significant deficits in quality of care, reforms encouraging first contact with lower tiers of the health system can improve efficiency only with concomitant improvements in appropriate management of pre-sumptive TB patients in village clinics and township health centers.
Author summary
Why was this study done?
• Despite remarkable progress against the disease in recent decades, China still faces a sig-nificant tuberculosis (TB) burden, particularly in poor rural areas where patients have been shown to face significant delays in diagnosis compared to urban areas.
• Existing evidence on the quality of TB care in China is based on surveys of individuals ultimately registered with specialized TB clinics; these may not be representative of the quality of TB care provided in rural China, both due to potential poor recall among patients and the fact that surveyed individuals have all been successfully diagnosed with TB.
• There is little to no direct, objective evidence on how presumptive TB patients are man-aged in China’s rural health system or on factors related to the quality of care that patients receive.
• Recent reforms of China’s health system—in particular a move toward policies encour-aging first contact with lower-tier providers—may have important implications for TB patients, yet no prospective studies have examined these potential effects.
(Grant Number: BS2012SF010). JD additionally acknowledges funding from the Knowledge for Change program at The World Bank (Grant Number: 7172469). The funders had no role in study design, data collection and analysis, decision to publish, or preparation of the manuscript.
Competing interests: MP serves as a consultant to the Bill & Melinda Gates Foundation (BMGF), which had no involvement in this study or manuscript. MP also serves on the Editorial Boards of PLOS
Medicine & PLOS ONE.
What did the researchers do and find?
• This study uses unannounced standardized patients (SPs) in a random sample of pro-viders to provide the first direct evidence on the ability of propro-viders at each of the 3 tiers of China’s rural health system to correctly manage patients presenting with symptoms of presumptive TB.
• Assessed against lenient international and national standards of TB care, 41% SPs were correctly managed overall with significantly lower rates of correct management in vil-lage and township facilities compared to county hospitals.
• In clinical vignettes designed to test knowledge and matching cases presented by SPs, the same village and township clinicians correctly managed cases of presumptive TB more than twice as often.
• Simulations of alternative “managed referral” policies at the health system level show that when patients are free to select the tier at which they first seek care, presumptive TB patients are correctly managed 41% of the time, but this rate would (a) fall substantially if patients need to first seek care in village clinics and (b) would stay approximately the same with managed referrals from the township level.
What do these findings mean?
• There are significant deficits in the management of presumptive TB patients among vil-lage clinics and township health centers in rural areas.
• Policy attention should first focus on quality improvement among grassroots providers before moving forward with reforms to encourage first contact at lower tiers of the health system.
• Conceptual training alone is unlikely to engender this improvement, as knowledge among village and township level providers, though low in absolute terms, is already high relative to clinical practice.
Introduction
Case detection in China’s rural areas already depends critically on the diagnostic ability of providers in village clinics (VCs) and township health centers (THCs), which are the bottom 2 tiers in the rural health system and the first contact for most rural TB patients [2]. Moving for-ward, the reliance on the lower tiers of the health system is only projected to increase as China moves towards an “integrated care” model that promotes initial contact with village and town-ship providers and could potentially increase their gatekeeping role within the system [4,5]. Given the importance of the lower tiers in addressing rural TB, it is therefore surprising that, despite considerable speculation and some data on structural measures of quality, we currently have no information on how presumptive TB patients are diagnosed and treated when they visit grassroots primary care providers [4,6].
Our study therefore has 3 aims. First, we assessed the ability of primary care providers in VCs, THCs, and county hospitals to correctly diagnose and manage a presumptive TB patient. In order to do so, we evaluated the treatment that standardized patients (SPs) received against international and national benchmarks for correct diagnosis and management. We defined correct management as referral to an upper level provider, recommendation for a chest X-ray (CXR), or recommendation for sputum testing. SPs—people recruited from the local commu-nity and extensively trained to present the same condition to multiple providers—are often regarded as the “gold standard” for measurement of clinical practice and have recently been validated in a similar setting for TB [7]. SPs have been shown to be less subject to bias than approaches relying on recall-based patient surveys and chart abstraction [7]. Moreover, SPs enable comparisons across providers because cases are predetermined with the same standard-ized presentation for all providers.
Second, we assessed the same providers in their knowledge of correct procedures through clinical vignettes. Comparing vignette results with those from SPs allows us to identify the gap between provider knowledge and practice [7,8] and therefore whether low levels of provider knowledge are a major constraint on the quality of TB detection and care.
The third aim was to develop a method that could better integrate quality of care at dif-ferent levels of the health system with the care-seeking behavior of households. Taking into account the 3-tiered VC-THC-County Hospital system in China, we evaluated TB manage-ment at the system level accounting for provider referrals and performance at different tiers of the healthcare system. For instance, among patients who first visited the VC, the system would have correctly managed the patient either through (a) correct management at the VC or (b) referral from the VC to the THC and correct management at the THC or (c) referral from the VC to the THC to the county hospital and correct management at the county hospital. Failure to either refer or correctly manage the patient at any point in the chain would have resulted in diagnostic failure.
Methods
Ethical approval
Approvals from the institutional review boards of Stanford University, USA (protocol number: 25904) and Sichuan University, China (protocol number: K2015025) were obtained. Informed consent was obtained verbally from all providers participating in the study. To prevent influ-ence on the study, both IRBs approved a procedure whereby providers consented to SP visits “at some point in the next six months.” Consent from village and township providers was obtained as part of the facility survey approximately 5 weeks before SP visits. Consent for county providers was obtained through communications with providers. All individuals who participated as SPs were trained to protect themselves from any invasive tests or procedures.
Setting and study design
China’s rural health system is comprised of 3 tiers of providers: VCs, THCs, and county hospi-tals. Under existing guidelines [11], VCs and THCs are responsible for referring suspected TB patients to higher-level providers (at the county level and above) for further diagnosis and care, although patients are free to choose among any of the 3 tiers for primary care without referral. Prior to 2011, suspected TB patients were to be referred from the regular health sys-tem to separate county-level facilities under the CCDC that diagnosed and treated TB patients following the Directly Observed Therapy, short course (DOTs) strategy [11]. Since then, how-ever, these functions have been shifted to county-level hospitals within the regular health system.
With this shift of ultimate responsibility for diagnosis and treatment from the CCDC sys-tem to the regular health syssys-tem, further success of TB control in China will likely become tied to the quality of care and success of several ongoing reforms in the health system. For instance, since the early 2000s, China has dramatically expanded coverage under public health insurance schemes, which is now close to universal in rural areas. Available evidence suggests that expan-ding coverage increased utilization, but did not reduce out-of-pocket expenses [12]. In 2009, the government then announced a series of reforms to address issues related to perceived inef-ficiency and fragmentation in the health system, including “perverse” physician incentives tied to drug sales and overcrowding at upper levels [4,5]. While implementation varies widely across health systems, these reforms are aimed at strengthening primary care and moving toward an integrated care model that encourages initial contact with village and township level providers. Although, as of March 2017, the specific design of these policies and the balance between gatekeeping by primary care providers versus patient choice still remains under con-sideration, encouraging initial contact with lower-tier providers could be consequential for progress against TB if the performance of these providers acts as a barrier to proper diagnosis and/or referral of TB patients.
Selection of facilities, data collection, and study size
The results presented here are part of a larger cross-sectional study on quality of care in rural China. The sample for this study was drawn from rural areas in 3 provinces: Sichuan, Shaanxi, and Anhui, which are located in western, central, and eastern China, respectively. These 3 provinces have an overall prevalence of TB (urban and rural combined) on par with the national average (around 60 to 70 per 100,000 in Sichuan, 57 in Shaanxi, and 62 in Anhui) [13].
prefectures (10 in Shaanxi, 21 in Sichuan, and 16 in Anhui). The prefectures included in the study from each province were chosen for having a predominantly rural population in consul-tation with local authorities.
The sample was then selected to be representative of rural health systems (triplets, or refer-ral chains, of village, township, and county-level health facilities) in each of the 3 chosen pre-fectures. We used the following procedure to sample health systems. First, across the 3 prefectures, we randomly sampled 21 of 24 rural counties and included the primary county-level hospital in each sampled county. Next, 10 THCs were randomly sampled within each county. Because even counties designated as “rural” have an urban township housing the county seat, we excluded the health center of the urban township. One county only had 9 rural townships, yielding a sample of 209 of the total 311 THCs in the 21 sample counties. Finally, we randomly selected one VC associated with each sampled THC for a total of 209 VCs. Out of the 209 originally-sampled villages, 22% had no VC and were replaced with a randomly-chosen backup. The health systems represented by this sample serve a population of 12.23 mil-lion people [14].
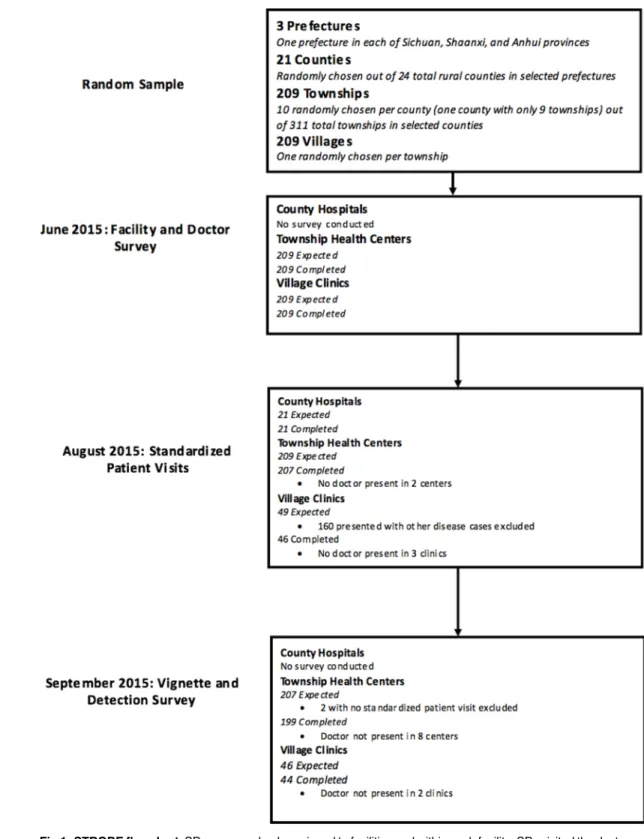
We conducted 3 separate waves of data collection (Fig 1). An initial facility and doctor sur-vey was conducted for village and township level providers (but not county hospitals) in June 2015. Actual SP visits started 5 weeks after the initial facility survey in August 2015. SPs pre-senting symptoms of TB visited doctors in all sampled county hospitals and THCs. At the vil-lage level, however, SPs presenting with TB were only sent to a random subset of 49 VCs. This was because the larger study included SPs presenting other disease conditions and sending more than 1 SP to VCs would have significantly increased the risk that SPs would be identified as fake patients. Therefore, our sample contains 49 complete health systems (triplets of village, township, and county level providers) and 209 township and county level duplets.
Finally, we conducted a follow-up survey with village and township providers in early Sep-tember 2015. In this survey, we asked providers whether they had detected any SPs and admin-istered vignettes.S1 Textdiscusses the details of sample selection, assignment of SPs to providers, administration of surveys and vignettes and drug identification.
SPs. The SP case used in this study was adapted to the Chinese context from an earlier
val-idation study in India in collaboration with TB experts from the China TB-CDC [7]. In this presumptive TB case, the SP presents with a “cough that is not getting better, and a fever.” Upon appropriate questioning by the provider, the SP reveals symptoms consistent with a clas-sic case of presumed TB including a cough duration of 2–3 weeks, fever with night sweats, and loss of appetite and weight. Twenty-one SPs (10 male, 11 female) were recruited from local areas and intensively trained over a 2-week period to consistently present the case to providers in the sample.
Following the interaction, SPs purchased all medications prescribed and paid providers their usual fee. After each visit, SPs were debriefed using a structured questionnaire and SP responses were confirmed against a recording of the interaction taken using a concealed recording device.S1 Textprovides further details and a link to the SP case script (in Mandarin with an English translation).
Clinical vignettes. In September 2015, we tested the sampled village and township
Fig 1. STROBE flowchart. SPs were randomly assigned to facilities and within each facility, SPs visited the doctor
following the normal procedures for any walk-in patient. Given a choice of which doctor to visit, SPs randomly chose a doctor following a pre-determined randomization protocol. In county hospitals, where patients can choose doctors by specialty, SPs visited generalists. Our results, therefore, are designed to approach the care a walk-in patient would receive at each of the sampled facilities.
difference between what providers know to do and what they do in practice is referred to as the “know-do gap.”
Supplementary household survey data on patient sorting. Part of our analysis requires
information on how individuals select into the tiers of the rural health system given the symp-toms described in the SP script. We obtained this information by including questions in a nationally-representative survey of rural households conducted in April 2016. Specifically, we asked a sample of 2,022 heads of households about healthcare-seeking behavior given a cough and fever lasting for 2 weeks. We asked both hypothetical and retrospective versions of these questions. Details on this survey are inS1 Text.
Outcomes
Whether the case was correctly managed and evaluated was assessed in comparison to national standards for TB Care in China and the International Standards for TB Care, 3rd Edition [15–
17]. We consider “Correct Management” to be referral (either verbal or written) to an upper level health system provider or CCDC facility, recommendation for a CXR, or recommenda-tion for further sputum testing for TB (i.e., smear microscopy, PCR, culture). This is a lenient definition of correct management for 2 reasons. First, unnecessary and/or harmful medicines are not penalized—a stricter definition would exclude from correct management those cases where additional (unnecessary or even harmful) medicines were given, reducing the propor-tion of correct management by a significant margin. However, we report the use of (unneces-sary) antibiotics, fluoroquinolones, and steroids. Antimicrobial resistance is a severe public health concern in China [18–20] while fluoroquinolones tend to mask underlying TB and ste-roids to aggravate latent or subclinical TB [21]. Second, the definition is particularly lenient at the level of the county hospitals, since a CXR is classified as correct management in our scheme, while such hospitals can be reasonably expected to move beyond CXR screening to order confirmatory microbiological sputum tests.
In addition to whether SPs were correctly managed, we also assess the providers’ adherence to a prespecified checklist of recommended questions and examinations. We also indicate a short list of “essential” items according to experts from the China TB-CDC. Further details on these study outcomes are inS1 Text.
Statistical analysis
We calculate the proportion or mean and 95% CI by facility level (village, township, and county) for correct case management and its individual components (referral, CXR, or sputum test) as well as for the use of antibiotics, fluoroquinolones, and steroids and the number and percent of checklist items completed.
To assess the difference in case management between different provider tiers and SP and vignette interactions, we used Ordinary Least Squares (OLS) regressions for continuous depen-dent variables and logistic regressions for binary dependepen-dent variables with indicator variables for each county as additional controls. We also used logistic regressions to assess associations between VC and THC provider characteristics and case management outcomes, controlling for county and SP dummy variables. We report these results as odds ratios with accompanying 95% CI.
Note that the systems-level outcome will be incorrect if there is a failure at any point in the referral chain.
We simulate system-level results under 3 alternative “managed referral” policies which vary in how the initial provider visited in the system is selected. First, we assume that patients are free to select their initial provider (the status quo). Here, we use probabilities that patients select providers at each level from the nationally-representative rural household survey. We then present 2 sets of results, assuming patients start at the village level (i.e., there is gatekeep-ing from the village level) and assumgatekeep-ing patients start at the township level (i.e., there is gate-keeping from the township level).
For each of these 3 “managed referral” policies (status quo, village-level gatekeeping, and township-level gatekeeping), we simulate system-level results assuming that referrals to higher tiers in the health system happen in 1 of 2 ways. First, we assume that if SPs are referred by a provider, patients are assumed to go to the next level above the referring provider. Specifically, if an SP was referred by a village provider, the assessment progresses to the township provider above that village. If a township provider refers the SP, assessment progresses to the county hospital above that THC. Second, we simulate system-level results assuming that, upon refer-ral, the assessment progresses to the provider that the SP was referred to. If a village provider refers the SP directly to the county hospital, the township is skipped and assessment progresses directly to the county. If patients are referred to the CCDC or above the county, we count the case as correctly managed.
Our primary system level results use data from the random subsample of 49 “complete” health systems. Results using all 209 health systems—but imputing referral rates for VCs in remaining systems without VC observations using average rates from observed VCs—are shown inS6 Table.
All analyses were done using Stata 14 (Stata Corporation, College Station, TX). A descrip-tion of the timing of analysis decisions included inS1 TextandS1 STROBE Checklistprovides the completed STROBE checklist.
Results
Basic description of facilities
Similar to previous findings in the literature [22], facility surveys confirmed the increasing qualifications of staff and better infrastructure at higher levels of care (S1 Table). For instance, although all providers are certified, no village providers had a “practicing physician” certificate, which is the highest of 3 levels above “assistant practicing physician” and “rural physician” cer-tifications, compared to 61% of township providers. Similarly, 9% of village doctors had at least an upper secondary degree compared to 60% of township doctors. Finally, no VCs had ray machines or the ability to conduct smear microscopy. In contrast, 89% of THCs had an X-ray machine, although only 56% had staff able to operate an X-X-ray machine, and only 2% could conduct smear microscopy. Although not directly measured, county hospitals generally have X-ray machines as well as the ability to conduct smear microscopy [23]. County-level doctors tend to have higher education and certification levels than those in THCs.
SP sample completion rates
physician descriptions matched the SP in 6 interactions (3%, 95% CI 1%–5%). As no provider voiced suspicion during the interaction, these detections may have occurred because SPs did not return with test results that had been requested and will not affect the interpretation of the data presented here.
Management of SPs
On average, interactions between SPs and providers were brief, lasting 11 mins on average, though patient loads in village and THCs were low (Table 1). Overall, 111 of 274 SPs (41%, 95% CI 35%–46%) were correctly managed across all tiers of the health system (Table 1). Where interactions were correctly managed, this was either because the provider referred the patient or suggested radiological testing; microbiological testing was infrequently used (10 of 274 cases). Though not considered incorrect in our lenient definition of correct management, doctors frequently prescribed broad-spectrum antibiotics unrelated to the treatment of TB (168 of 274 interactions). The most commonly prescribed antibiotics were Macrolides, Penicil-lins, and Cephlasporins. Notably, quinolone and steroid use was low. TB drugs are controlled in China, and there were no cases where anti-TB treatment was initiated for an SP.
Case management improved at higher levels of the health system, with SPs correctly man-aged in 19 of 21 (90%, 95% CI 71%–97%) interactions with doctors in county hospitals com-pared to 79 of 207 (38%, 95% CI 32%–45%) interactions with THC doctors and 13 of 46 (28%, 95% CI 17%–43%) interactions with village doctors (Table 1andFig 2). The proportion of cor-rectly managed interactions was significantly higher in county hospitals than in VCs (OR 0.02, 95% CI: 0.0–0.17,p<0.001) and THCs (OR 0.06, 95% CI: 0.01–0.25,p<0.001), primarily due to the greater use of chest radiography. If county hospitals were held to a higher standard of requiring sputum TB testing of the SPs, only 5% would have met that standard. Similarly, the use of non-TB antibiotics was significantly lower in county hospitals (county versus village: p= 0.003; county versus township:p= 0.001), although it was above 60% in both VCs and THCs. Finally, while negligible in VCs and county hospitals, 17 (8%, 95% CI 5%–13%) THC doctors prescribed fluoroquinolones and 14 (7%, 95% CI 4%–11%) prescribed steroids.
Table 1andFig 2also report adherence to a prespecified checklist of recommended ques-tions and examinaques-tions. Completion rates for each checklist item are shown inS2 Table.S1 Figshows patient outcomes by diagnosis for each health system tier.
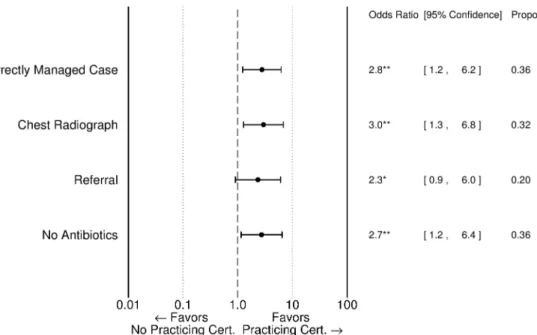
In part, quality variation by level of care reflects differences in the characteristics of provid-ers.Fig 3andS3 Tableshow that providers at the village and township levels with a practicing physician certificate were significantly more likely to correctly manage TB cases than those with lower qualifications; more likely to request a CXR; more likely to refer patients to upper levels; and less likely to prescribe antibiotics. Correct management, request of chest radio-graphs, and prescription of antibiotics were also highly associated with whether facilities had professional staff on site able to operate X-ray machines. We find that the correct management of SPs in THCs with X-ray equipment and staff was 18 percentage points higher (53 of 115 with equipment and staff compared to 26 of 92 without).
Knowledge versus practice deficits—The “know-do” gap
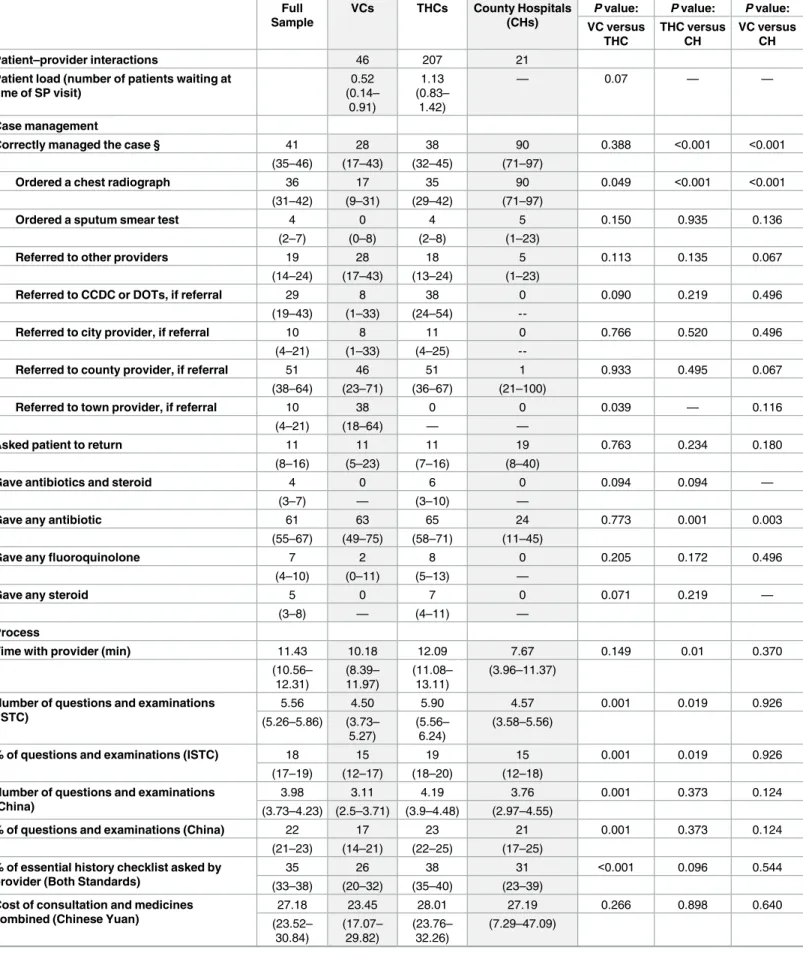
Table 1. Main outcomes of interactions with SPs.
Full Sample
VCs THCs County Hospitals
(CHs)
P value: P value: P value:
VC versus THC THC versus CH VC versus CH
Patient–provider interactions 46 207 21
Patient load (number of patients waiting at time of SP visit)
0.52 (0.14– 0.91) 1.13 (0.83– 1.42)
— 0.07 — —
Case management
Correctly managed the case § 41 28 38 90 0.388 <0.001 <0.001
(35–46) (17–43) (32–45) (71–97)
Ordered a chest radiograph 36 17 35 90 0.049 <0.001 <0.001
(31–42) (9–31) (29–42) (71–97)
Ordered a sputum smear test 4 0 4 5 0.150 0.935 0.136
(2–7) (0–8) (2–8) (1–23)
Referred to other providers 19 28 18 5 0.113 0.135 0.067
(14–24) (17–43) (13–24) (1–23)
Referred to CCDC or DOTs, if referral 29 8 38 0 0.090 0.219 0.496
(19–43) (1–33) (24–54)
--Referred to city provider, if referral 10 8 11 0 0.766 0.520 0.496
(4–21) (1–33) (4–25)
--Referred to county provider, if referral 51 46 51 1 0.933 0.495 0.067
(38–64) (23–71) (36–67) (21–100)
Referred to town provider, if referral 10 38 0 0 0.039 — 0.116
(4–21) (18–64) — —
Asked patient to return 11 11 11 19 0.763 0.234 0.180
(8–16) (5–23) (7–16) (8–40)
Gave antibiotics and steroid 4 0 6 0 0.094 0.094 —
(3–7) — (3–10) —
Gave any antibiotic 61 63 65 24 0.773 0.001 0.003
(55–67) (49–75) (58–71) (11–45)
Gave any fluoroquinolone 7 2 8 0 0.205 0.172 0.496
(4–10) (0–11) (5–13) —
Gave any steroid 5 0 7 0 0.071 0.219 —
(3–8) — (4–11) —
Process
Time with provider (min) 11.43 10.18 12.09 7.67 0.149 0.01 0.370
(10.56– 12.31) (8.39– 11.97) (11.08– 13.11) (3.96–11.37)
Number of questions and examinations (ISTC)
5.56 4.50 5.90 4.57 0.001 0.019 0.926
(5.26–5.86) (3.73– 5.27)
(5.56– 6.24)
(3.58–5.56)
% of questions and examinations (ISTC) 18 15 19 15 0.001 0.019 0.926
(17–19) (12–17) (18–20) (12–18)
Number of questions and examinations (China)
3.98 3.11 4.19 3.76 0.001 0.373 0.124
(3.73–4.23) (2.5–3.71) (3.9–4.48) (2.97–4.55)
% of questions and examinations (China) 22 17 23 21 0.001 0.373 0.124
(21–23) (14–21) (22–25) (17–25)
% of essential history checklist asked by provider (Both Standards)
35 26 38 31 <0.001 0.096 0.544
(33–38) (20–32) (35–40) (23–39)
Cost of consultation and medicines combined (Chinese Yuan)
27.18 23.45 28.01 27.19 0.266 0.898 0.640
Table 1. (Continued)
Full Sample
VCs THCs County Hospitals
(CHs)
P value: P value: P value:
VC versus THC
THC versus CH
VC versus CH
Cost of consultation and medicines combined (US dollars)*
4.18 3.61 4.31 4.18 0.266 0.898 0.640
(3.62–4.74) (2.63– 4.59)
(3.66– 4.96)
(1.12–7.24)
Diagnosis
Mentioned TB 15 04 15 29 0.071 0.112 0.008
(11–19) (1–15) (11–21) (14–50)
CCDC, Chinese Center for Disease Control and Prevention; CH, county hopsitals; DOTs, Directly Observed Therapy, short course; ISTC, international standards for tuberculosis care; SP, standardized patient; TB, tuberculosis; THC, township health center; VC, village clinic
Data are % (95% CI) unless otherwise noted. *$1 = CNY6.5.
§Correctly managed for Tuberculosis is defined as a chest radiograph, sputum test, or referral. "ISTC" is ISTC standard and "China" is China national standard.
https://doi.org/10.1371/journal.pmed.1002405.t001
Fig 2. Main outcomes of interactions with SPs. Presaging our simulation results, in the 13 of 46 cases (28%,
95% CI 17%–43%) when village providers (verbally) referred SPs, 5 of 13 (38%, 95% CI 18%–64%) referred to the THC and 6 of 13 (46%, 95% CI 23%–71%) referred directly to the county. Of the 36 (18%, 95% CI 13%– 24%) township providers who referred SPs to an upper level provider, a small majority referred to the county hospital (18 of 36; 51%, 95% CI 36%–67%), and the rest referred directly to the CCDC (14 of 36; 39%, 95% CI 25%–55%) or a city level provider (4 of 36; 11%, 95% CI 4%–25%). CXR, chest X-ray; ISTC, international standards for tuberculosis care; SP, standardized patient; THC, township health center.
Simulations of managed referral policies
In the household survey, 97% of respondents indicated that they would see a doctor if a family member had a cough and fever lasting for 2 weeks (S5 Table). Of these, 46% indicated that they would first visit their VC, 31% indicated they would first visit their THC, and 23% indi-cated they would directly visit a county or higher-level hospital. These percentages are consis-tent with responses of the 16% of households with a member who actually experienced these symptoms in 2015 (S5 Table, Panel B).
We use these responses together with our results on case management at each level of the health system to generate “system level quality” under the status quo (patients freely selecting into tiers) and different managed referral policies.Fig 5shows what happens under the status quo. In this case, 46% of patients would visit the VC. We know from our SP results that 28% of these cases (13% of all patients) would be referred and, of those referred, 38% (5% of all patients) would be referred to the THC and remainder to county or higher. In the subsample of full systems, of 31% of patients choosing to first visit the THC, 29% (9% of all patients) of patients would be referred to the county level or above. Finally, 24% would go directly to the county. This “cascade” of care allows us to compute the rate of correct management at the sys-tem level.
Under the status quo, we estimate that 34% (95% CI 27%–41%) of cases (where patients visit a provider) would be correctly managed at the system level if referrals were only allowed to progress to the next tier (Table 2). Instead, if we follow the actual referrals, which often bypassed the next tier, the correct management rate increases to 40% (95% CI 34%–47%). Therefore, referral behavior appears to account for deficits in the care at different tiers of the health system.
S2 Figsimulates different managed referral policies with results summarized inTable 2. One possibility is that gatekeeping occurs at the level of the VC. In such a case, patients would Fig 3. Correlation between provider certification and SP outcomes among village and township providers.
Odds ratios are adjusted for additional facility and doctor characteristics using regressions reported inS4 Table. A “Practicing Physician” certification is the highest of 3 certification levels above “Assistant Practicing Physician” and “Rural Physician” certifications. “Proportion” refers to the proportion in the full sample of village and township providers.*p<0.10,**p<0.05,***p<0.01. SP, standardized patient.
be required to obtain a referral from the VC. We simulate that under this policy only 4% (95% CI 1%–15%) of cases would be correctly managed if referrals were only allowed to the next highest tier and would be 16% (95% CI 7%–30%) if the patterns of referrals allowed for bypass-ing and followed the same pattern we observe in our data. A second alternative is that gate-keeping is at the level of the THC. In this case, simulations of managed referrals from the township produce results on par with the status quo.
S6 Tableshows simulation results using all 209 health systems, but imputing referral rates for VCs in remaining systems without VC observations using average rates from observed VCs.S7 Tableshows simulated out-of-pocket costs for each scenario presented above; however, it should be noted that these estimates do not fully account for patient costs (such as indirect costs incurred by patients to travel to higher-tier facilities) that are likely important determinants of relative cost-effectiveness of the different managed referral policies.
Fig 4. Know-do gap: Comparison of data from vignettes versus SP interaction among the same providers. For all
items, the prefix "E" indicates examinations and laboratory evaluations; the prefix "Q" indicates history questions. The gap calculation is the result of a t test comparing the average vignette performance with the average SP performance. P values are in brackets. AFB, acid-fast bacillus; SP, standardized patient; TB, tuberculosis.
Discussion
Our study uses SPs to evaluate the management of TB among healthcare providers in China. We find that rates of correct management are low among village and township level providers in rural areas. Given that most rural patients with TB symptoms initially see providers at these levels, our results suggest that deficits in performance can contribute significantly to delayed detection of TB in China. The poor quality of care that we found for TB is consistent with pre-vious findings for other conditions in studies using SPs [6]. Like in other studies, even in those cases that are correctly managed, there is a preference for radiography over microbiological testing. This contrasts with WHO recommendations for TB diagnosis, as CXRs often yield sig-nificant false positives.
Deficits in care only partially reflect poor knowledge of how to diagnose and manage TB cases. Correct case management proportions are significantly higher in the vignettes than with the SPs, suggesting a sizeable gap between physician knowledge and practice. This “know-do” gap has been reported in every comparison of vignettes and SPs and highlights the
Fig 5. Estimated patient pathways under status quo (patients freely selecting into tiers). Percentages at bottom of
figure show the percentage of patients selecting into each health system tier based on survey responses (S5 Table). For each referral pathway, figure shows percentage of total patient population following each path calculated using SP results for subsample of complete health systems.
https://doi.org/10.1371/journal.pmed.1002405.g005
Table 2. Simulation of system-level management outcomes with and without managed referrals.
Patients Select Initial Provider Level*
Managed Referrals§
Start from VC Start from THC
% Correctly Managed with Straight Referrals☨ 34% (27–41) 4% (1–15) 35% (28–42)
% Correctly Managed with True Referrals 40% (34–47) 16% (7–30) 37% (30–44) THC, township health center; VC, village clinic
Data are % (95% CI).
*Patient sorting in ‘Patients Select Initial Provider Level’ column based on a nationally representative sample of rural households: 45.7% at village, 30.87% at township, 23.43% at county.
§Managed referrals refer to patients being required to initially visit providers at the village or township level. ☨“Straight Referrals” refers to referrals only being allowed to the next highest tier. “True Referrals” allow for
bypassing.
considerable discordance between national and international guidelines of TB care and the actual experience of patients [23–26]. Although policymakers recognize that guidelines tend to be aspirational, the study highlights the scale of the discordance between guidelines and prac-tice. There are 3 classes of explanation for why this discordance arises.
The first has to do with “treatment that is best for the patient, but not for society.” Most patients with these symptoms will likely not have TB. Therefore, even though the correct actions can reduce transmission, providers may prefer a “wait and see” approach, using a cock-tail of broad spectrum antibiotics and evaluating the patient if he/she does not improve. Patients may prefer this approach, as they do not have to undergo time-intensive tests and the psychological consequences of a potential TB diagnosis. It is worth highlighting though, that providers do not appear to follow a set protocol that is based on reasonable and pragmatic norms recognized as best practice in given settings. We see considerable variation in the way SPs are treated, ranging from the use of antibiotics and quinolones to the times spent and questions that are asked. Similar variation has been found in Delhi, India, but not in Nairobi, Kenya, where half of all SP visits to the public sector for the same case that we used here resulted in a recommendation for a sputum test [27].
The second class of explanations recognizes that some actions benefit the provider at the expense of the patient’s own welfare, due to weak or misaligned incentives. The link between provider compensation and drug sales [28], for instance, implies that providers have an incen-tive to “retain” rather than refer their patients [29] and—worryingly, given China’s high inci-dence of drug-resistant tuberculosis (DR-TB) [30]—use antibiotics inappropriately.
Finally, a third class of explanations assume that providers indeed wish to follow protocols, but are hampered by the lack of necessary equipment or very high patient loads. As to the first, we indeed find that the correct management of SPs in THCs with X-ray equipment and staff was 18 percentage points higher. However, even if this relationship were causal, it would still leave sizable deficits relative to standards of TB care. Moreover, providers could always refer patients to upper-level facilities for diagnostic testing but often fail to do so. As to high patient loads as a constraining factor, in sharp contrast to the view that providers have too many patients, we found only 0.52 (in VCs) and 1.13 (THCs) patients waiting when the SP visited. Healthcare providers spend 10 to 12 minutes with each SP despite considerable slack in their workdays.
Limitations
There are several limitations to our study. First, we evaluate the management of a single SP depicting a classic case of presumptive TB. As a result, we do not know how physicians may deal with more complicated TB presentations (patients with recurrent TB symptoms, sugges-tive of drug-resistant TB) and whether physicians can correctly treat known cases of TB. Das et al. 2015 [7], for instance, evaluated physician management of 4 different cases, including a confirmed case of TB and suspected multi-drug resistant tuberculosis (MDR-TB).
A second limitation is that we evaluate one-time new patient interactions. Due to increased risk of detection, SPs did not complete follow up visits with the 11% of physicians who asked patients to return (seeTable 1). Moreover, SPs were completely unknown to physicians; physi-cian treatment of known, regular patients may differ. Differences due to this are more likely at the village level than with township and county level providers.
Third, SPs did not complete invasive tests, and it could be that the completion of these tests would have led to different treatment paths for real patients. We can therefore evaluate the treatment path only to the point that an invasive test was ordered. Particularly in the case of county hospitals, this is likely to have resulted in an overly-lenient assessment of case manage-ment since nearly all suggested chest radiographs, but we are unable to determine whether this was part of their work-up for TB or whether they routinely order CXR for all patients or for financial or other nonmedical reasons. However, in another exercise, we did present doctors in county hospitals with CXRs of actual TB patients provided by the CCDC chosen to match the case presented in the SP script. After being shown this X-ray, 32% of county-level doctors who ordered a CXR for SPs mentioned TB as a potential diagnosis, suggesting that the low use of microbiological testing persists even after an abnormal CXR.
Fourth, although SPs underwent intensive training aimed at standardizing their presenta-tion of the disease case, there may nevertheless remain differences across SPs. Any differences across SPs however, are unlikely to significantly affect results, as SPs were randomly assigned to providers. Moreover, regression models including and excluding fixed effects for SPs yield similar coefficients on variables of interest. In models comparing village, township, and county differences, SP fixed effects explain only 7% of the overall variation in correct management in our data.
Our simulations of system-level outcomes under alternative managed referral policies also have a number of limitations. First, simulations assume that patients would follow suggested referrals. Second, these simulations hold patient and provider behavior fixed (by design). We do not consider how patients’ healthcare-seeking behavior or provider behavior may change as a result of mandated initial visits at lower levels of the health system. They also do not account for how providers at higher tiers may treat patients differently if patients were to reveal that they had been referred by lower-tier providers. Third, uncertainty in our simula-tions arise from sampling variation both in the nationally representative household survey and within the sample of providers visited by SPs. Fourth, there is imperfect overlap between the sampling frame of the nationally-representative rural household survey on patient selection of initial provider tiers used in simulations of management under the “status-quo” and the sam-pling frame for SP visits to providers.
Conclusion
Village and township providers in the rural health system perform poorly in diagnosis and management of a classic case of presumptive TB. Poor performance is due to not only a lack of provider knowledge but also a large gap between provider knowledge and practice. Given sig-nificant deficits in quality of care, reforms encouraging first contact with village providers in rural areas would undermine further progress against TB in China unless substantial efforts are also made to improve the management of patients with suspected TB in VCs and THCs. An effective approach could involve greater integration between health system tiers with mechanisms to facilitate the transfer of knowledge from higher to lower levels and strengthen incentives for appropriate referral but initially continuing to allow for greater patient choice.
Supporting information
S1 STROBE checklist.
(PDF)
S1 Table. Provider characteristics.
(PDF)
S2 Table. Completion of checklist items.
(PDF)
S3 Table. Correlates of correct management, CXR, referral, and antibiotic prescription of standardized patients (SPs) among village and township providers.
(PDF)
S4 Table. Additional statistics comparing vignettes and SP visits.
(PDF)
S5 Table. Patient selection into health system tiers with symptoms of TB.
(PDF)
S6 Table. Simulation of system-level management outcomes with and without managed referrals (all health systems).
(PDF)
S7 Table. Simulation of out-of-pocket costs with and without managed referrals.
(PDF)
S1 Fig. Case management of SPs.
(PDF)
S2 Fig. Estimated patient pathways under gatekeeping.
(PDF)
S1 Text. Methodological appendix.
(PDF)
Acknowledgments
Author Contributions
Conceptualization: Sean Sylvia, Yaojiang Shi, Scott Rozelle, Madhukar Pai, Jishnu Das.
Formal analysis: Sean Sylvia, Hao Xue, Madhukar Pai, Jishnu Das.
Funding acquisition: Sean Sylvia, Chengchao Zhou, Yaojiang Shi, Scott Rozelle, Jishnu Das.
Methodology: Sean Sylvia, Hao Xue, Chengchao Zhou, Hongmei Yi, Huan Zhou, Madhukar
Pai, Jishnu Das.
Writing – original draft: Sean Sylvia, Jishnu Das.
Writing – review & editing: Sean Sylvia, Hao Xue, Chengchao Zhou, Yaojiang Shi, Hongmei
Yi, Huan Zhou, Scott Rozelle, Madhukar Pai, Jishnu Das.
References
1. Wang L, Zhang H, Ruan Y, Chin DP, Xia Y, Cheng S, et al. Tuberculosis prevalence in China, 1990– 2010; a longitudinal analysis of national survey data. Lancet. 2014 Jun 20; 383(9934):2057–64.https:// doi.org/10.1016/S0140-6736(13)62639-2PMID:24650955
2. Qin ZZ. Delays in diagnosis and treatment of pulmonary tuberculosis, and patient care-seeking path-ways in China: a systematic review and meta-analysis. M.Sc. Thesis, McGill University. 2015.
3. Li Y, Ehiri J, Tang S, Li D, Bian Y, Lin H, et al. Factors associated with patient, and diagnostic delays in Chinese TB patients: a systematic review and meta-analysis. BMC Med. 2013 Jul 2; 11(1):156.
4. China Joint Study Partnership. Healthy China: Deepening Health Reform in China, Building High-Qual-ity and Value-Based Service Delivery. 2016. Available from:http://www.worldbank.org/en/country/ china/publication/healthy-china-deepening-health-reform-in-china
5. Yip WC-M, Hsiao WC, Chen W, Hu S, Ma J, Maynard A. Early appraisal of China’s huge and complex health-care reforms. The Lancet. 2012 Mar 9; 379(9818):833–42.
6. Sylvia S, Shi Y, Xue H, Tian X, Wang H, Liu Q, et al. Survey using incognito standardized patients shows poor quality care in China’s rural clinics. Health Policy Plan. 2015 Apr 1; 30(3):322–33.https:// doi.org/10.1093/heapol/czu014PMID:24653216
7. Das J, Kwan A, Daniels B, Satyanarayana S, Subbaraman R, Bergkvist S, et al. Use of standardised patients to assess quality of tuberculosis care: a pilot, cross-sectional study. Lancet Infect Dis. 2015 Nov 30; 15(11)1305–13.https://doi.org/10.1016/S1473-3099(15)00077-8PMID:26268690
8. Mohanan M, Vera-Herna´ndez M, Das V, Giardili S, Goldhaber-Fiebert JD, Rabin TL, et al. The know-do gap in quality of health care for childhood diarrhea and pneumonia in rural India. JAMA Pediatr. 2015 Apr 1; 169(4):349–57.https://doi.org/10.1001/jamapediatrics.2014.3445PMID:25686357
9. Leonard KL, Mliga GR, Haile Mariam D. Bypassing health centres in Tanzania: revealed preferences for quality. J Afr Econ. 2002 Dec 1; 11(4):441–71.
10. Das J, Mohpal A. Socioeconomic Status And Quality Of Care In Rural India: New Evidence From Pro-vider And Household Surveys. Health Aff. 2016 Oct 1; 35(10):1764–73.
11. State Council of China. Guidelines for implementing the national tuberculosis control program in china (2011–2015). 2011. Available from:http://www.gov.cn/gongbao/content/2011/content_2020914.htm 12. Wagstaff A, Lindelow M, Jun G, Ling X, Juncheng Q. Extending health insurance to the rural population:
an impact evaluation of China’s new cooperative medical scheme. J Health Econ. 2009 Jan 31; 28 (1):1–9.https://doi.org/10.1016/j.jhealeco.2008.10.007PMID:19058865
13. National Health and Family Planning Commission of the People’s Republic of China. China Health Sta-tistics Yearbook. 2015. Available from:http://www.stats.gov.cn/tjsj/ndsj/2015/indexeh.htm
14. National Bureau of Statistics. China Statistical Yearbook (2015). Beijing: China Statistics Press; 2016.
15. National Health and Family Planning Commission of the People’s Republic of China. Standards of out-patient diagnosis and treatment of pulmonary tuberculosis. 2012. Available from:http://www.moh.gov. cn/mohyzs/s3586/201202/54119.shtml
16. National Center for Tuberculosis Control and Prevention, China CDC. Diagnostic criteria for pulmonary tuberculosis (WS 288–2008). 2008. Available from:http://tb.chinacdc.cn/zcfg/dfzcfg/201208/ t20120814_66809.htm
18. Currie J, Lin W, Zhang W. Patient knowledge and antibiotic abuse: Evidence from an audit study in China. J Health Econ. 2011 Sep 30; 30(5):933–949.https://doi.org/10.1016/j.jhealeco.2011.05.009
PMID:21733587
19. Li Y. China’s misuse of antibiotics should be curbed. BMJ. 2014 Feb 12; 348.
20. Wang J, Wang P, Wang X, Zheng Y, Xiao Y. Use and Prescription of Antibiotics in Primary Health Care Settings in China. JAMA Intern Med. 2014 Dec 1; 174(12):1914–20.https://doi.org/10.1001/
jamainternmed.2014.5214PMID:25285394
21. Hogan CA, Puri L, Gore G, Pai M. Impact of fluoroquinolone treatment on delay of tuberculosis diagno-sis: A systematic review and meta-analysis. J Clin Tuberc Mycobact Dis. 2017 Jan; 6:1–7.
22. Huddart S, MacLean E, Pai M. Location, location, location: tuberculosis services in highest burden countries. Lancet Glob Health. 2016 Dec 1; 4(12):e907–8.https://doi.org/10.1016/S2214-109X(16) 30248-0PMID:27855868
23. Das J., Hammer J., 2014. Quality of Primary Care in Low-Income Countries: Facts and Economics. Annu Rev Econom 6, 525–553.
24. Das J, Hammer J. 2007. Money for nothing: the dire straits of medical practice in Delhi, India. J Dev Econ 83:1–36.
25. Leonard KL, Masatu MC, Vialou A. 2007. Getting doctors to do their best: the roles of ability and motiva-tion in health care. J Hum Resour 42:682–700.
26. Gertler PJ, Vermeersch C. 2012. Using performance incentives to improve health outcomes. Policy Res. Work. Pap. 6100, World Bank, Washington, DC.
27. Daniels B, Dolinger A, Bedoya G, Rogo K, Goicoechea A, Coarasa J, et al. Use of standardised patients to assess quality of healthcare in Nairobi, Kenya: a pilot, cross-sectional study with international com-parisons. BMJ Glob Health. 2017; 2, e000333.https://doi.org/10.1136/bmjgh-2017-000333 28. Yip WC-M, Hsiao W, Meng Q, Chen W, Sun X. Realignment of incentives for health-care providers in
China. Lancet. 2010 Mar 27; 375(9720):1120–30.https://doi.org/10.1016/S0140-6736(10)60063-3
PMID:20346818
29. Wagstaff A, Lindelow M, Wang S, Zhang S. Reforming China’s Rural Health System. The World Bank; 2009.
30. Zhao Y, Xu S, Wang L, Chin DP, Wang S, Jiang G, et al. National Survey of Drug-Resistant Tuberculo-sis in China. N Engl J Med. 2012 Jun 7; 366(23):2161–70.https://doi.org/10.1056/NEJMoa1108789