THE EFFECT OF ACUTE EXERCISE ON MUCOSAL ASSOCIATED INVARIANT T-CELL ACTIVITY IN MODERATELY TRAINED YOUNG MALES
Eli Joseph Danson
A thesis defense submitted to the faculty at the University of North Carolina at Chapel Hill in partial fulfillment of the requirements for the degree of Masters of Arts in the Department
of Exercise and Sports Science (Exercise Physiology).
Chapel Hill 2017
`
Approved by:
iii ABSTRACT
Eli Joseph Danson: The Effect of Acute Exercise on Mucosal Associated Invariant T-Cell Activity in Moderately Trained Young Males
(Under the direction of Erik Hanson)
iv
v
ACKNOWLEDGEMENTS
I would like to give my sincerest thanks to my advisor Dr. Erik Hanson for leading me through this thesis process. Without his mentorship, availability, trust, openness for discussion and flexibility, this process would have been unmanageable. I would also like to thank my committee members Dr. Claudio Battaglini and Dr. Samy Sakkal for their contributions
vi
TABLE OF CONTENTS
LIST OF TABLES………...………vii
LIST OF FIGURES………...……..vii
LIST OF ABBREVIATIONS………. ……… ix
CHAPTER II: INTRODUCTION Introduction………..……. 1
Purpose……….….. 4
Research Questions………..………..5
Research Hypothesis………..5
Assumptions……… ……...5
Delimitations………..……….6
Limitations……….……….6
Significance of Study………... ……..6
CHAPTER II: REVIEW OF LITERATURE MAIT Cell Protein Expression and Development….………...………...8
vi
MAIT Cell Pathophysiological Response……...…… ……….………..13
MAIT Cell Function in Disease States……… …....……...………18
Lymphocyte Response to Exercise………. ..………..22
Summary………...………24
CHAPTER III: METHODS Participants………..……….………26
Study Design……….………..……….……….26
Body Composition Assessment……….……….……….27
Familiarization Session……….…...………….………..……27
Graded Exercise Test………..…..……….……….28
Blood Draws …….……… …..……….………29
Moderate Intensity Exercise Trial……….………30
Blood Analysis.……….………...……….………31
Statistical Analyses……….……….………32
CHAPTER IV: RESULTS Participants……….……….……….33
Changes in Lymphocytes and Conventional T-Cells………....33
Changes in MAIT Cells………...………… ………36
Chemokine Receptor and Activation Marker Alterations………...39
Body Composition and Cardiopulmonary Correlations with MAIT Cells…………43
CHAPTER V: DISCUSSION Discussion……….………...…….44
vii
LIST OF TABLES
Table 1 – List of Bacteria That Activate MAIT Cells………...…14
Table 2 – Lymphocyte Response to Acute Exercise………..23
Table 3 – Participant Characteristics……… 33
Table 4 – Complete Blood Count Completed on Whole Blood………....34
viii
LIST OF FIGURES
Figure 1 – Summary of Study Design………27
Figure 2 – Summary of Moderate Intensity Exercise Trial………...………..30
Figure 3 – Gaiting Strategy For MAIT Cell Identification………..30
Figure 4 – Classic T-Cell Response to Moderate Intensity Exercise…………..……….35
Figure 5 – MAIT Cell Response to Moderate Intensity Exercise………37
Figure 6 - % of CD3+CD8+ T-Cells Comprised of MAIT Cells……….. .39 Figure 7 – Chemokine Receptor Response to Moderate Intensity Exercise………….……..40
Figure 8 – Mean Fluorescence Intensities of Chemokine Receptors………...…42
ix
LIST OF ABBREVIATIONS
APC – Antigen Presenting Cell
AT – Adipose Tissue
β2m – β2-Microglobulin
CCR – CC Chemokine Receptor
CD – Cluster of Differentiation
CDR – Complementary Determining Region CTL – Cytotoxic T-Lymphocyte
DXA – Dual Energy X-Ray Absorptometry Gr – Granzyme
IFN – Interferon IL – Interleukin
iNKT – Invariant Natural Killer T Cell LDH – Lactate Dehydrogenase
MAIT – Mucosal Associated Invariant T MHC – Major Histocompatability Complex MR1 – MHC Related Protein-1
MS – Multiple Sclerosis
PMA – Phorbol 12-Myristate 13-Acetate
rRL-6-CH2OH – 6-Hydroxymethyl-8-D-Ribityllumazine
RL-6-Me-7-OH – 7-Hydroxymethyl-6-Methyl-8-D-Ribityllumazine RPE – Rating of Perceived Exertion
x TCR – T-Cell Receptor
Th1 – T Helper 1
TNF – Tumor Necrosis Factor
1
CHAPTER I INTRODUCTION
The immune system utilizes a variety of cells to maintain a healthy homeostatic
environment for all physiological systems. The first line of defense against any pathogen is the innate immune system which protects the body with physical barriers, phagocytic cells and natural killer cells (Treiner et al., 2003). The common mucosal system, another portion of the innate immune system, is made up of tissues which secrete mucosal immune antibodies such as secretory immunoglobulin A (sIgA) to protect vulnerable mucosal surfaces (Gleeson et al., 1999). While each component of the innate immune system has an individualized defense mechanism, each uses the same defense mechanism for all pathogens encountered and can respond to pathogens without previous exposure. Naïve cells of the acquired immune response, T-cells and B-cells, develop a pathogen specific response after encountering a pathogen for the first time. When the pathogen invades the organism at a later date, it is recognized by the now mature T-cells and B-cells triggering the release of a combination of cytokines and antibodies specifically designed to combat and kill the pathogen.
2
evolutionarily conserved, semi-invariant Vα7.2-Jα33/12/20 T-cell receptor (TCR) which recognizes antigens presented on the major histocompatibility complex (MHC) class I-related (MR1) molecule (Tilloy et al., 1999, Gold et al., 2014). MR1-expressing hematopoietic cells are selected in the thymus triggering the development of the MAIT cell TCR (Martin et al., 2009). After thymic egress, MAIT cells express homing markers CCR5, CCR6, CCR9 and CXCR6 that direct MAIT cells towards mucosal tissue including the liver, gut, spleen and lungs (Dusseaux et al., 2011). MAIT cells in the lungs of mice with Francisella tularensis, a bacteria that causes pulmonary infection, had significantly higher expression of CCR5 compared to the other homing markers, highlighting the tissue specific characteristics these homing markers possess
(Meierovics et al., 2013).
Once located in the appropriate/specific mucosal tissue, MAIT cells interact with commensal flora and B cells which initiates MAIT TCR adaptations and induces proliferation and ultimately accumulation in the mucosal tissue (Treiner et al., 2003; Martin et al., 2009; Koay et al., 2015). Illuminating the role of commensal flora in MAIT cell accumulation, germ free mice have significantly diminished MAIT cell numbers compared to wild type mice (Treiner et al., 2003). After interaction with commensal flora and B cells, MAIT cells recognize
intermediates from the riboflavin biosynthetic pathway, such as
6-hydroxymethyl-8-D-ribityllumazine, bound to MR1 on antigen presenting cells (APCs) (Kjer-Nielsen et al., 2012). MAIT TCR recognition of MR1 with accompanying riboflavin ligand stimulates the
3
pathogen without previous exposure, demonstrating properties of both the innate and acquired immune systems.
MAIT cell counts and function are affect by a number of different diseases. Individuals with irritable bowel diseases have reduced frequency of circulating MAIT cells with a significant increase within injured ileum tissue, along with higher secretion levels of the pro-inflammatory cytokine IL-17, compared to healthy controls (Serriari et al., 2014), though this finding has been recently debated (Hiejima et al., 2015). Similar to irritable bowel disease, obese individuals and diabetics possess lower MAIT cell numbers in the blood with a subsequent increase in the adipose tissue and higher IL-17 production (Magalhaes et al., 2015). Severe asthma reduces MAIT cell counts in both the blood and lung tissue (Hinks et al., 2015). The magnitude of MAIT cell loss was significantly correlated to clinical severity, indicating a potential relationship between MAIT cells and respiratory health.
MAIT cells have the ability to fight a range of bacterial and viral pathogens. The bacteria all have the riboflavin biosynthetic pathway and include Mycobacterium tuberculosis,
Escherichia coli, Staphylococcus aureus and Salmonella typhimurium (Ussher et al., 2014). In response to monocytes co-cultured with Escherichia coli, MAIT cells up regulate CD69 and secrete IFNγ (Le Bourhis et al., 2010). MAIT cells can also combat dengue, influenza A and hepatitis C viruses and do so through an IL-18, TCR-independent pathway. MAIT cells from individuals with the viruses listed above had higher CD69 and IFNγ expression (Loh et al., 2016, Wilgenburg et al., 2016).
4
restricted T-cells, cytotoxic MHC restricted T-cells, Naïve T-helper cells, eosinophils,
granulocytes and monocytes increase in the venous blood following an acute bout of exercise, with the magnitude of response dependent on the duration and intensity of the exercise bout. (Hansen et al., 1991; Gabriel et al., 1992; Nieman et al., 1992; Bishop et al., 2014). Natural killer cells and CD3+ (pan T cell marker) cells exhibit a biphasic response, where cell counts increase in the blood immediately after exercise and fall below baseline values during recovery, at high enough intensities (Nieman et al., 1992).
MAIT cells provide a potential novel link between the innate and acquired immune systems as well as the lymphocyte and mucosal immune response to exercise. With a role in all these systems, understanding MAIT cell response to exercise could uncover mechanistic
reasoning behind discrepancies in the literature regarding the J-shaped curve. To our knowledge, there are no published studies detailing MAIT cell response to an acute bout of exercise.
Preliminary data completed by Hanson and associates (2016) suggests that MAIT cell counts increase after a graded maximal exercise test, but the effect of moderate intensity exercise on MAIT cells immediately after and into recovery is not known (Hanson et al., 2016 unpublished). Thus, any finding in this thesis is novel and can give insight into MAIT cell counts and function after exercise.
Purpose
5 Research Questions
1. Do MAIT cell counts in the peripheral circulation change immediately and one hour after a 40-minute exercise bout at 90-98% ventilatory threshold (VT) on a cycle ergometer? 2. Is there increased activation of MAIT cells immediately and one hour after a 40-minute
exercise bout at 90-98% VT on a cycle ergometer?
3. Does MAIT cell homing marker expression change immediately and one hour after a 40-minute exercise bout at 90-98% VT on a cycle ergometer?
Research Hypothesis
1. A 40-minute exercise bout at 90-98% VT on a cycle ergometer will cause an increase in MAIT cell counts immediately after exercise followed by a decline below baseline at one-hour post-exercise.
2. A 40-minute exercise bout at 90-98% VT on a cycle ergometer will cause decreased expression of CD69 in MAIT cells one-hour post-exercise
3. A 40-minute exercise bout at 90-98% VT on a cycle ergometer will cause an increase in CCR5 and CCR6 expression on MAIT cells immediately after exercise followed by a decrease in CCR5 and CCR6 expression on MAIT cells one-hour post-exercise.
Assumptions
1. Participants will follow pre-assessment guidelines.
2. Participants who say they are recreationally active will fit our inclusion criteria. 3. All Participants will answer the medical history questionnaire and physical activity
readiness questionnaire truthfully.
6 Delimitations
1. The sample will contain only young men, ages 18 to 35.
2. All Participants will be moderately active, partaking in 30 minutes of rigorous activity as defined by the American College of Sports Medicine, at least 3 times per week.
3. All Participants will have had no contraindications for exercise testing. 4. All Participants will be non-smokers.
Limitations
1. No females will be included in the study limiting the application of results to all individuals
2. Elite athletes will be excluded from the study
3. Totally sedentary individuals will be excluded from the study.
Significance of Study
7
8 CHAPTER II LITERATURE REVIEW
This review is divided into five sections. MAIT cell protein expression and development is covered in section 1. MAIT cell activation, cytokine profile, and cytotoxic capabilities will be discussed in section 2. MAIT cell response to bacterial and viral infection is discussed in section 3. The effect of a variety of diseases on MAIT cells will be summarized in section 4. Section 5 will review lymphocyte responses to varying levels of exercise.
Section 1: MAIT Cell Protein Expression and Development
MAIT cells express a semi-invariant T-cell receptor (TCR) Vα7.2-Jα33/12/20 on the cell membrane. The MAIT TCR was first characterized after a group of double negative (DN) T-cells had frequent expression of a novel Vα-Jα TCR combination that differed than that normally expressed by invariant natural killer T (iNKT) cells, another DN T-cell (Tilloy et al., 1999). The α chain of the new cells, across all 37 Participants, had a complementary determining region (CDR) 3 of constant length and high Vα and Jα homology to murine and bovine cells,
9
Subsequent research focused on the possibility of greater variation of the Jα and Vβ segments of pathogen-reactive MAIT TCRs. Building on to the findings of Tilloy and associates, Gold and colleagues detected that pathogen-reactive MAIT TCRs had either a Jα33, Jα 12 or Jα20 region (Gold et al., 2014). Additionally, bacteria such as Salmonella typhimurium activated MAIT cells with either the Jα33, Jα 12, or Jα 20 region while other bacteria such as Candida albicans only activated MAIT cells coding for Jα33 (Gold et al., 2014). Similar findings were made regarding the Vβ gene, the difference being there were 35 different Vβ genes found in pathogen-reactive MAIT cells, demonstrating greater Vβ diversity than first proposed in 1999. While there is some variability of MAIT TCR Jα and Vβ expression within an individual, a greater difference is found between individuals (Gold et al., 2014).
10
three metabolites were chemically synthesized and rRL-6-CH2OH was found to most strongly activate MAIT cells, measured by CD69 expression, TNFα and IFNγ levels (Kjer-Nielsen et al., 2012). Each of the ligands has a different orientation in the MR1 binding cavity, effecting their stimulatory capacity. The ribityl chain of the rRL-6-CH2OH ligand emerges from the MR1 cavity, establishing hydrogen-bonds with both the CDR3 α and β loops of the MAIT TCR, making the bond between MR1 and the TCR more stable. RL-6-Me-7-OH does not have the ribityl chain binding to the CDR3 loops of the MAIT TCR which partially explains the different stimulatory capabilities of the different ligands (Lopez-Sagaseta et al., 2013).
MAIT cells have been shown to undergo a three-stage intrathymic developmental pathway, with an intra-thymic selection followed by peripheral expansion (Martin et al., 2009; Koay et al., 2016). MAIT cells develop in the thyums, where they undergo positive section and lineage commitment after interacting with MR1-expressing CD4+CD8+ double-positive
thymocytes (Seach et al., 2013). To elucidate the role of MR1 in selecting MAIT cells, healthy fetal liver cells with MR1 expression were transferred into irradiated β2m-deficeint mice and transcripts of Vα19-Jα33 (the murine homolog to human MAIT TCR) were present. Conversely, when β2m deficient liver cells (MR1 expression in cells is dependent on the presence of
11
MAIT cells acquire CD161 expression right before their exit from the thymus and remain naïve until birth (Martin et al., 2009).
After thymic egress, stage II MAIT cells interact with B cells, which causes their
expansion and accumulation in the periphery. Martin and colleagues (2009) knocked out B cells in mice while maintaining MR1 expression which caused very low MAIT cell counts in the peripheral blood. After injection of splenocytes, which allowed for B cell counts to match wild type numbers, MAIT cell counts in the peripheral blood greatly increased, indicating that B cells are required for MAIT cell development/proliferation (Martin et al., 2009). Similarly, mice were genetically manipulated so that only macrophages and dendritic cells expressed β2m (Treiner et al., 2003). In these mice, there was no expression of Vα19-Jα33 cells in the lamina propria (Treiner et al., 2003). When β2m positive B cells were introduced into these mice, there was a significant increase in Vα19-Jα33 expression in the lamina propria, further demonstrating the role of B cells for MAIT cell peripheral expansion (Treiner et al., 2003). To demonstrate the role of B cells in human MAIT selection/expansion, Vα7.2-Jα33 transcripts within DN T cells was quantified in individuals with mutated Bruton tyrosine kinase which causes significantly fewer B cells in the blood. Significantly lower Vα7.2-Jα33 transcript levels were found in these
Participants compared to healthy controls, confirming that B cells are involved in both human and mice MAIT cell selection and expansion (Treiner et al., 2003).
12
Bifidobacterium animalis, Vα19-Jα33 mRNA in the mesenteric lymph nodes increased to the level found in WT mice, further highlighting the role of commensal flora for MAIT cell expansion and accumulation in peripheral tissue (Le Bourhis et al., 2010). MAIT cells also interact with the transcription factor PLZF which triggers increases in CD161 expression and provides functionality to the MAIT cells (Koay et al., 2016). The findings from the studies reviewed above all support the theory of a three step intra-thymic developmental pathway and that different pathogen associated antigens and exogenous MR1-restricted epitopes presented by the commensal flora drive distinct donor-specific TCRβ clonotype expansions within the MAIT cell population (Gold et al., 2014). With the wide variety of Vβ genes seen in MAIT cells, it appears that MAIT TCRβ clonotypic expansion occurs in a manner similar to conventional T-cells.
Section 2: MAIT Cell Cytokine and Cytotoxic Profile.
MAIT cells secrete Th1/Th17 cytokines as well as cytotoxic chemicals. After stimulation with phorbol 12-myristate 13-acetate (PMA)/ionomycin, chemicals used to induce cytokine production, MAIT cells release high levels of IFNγ, IL-2 (both Th1 cytokines), GrB and TNFα in amounts similar to memory CD8 T cells and IL-17 (a Th17 cytokine) in amounts similar to CD4 T cells (Dusseaux et al., 2011). Interestingly, a higher percentage of MAIT cells released IL-17 after PMA/ionomycin stimulation compared to CD4 T cells. When stimulated with
anti-CD3/CD28-coupled beads, IFNγ and IL-2 production decreased compared to PMA/ionomycin stimulation (Dusseaux et al., 2011).
13
(Ussher et al., 2014). In the liver, MAIT cells produced greater levels of Th1/Th17 cytokines after mitogen activation compared to blood MAIT cells, demonstrating the possible existence of MAIT cells with functionally distinct cytokine production in different tissues (Tang et al., 2013). Furthermore, both blood and liver MAIT cells had an increase in IFNγ, IL-17, TNFα and IL-2 production after incubation with IL-7 and stimulation with either bacteria or anti-CD3/CD28-coupled beads (Tang et al., 2013).
MAIT cells also display a unique cytotoxic profile. Unstimulated MAIT cells located in the blood of healthy Participants express GrA and GrK while 30% of MAIT cells express perforin and almost all lack GrB expression (Kurioka et al., 2015). Once activated, MAIT cells have decreased expression of GrA and GrK and increased expression of GrB and perforin. GrA and GrK in MAIT cells are located within cytotoxic granules and MAIT cells after activation degranulate as shown by a decrease in CD107α expression which could explain the decreased GrA and GrK expression (Kurioka et al., 2015). As GrA and GrK have been shown to activate monocytes to produce proinflammatory cytokines like IL-1β and TNFα, degranulation of resting MAIT cells may assist in the control of bacterial infection through phagocyte activation (Kurioka et al., 2015). Using anti-MR1 antibody or anti-IL-12 antibody inhibited GrB expression,
indicating a similar intracellular pathway for GrB production when activated by MR1 or IL-12 (Kurioka et al., 2015).
Section 3: MAIT Cell Pathophysiological Response
14
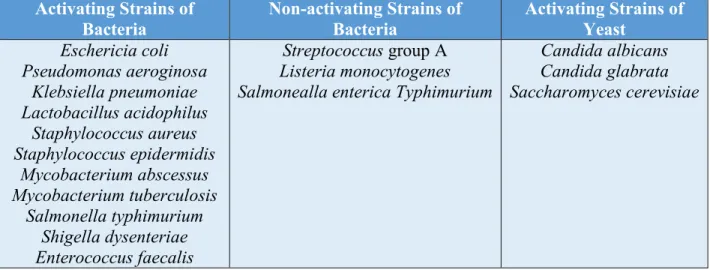
Activating Strains of Bacteria
Non-activating Strains of Bacteria
Activating Strains of Yeast Eschericia coli Pseudomonas aeroginosa Klebsiella pneumoniae Lactobacillus acidophilus Staphylococcus aureus Staphylococcus epidermidis Mycobacterium abscessus Mycobacterium tuberculosis Salmonella typhimurium Shigella dysenteriae Enterococcus faecalis
Streptococcus group A Listeria monocytogenes Salmonealla enterica Typhimurium
Candida albicans Candida glabrata Saccharomyces cerevisiae
Table 1.Strains of bacteria and yeast that activate MAIT cells as well as strains of bacteria and viruses that do not activate MAIT cells. Adapted from Kjer-Nielsen et al., 2012 (Kjer-Nielsen et al., 2012; Le Bourhis et al., 2010; Gold et al., 2010)
15
significantly (Le Bourhis et al., 2013). Taken together, these results show the cytotoxic potential of MAIT cells in response to E. coli and that the cytotoxic response is MR1 dependent.
CD161 has been shown to modulate cytokine production in MAIT cells after culture with E. coli. When anti-CD161 antibody was added to a culture with MAIT cells and E. coli, CD69 expression was similar to the control conditions while upregulation of CD25 was reduced, indicating the cytotoxic potential of MAIT cells is not significantly modified by CD161 ligation (Le Bourhis et al., 2013). Conversely, in the presence of anti-CD161 antibody, MAIT cells released much lower levels of IFNγ, TNFα, and IL-12, illustrating the role CD161 has in modulating cytokine release in response to E. coli (Le Bourhis et al., 2013).
16
significantly higher for lung MAIT cells, underlining the potential role bacteria can play in tissue specific MAIT cell function (Gold et al., 2010).
Work by Meierovics and colleagues (2013) provided a timeline of MAIT cell responses to bacteria in vivo, homing responses to bacteria, and the role of MAIT cells in the recruitment of additional lymphocytes in mice. Mice injected with a live vaccine strain of Francisella
tularensis, a bacteria that causes pulmonary infection, had a significant increase of MAIT cells in lung tissue 7 days after infection with another significant increase observed 14 days after
infection (Meierovics et al., 2013). Compared to the other tissues in the mice, the lungs displayed the highest abundance of MAIT cells, with high expression of CCR2, CXCR3, and CCR5, all of which are tissue homing markers (Meierovics et al., 2013). MR1- mice with F. tularensis had significantly higher bacteria counts and took longer to clear the bacteria out of the lungs compared to MR1+ mice. Additionally, MAIT cells in MR1- mice had significantly less IFNγ, TNFα, and IL-17, a pro-inflammatory cytokine released (Meierovics et al., 2013; Dusseaux et al., 2011). Interestingly, Meierovics found significantly lower levels of TCRβCD4 and
TCRβCD8 cells and significantly lower CD69 expression on the T cells present in MR1- mice, indicating MAIT cells play at least a partial role in the recruitment and activation of acquired immune cells in vivo (Meierovics et al., 2013).
The mechanism behind bacterial infection and interaction remains unclear in the
17
invade a cell in a vacuole, preventing fusion with the lysosomal compartment (Le Bourhis et al., 2013). To further justify this claim, more research on bacterial invasion mechanisms and MAIT cell activation needs to be accomplished.
MAIT cells have recently been shown to be activated by certain viruses and play a role in their pathophysiology, however there is some conflicting literature. Wilgenburg et al., reported reduced MAIT cell counts in individuals with dengue fever, dengue haemorrhagic fever, influenza virus and hepatitis C virus (Wilgenburg et al., 2016). Wilgenburg and Loh et al. both have demonstrated in vitro that influenza A virus induces upregulation of IFNγ, CD69 and GrB by MAIT cells (Loh et al., 2016; Wilgenburg et al., 2016). In vivo, MAIT cells had increased CD38, another activation marker, and GrB expression in dengue fever patients, increased GrB expression in influenza patients and increased GrB upregulation in patients with prolonged hepatitis C infection (Wilgenburg et al., 2016).
As it is known that TCR activation is dependent on a metabolite from the riboflavin biosynthetic pathway, the mechanism behind viral activation of MAIT cells was unclear as viruses do not have the riboflavin biosynthetic pathway (Kjer-Nielson et al., 2012). The
18
direct antiviral function, Wilgenburg et al. mixed the supernatant of activated MAIT cells with hepatitis C infected cells and found hepatitis C virus replication was potently suppressed while diluting the activated MAIT cell supernatant reduced the suppression of hepatitis C virus replication in a dose-dependent manner (Wilgenburg et al., 2016). One study has shown that murine MAIT cells were not responsive to viral infection (Le Bourhis et al., 2010). However, this discrepancy is likely due to the use of murine MAIT cells and the potential that human and murine MAIT cells secrete and response to cytokines differently.
Section 4: MAIT Cell Function in Disease States.
MAIT cell counts and function in the peripheral blood and select tissues are affected by a wide variety of pathological diseases. Individuals with asthma have very low MAIT cell counts in the blood, sputum, and biopsy specimens and MAIT cell counts were correlated to disease severity (Hinks et al., 2015). In healthy individuals, the range of circulating MAIT cells is 0.2-7.6% of CD3 cells with a median of 1.82% (Magalhaes et al., 2015). The median frequency of circulating MAIT cells of non-obese type II diabetic individuals is 0.27%, in obese type II diabetics is 0.10% and 0.05% in obese non-type II diabetics all of which were statistically lower than healthy individuals (Magalhaes et al., 2015). The frequency of circulating MAIT cells was negatively associated with individuals’ BMI and positively associated with serum levels of adiponectin and insulin-sensitizing adipokines in severely obese individuals. Additionally, MAIT cell numbers are significantly higher in the omental adipose tissue than in the blood of obese individuals (Magalhaes et al., 2015). Five individuals who had undetectable levels of MAIT cells in the blood had detectable levels in the OM (Malgalhaes et al., 2015).
Obesity and diabetes also affect cytokine production by MAIT cells. After
19
significantly higher levels of IL-2, GrB, IL-17, IFNγ, and TNFα compared to healthy controls and obese individuals while obese type II diabetics produced higher levels of these cytokines compared to healthy controls (Magalhaes et al., 2015). Additionally, MAIT cells in the omental adipose tissue and subcutaneous adipose tissue of obese individuals produced more GrB and IL-17 while producing less TNFα compared to MAIT cells from the omental adipose tissue of healthy individuals. Likewise, there was a higher frequency of MAIT cells expressing IL-17 in obese patients compared to the frequency of IL-17 producing CD4+, CD8+, and double-negative T-cells in healthy controls (Malgalhaes et al., 2015). One explanation for the higher expression of these cytokines is MAIT cells in obese individuals have lower expression of Bcl-2, a protein which increases cellular strength and decreases cell death, and higher expression of Ki67, a proliferation marker (Magalhaes et al., 2015). With diminished Bcl-2 and enhanced Ki67 expression, MAIT cells might be more susceptible to cell death and to compensate for this increase their cytokine production and chronically proliferate to illicit a greater effect in their relatively shortened life span.
20
Similar changes in MAIT cell counts and function are seen in individuals with irritable bowel diseases, though there is some disagreement. MAIT cell counts in the peripheral blood were significantly lower in individuals with Crohn’s disease and ulcerative colitis (Serriari et al., 2014; Hiejima et al., 2015). While Serriari et al. reported MAIT cell counts to be significantly higher in ileal biopsies, jumping from 1.5% of CD3+ cells to 6.6% of CD3+ cells, Hiejima et al. reported lower MAIT cell counts in the inflamed tissue of individuals with Crohn’s disease and ulcerative colitis (Serriari et al., 2014; Hiejima et al., 2015). One hypothesis for the discrepancy is that there are two subpopulations within the Crohn’s disease group, one with normal MAIT cell counts and one with lower MAIT cell counts and the study conducted by Hiejima had more samples to study so they had a higher number of the low MAIT cell count group. MAIT cells in the blood of Crohn’s disease and ulcerative colitis patients had higher expression of Ki67, IL-17, and IL-22 along with elevated expression of NKG2D and BTLA, co-stimulatory molecules of MAIT cells (Serriari et al., 2014). It has been hypothesized that the higher activation is due to the change in the mucosal barrier in these individuals which results in presentation of commensally-derived antigens by MR1 which do not take place in healthy physiological situations.
21
MAIT cells in individuals with multiple sclerosis (MS) display some of the same characteristics of MAIT cells in obese, diabetic, and irritable bowel disease individuals. No significant difference existed in total MAIT cell counts in the blood of healthy individuals and MS individuals (Illes et al., 2004). Conversely, Annibali and colleagues (2011) found there were higher CD161+CD8+ (higher cytokine producing) MAIT cell counts in the blood of individuals with MS compared to healthy donors (Annibali et al., 2011). This discrepancy could be
attributed to the fact that CD161+CD8+ MAIT cells were not yet identified during Illes’ study. MAIT cells were located in chronic inflammatory demyelinating polyneuropathy lesions, in infiltrated autopsy region of the central nervous system, cerebral spinal fluid samples, and peripheral nervous system lesions in MS individuals, demonstrating the hypothetical functional capacity of MAIT cells in the central nervous system (Illes et al., 2004). Similar to obesity, diabetes, and irritable bowel diseases, IL-17 production was increased in MS individuals
compared to healthy controls (Annibali et al., 2011). Illes and colleagues speculated that a reason for increased MAIT cell counts in the lesions was due to the high number of B cells in
inflammatory lesions (Illes et al., 2004). As described previously, MAIT cell expansion and accumulation is dependent on B cells, which justifies Illes hypothesis.
22
(Peterfalvi et al., 2008). In total, these results indicate tumors located in different tissues recruit functionally distinct MAIT cells which could provide mechanistic reasoning for varying
inflammatory responses in tumors.
Of clinical relevance, MAIT cells counts are unaffected by certain chemotherapy
treatments. Individuals undergoing 6 cycles of anthracycline containing chemotherapy for breast cancer had minimal decreases in MAIT cells after the third cycle of treatment and remained stable 1 month after the sixth cycle (Dusseaux et al., 2011). By comparison, conventional memory CD8 T cells significantly decreased in number by the sixth cycle compared to baseline before slightly recovering after chemotherapy. Additionally, all conventional CD4 and CD8 T cells remained decreased after treatment (Dusseaux et al., 2011). Mechanistically, Dusseaux proposed that MAIT cell survival after anthracycline containing chemotherapy was attributed to high expression of ABCB1, a multidrug efflux protein that effluxes anthracycline (Dusseaux et al., 2011).
Section 5: Lymphocyte Response to Exercise.
There is a general consensus among exercise immunologists that lymphocytes exhibit a biphasic response to exercise and the magnitude of lymphocyte response to exercise is relative to exercise duration and intensity. In response to high intensity, short duration bouts of exercise, there is a lymphocytosis observed immediately after exercise sometimes followed by a
23
majority of the lymphocytosis increase resulting from a 176% increase in NK cells (Nieman et al., 1992). Lymphopenia was observed 1-hour post-test because of a sharp decrease in CD4+ T cells and a moderate decrease in CD8+ T cells and NK cells (Nieman et al., 1992). Preliminary data completed by Hanson and colleagues (2016) suggests that MAIT cell counts increase after a graded maximal exercise test (Hanson et al., 2016 unpublished).
It has also been established that lymphocytes exhibit a biphasic response in response to moderate intensity, endurance exercise. 14 healthy individuals performed a five minute warm up on a cycle ergometer at 50% of anaerobic threshold followed by cycling to exhaustion at 100% anaerobic threshold (Gabriel et al., 1992). During the first 10 minutes of exercise, lymphocyte counts had increased by 47% followed by an additional 10% increase between 10 minutes and the end of the exercise trial. The majority of the increase in lymphocyte counts after 10 minutes of exercise, similar to Nieman (1992), could be attributed to a large (+229%) increase in NK cell counts (Gabriel et al., 1992). NK cell counts did not significantly increase throughout the
remainder of the exercise trial. Naïve cytotoxic T cells and non-MHC restricted T cells also increased after the moderate intensity endurance bout while mature cytotoxic cells and naïve helper cells did not change (Gabriel et al., 1992). These results suggest that high intensity
exercise is needed to trigger cytotoxic T cell increases. A similar lymphocytosis was observed in nine, non-elite male cyclists completed a 60 minute exercise bout on a cycle ergometer at 75% VO2peak while lymphopenia was observed 2 hours into recovery (Bishop et al., 2014). A summary of additional lymphocyte responses to exercise can be found in Table 2.
24
receptors were measured and NK cells had the greatest concentration of β-adrenergic receptors, followed by cytotoxic T cells, while helper T cells had the lowest (Maisel et al., 1990). After exercise, NK cells were the only lymphocyte subset to have a significant increase in β-adrenergic receptors (Maisel et al., 1990). Work done by Kruger and colleagues in mice models
demonstrated that introducing a β-adrenergic receptor antagonist before exercise blocked any changes in lymphocyte tissue redistribution (Kruger et al., 2008). Specifically, before
administering the antagonist, there was significant increase after exercise in lymphocytes in the blood and lungs of the mice while a significant decrease in lymphocytes from the spleen, all of which was not observed after the antagonist was administered (Kruger et al., 2008).
Summary
MAIT cells are defined by the semi-invariant T-cell receptor (TCR) Vα7.2-Jα33/12/20 which recognizes metabolites from the riboflavin biosynthetic pathway bound to the
nonpolymorphic class Ib major histocompatibility complex (MHC)-related molecule 1 (MR1). Author Participants Time and Intensity
Pre Exercise T-cell counts (10^9) Immediately After Exercise T-cell counts 1-h After Exercise T-Cell Counts Vider 2001 19 endurance
trained athletes VO2max test 1.30 ± 0.35 2.09 ± 0.63 * 1.13 ± 0.24 *
Nieman 1992
10 recreationally active men
30 second Wingate
test 1.89 ± 0.18 2.00 ± 0.20 * 1.24 ± 0.15 *
Nieman 1994
10 well- conditioned men
45 minutes at 80%
VO2max 1.70 ± 0.18 2.60 ± 0.27 * 0.95 ± 0.10
Nieman 1994
10 well-conditioned men
45 minutes at 50%
VO2max 1.72 ± 0.14 1.78 ± 0.19 * 1.16 ± 0.08
Nieman 1994
10 well-conditioned men
45 minutes at 60%
25
MAIT cells primarily fight bacterial infection through the release of T helper 1 (Th1) and Th17 cytokines as well as perforin and a collection of granzymes (Gr). MAIT cell counts and function are also affected in the blood and tissue of individuals with different diseases. Lymphocytes exhibit a biphasic response to exercise, with the magnitude of response dependent on intensity and duration of the exercise bout. NK cells account for a significant portion of the lymphocytosis while CD4 and CD8 cells account for a large portion of the lymphopenia.
There has been no published research looking at the effects of exercise on MAIT cells. Preliminary data completed by Hanson and associates suggests that MAIT cell counts increase after a graded maximal exercise test (Hanson et al., 2016 unpublished). Understanding MAIT cell response to exercise could help answer many of the discrepancies found in exercise
26 CHAPTER III METHODOLOGY Subjects
20 males, ages 18-35 completed the study. All participants were recreationally active having participated in vigorous activity outlined by the American College of Sports Medicine for 30 minutes at least three times per week (CDC: General Physical Activities). All participants were non-smokers. Exclusion criteria included: any contraindications for exercise testing, a body mass index greater than 30 and consumption of therapeutic corticosteroid medication. The study was approved by the University of North Carolina at Chapel Hill’s institutional review board. Participants signed an informed consent form prior to participation in the study.
Study Design
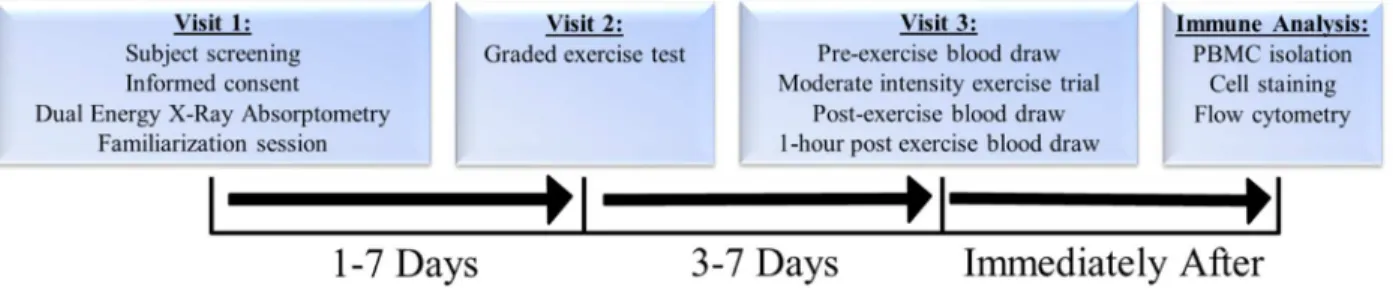
In visit one, participants filed out a medical history questionnaire, physical activity readiness questionnaire (PAR-Q) and informed consent was obtained. Participants had body composition measured via dual energy X-ray absorptiometry (DXA) (Hologic Inc., Bedford, MA, USA; Apex Software Version 3.3), underwent a 12-lead resting electrocardiogram (EKG)
(GE CASE Cardiosoft V. 6.6 ECG diagnostic system; General Electric, Palatine, IL, USA) and a
familiarization session was also completed
27
was drawn. After the collection of resting blood samples, participants completed a moderate intensity exercise trial lasting 40 minutes at 86% VT. Additional blood samples were obtained immediately after and one hour after the exercise trial.
Immune cells were isolated via density gradient centrifugation and treated with an antibody cocktail and analyzed via flow cytometry to determine MAIT cell count, activation levels, and expression of homing markers. Plasma was isolated from remaining whole blood and frozen at -80C for future analysis. Summary of study design found in Figure 1.
Figure 1. Summary of study design. Body Composition Assessment
Participants reported to the lab and confirmed with researchers that pre-assessment guidelines were followed. Participants height (Perspectives Enterprises, Portage, MI, USA) and body mass (Tanita Corp, Tokyo, Japan) were measured. Participants were centered on the DXA table in the supine position and removed any metal or jewelry prior to the scan. A full body DXA scan was taken where fat mass (FM), fat free mass (FFM), and bone mineral content (BMC) were measured.
Familiarization Session
Participants completed the familiarization session on an electro-magnetic breaking cycle
ergometer (Lode, Groningen, Netherlands). Cycle ergometer seat height was adjusted to ensure
proper cycling mechanics. Participants were fitted with a heart rate monitor (Polar FT1, Polar
28
collection. Oxygen uptake and pulmonary ventilation were continuously recorded by a Parvo
Medics’ TrueOne 2400 metabolic cart (Parvo Medics, Sandy, UT, USA). Participants began the
test by sitting quietly on the cycle ergometer for three minutes while the researchers collected
resting metabolic data. Participants began with a two minute warm up period on the cycle
ergometer at no resistance. At the end of the warm up, participants started a two minute stage at
50 watts of resistance. Every two minutes, resistance was increased by 50 watts. This continued
until the end of the 250 watt stage. At this point, stages were one-minute-long and resistance was
increased by 30 watts. Participants cycled until 70% heart rate reserve was reached determined
by the Karvonen formula (Karvonen et al., 1957) during the familiarization session.
Graded Exercise Test
During visit two, participants completed a graded exercise test on an electro-magnetic breaking cycle ergometer (Lode, Groningen, Netherlands). The graded exercise test protocol used in the study was the same protocol used in Kerry Martin’s thesis (Martin 2016). Subject’s height (Perspectives Enterprises, Portage, MI, USA) and body mass (Tanita Corp, Tokyo, Japan) was measured and seat height was adjusted ensure proper cycling mechanics. Participants sat for five minutes after which resting heart rate and blood pressure (Omron Healthcare, Lake Forest, IL, USA) were obtained. Participants were fitted with a heart rate monitor for heart rate
telemetry and a respiratory mask for gas collection. Heart rate was logged every 30 seconds and rating of perceived exertion (RPE) was logged 30 second before the end of each stage during the exercise test on a data collection sheet (Appendix A1). Oxygen uptake and pulmonary ventilation were continuously recorded by a Parvo Medics’ TrueOne 2400 metabolic cart (Parvo Medics, Sandy, UT, USA).
29
fatigue and signaling to stop the test, if the VO2 value plateaued or decreased with an increase in exercise intensity, or if an abnormal participant response to the test was observed. At the
conclusion of the graded exercise test, participants were moved from the cycle ergometer to a chair where their feet were propped on a second chair. Three minutes after terminating the exercise test, one finger was cleaned by two alcohol swabs, dried with a gauze pad, and pricked with a lancet. A single drop of blood was pooled on the finger and wiped away. A second drop of blood was pooled on the finger and drawn onto a test strip in a Lactate Plus Analyzer (Nova Biomedical, Waltham, MA, USA). After lactate was measured, participants were moved back to the cycle ergometer to complete a two minute cool down at minimal resistance (~ 25 Watts). Criteria established for VO2max was that set forth by Howley et al. (Howley et al., 1995).
VT was determined by adjusting the graph plotting the ventilatory equivalent of O2 (VE/VO2) and the ventilatory equivalent for CO2 (VE/VCO2) from the Parvo Medic program as described by Gaskill et al (Gaskill et al., 2001).
Blood Draws
30
limiting their movements. After the third blood draw, the cannula was removed and pressure was directly applied to the puncture site for 1 minute after which a Band-Aid was placed.
Moderate Intensity Exercise Trial
Participants were fitted with a heart rate monitor and a respiratory mask connected to the
metabolic cart. The protocol used was modified from Bishop et al (2014). Participants began a
warm up period consisting of two minutes at 25 watts followed by two minutes at 50 watts at a
self-selected cadence. At the end of the warm up, resistance will be increased to the wattage at
which 90% VT occurred. If participant Wattage was set to be greater than 150 Watts, subjects
were also given 30 seconds at 100 Watts to avoid a resistance increase of greater than 100 Watts.
Participants cycled at this resistance until 86% VT was reached for two time points on the Parvo
cart set at five second average calculation. At this point, participants cycled for 10 minutes while
oxygen uptake and pulmonary ventilation were monitored to keep participants between 90-98%
VT. Respiratory gases were collected for the first 10 minutes of the trial followed by additional
five minute collections taken at 20 and 35 minutes. Resistance was adjusted so that the subject
remained within the 5% of the desired VT (Figure 2). Participants cycled without the respiratory
mask from minutes 10-20 and 25-35 of the trial. Resistance was not altered while the mask was
off. Participants were be allowed to drink water ad libitum while not wearing the respiratory
31 Figure 2. Protocol for moderate intensity exercise trial. Blood Analysis
Peripheral bound mononuclear cells (PBMCs) were isolated using SepMateTM-50 (Stemcell, Vancouver, BC Canada) as specified by the manufacture (Appendix A3). PBMCs were used for immune cell phenotyping to conduct analysis of MAIT cell profile.
MAIT cell phenotyping was prepared by direct immunofluorescence labeling of cell surfaces with mouse anti-human monoclonal antibodies. Cells were analyzed using flow cytometry (BD Biosciences, CA USA) and FlowJo CE software (Figure 3). Antibodies used included CD3 (APC-Cy7), CD4 (BV510), CD8 (AF700), CD14 (PE-Dazzle594), CD45 (PerCP-Cy5.5), CD66 (APC), CD69 (AF488), CD161 (BV605), TCR Vα7.2 (PE), CCR5 (BV421), CCR6 (BV650), CCR4 (PE-Cy7) all of which were from Biolegend except CD66 which was ordered from Nexus. Titration was run on all antibodies to determine optimal concentrations. Appropriate fluorescence minus one (FMO) controls were run. CD14 and CD66 was used in combination during gating to ensure desired lymphocyte population does not consist of
monocytes or neutrophils. AbC™ Total Antibody Compensation Bead Kit was used for CD69, CCR4, CCR5 and CCR6 compensation controls (Thermo Fisher Scientific, NC USA).
1) Warm Up 2 minutes at 25 Watts 2 minutes at 50 Watts Cycle at R90 until 90% VT is reached
2) Cycle for 10 minutes 3) Cycle for 10 minutes
Mask on
Mask off
4) Cycle for 5 minutes
3) Cycle for 10 minutes 4) Cycle for 5
minutes Mask off
32
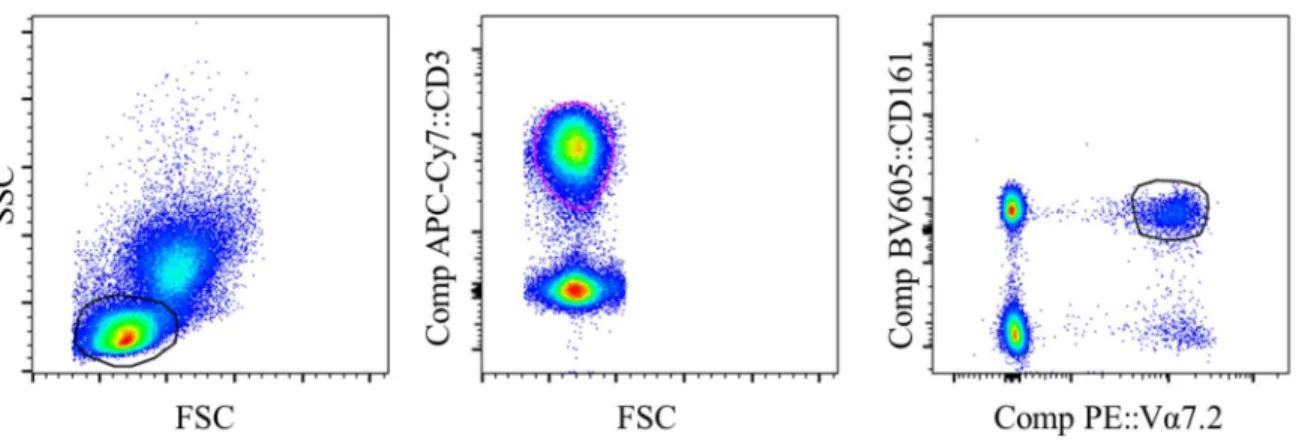
Figure 3. Gating strategy for MAIT cell identification. Side scatter-Forward scatter plot was used to select lymphocytes. T cells were identified using CD3+ cells. MAIT cells were identified as Vα7.2+CD161+ cells. Additional gates were then used to look at CD69, CCR4, 5 and 6
expression within MAIT cells and CD8+Vα7.2 CD161+ cells. Statistical Analyses
Data collected was analyzed with SPSS Statistics version 21.0 (SPSS, IN., Durham, NC,
USA). The α level was set a priori for all statistical procedures at α=0.05. Descriptive statistics
were used to summarize subject characteristics and values were reported as mean ± SD. A
one-way, repeated measures ANOVA was used to compare MAIT cell counts, activation marker
expression and homing marker expression between three separate time points: pre-exercise,
immediately after exercise, one hour after exercise. Bonferroni post-hoc analysis was used.
Additionally, a Pearson product-moment correlation coefficient was calculated comparing MAIT
33 CHAPTER IV
RESULTS Participants
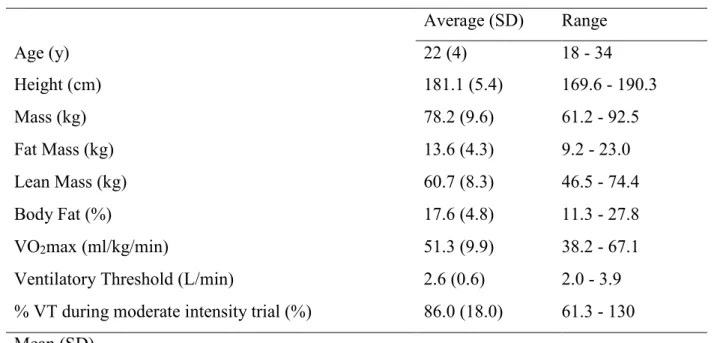
20 young, healthy males with moderate aerobic fitness completed the study (Table 3). The 40 minute acute bout was completed with an average power output of 152 (30) Watts and at 63.5% (5.3) of VO2max and 86% (18.0) of ventilatory threshold.
Table 3. Participant characteristics (n=20).
Average (SD) Range
Age (y) 22 (4) 18 - 34
Height (cm) 181.1 (5.4) 169.6 - 190.3
Mass (kg) 78.2 (9.6) 61.2 - 92.5
Fat Mass (kg) 13.6 (4.3) 9.2 - 23.0
Lean Mass (kg) 60.7 (8.3) 46.5 - 74.4
Body Fat (%) 17.6 (4.8) 11.3 - 27.8
VO2max (ml/kg/min) 51.3 (9.9) 38.2 - 67.1
Ventilatory Threshold (L/min) 2.6 (0.6) 2.0 - 3.9
% VT during moderate intensity trial (%) 86.0 (18.0) 61.3 - 130 Mean (SD)
Changes in lymphocytes and conventional T-cells
34
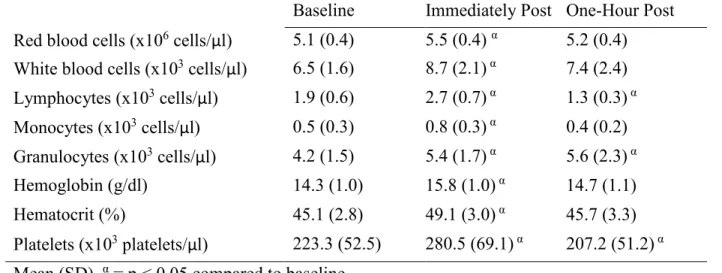
Table 4. Complete blood count completed on whole blood
Baseline Immediately Post One-Hour Post Red blood cells (x106 cells/μl) 5.1 (0.4) 5.5 (0.4) α 5.2 (0.4) White blood cells (x103 cells/μl) 6.5 (1.6) 8.7 (2.1) α 7.4 (2.4) Lymphocytes (x103 cells/μl) 1.9 (0.6) 2.7 (0.7) α 1.3 (0.3) α Monocytes (x103 cells/μl) 0.5 (0.3) 0.8 (0.3) α 0.4 (0.2) Granulocytes (x103 cells/μl) 4.2 (1.5) 5.4 (1.7) α 5.6 (2.3) α Hemoglobin (g/dl) 14.3 (1.0) 15.8 (1.0) α 14.7 (1.1)
Hematocrit (%) 45.1 (2.8) 49.1 (3.0) α 45.7 (3.3)
Platelets (x103 platelets/μl) 223.3 (52.5) 280.5 (69.1) α 207.2 (51.2) α Mean (SD). α = p < 0.05 compared to baseline
36
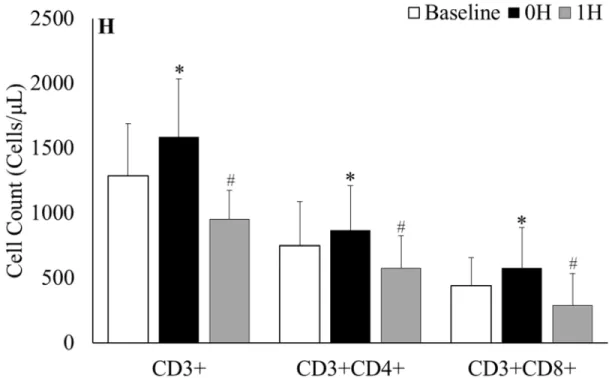
Figure 4. CD3+ T-cells gated on lymphocytes at A) baseline, B) 0h and C) 1h after sub-maximal aerobic
exercise. CD4+ and CD8+ T-cells gated on CD3+ T-cells at D) baseline, E) 0h and F) 1h after sub-maximal
aerobic exercise. Representative FACS plots were selected from the participant with percent of T-cells
closest to mean baseline value for the respective population while the 0h and 1h plots are from the same
participant. G) Percent change in classic T-cell populations, H) Absolute classic T-cell counts; * = p < 0.05
from all time points, # = p < 0.05 from baseline
Changes in MAIT cells
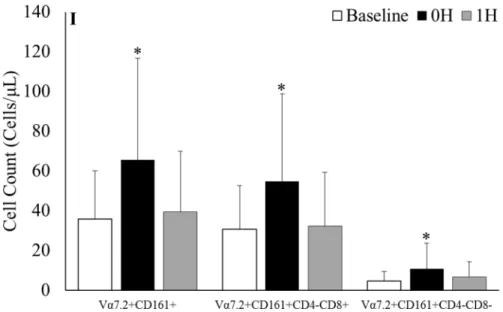
37
CD8+ MAIT cell (84.1% (70.6); p = 0.002) and DN MAIT cell (185.7% (474.7); p = 0.036) counts from baseline to 0h before returning to baseline values at 1h (Figure 5I).
38
Figure 5. MAIT cells gated on CD3+ T-cells at A) baseline, B) 0h and C) 1h after sub-maximal aerobic
exercise. CD4+ and CD8+ gated on MAIT cells at D) baseline, E) 0h and F) 1h after sub-maximal aerobic
exercise. Representative FACS plots were selected from the participant with percent of MAIT cells closest
to mean baseline value for the respective population while the 0h and 1h plots are from the same participant.
I) Absolute MAIT cell counts and the respective subpopulations before and after acute exercise; * = p <
0.05 from all time points.
39
Figure 6. Percent of CD3+CD8+ cytotoxic T-cells comprised of MAIT cells. MAIT cells were gated on
CD3+CD8+ cells. * = p < 0.05 from baseline to 0h, # = p < 0.05 from baseline to 1h
Chemokine receptor and activation marker alterations
40
Figure 7. Chemokine receptors gated on MAIT cells at baseline, 0h and 1h for A) CCR4, B) CCR5 and C)
CCR6. Representative FACS plots were selected from the participant with percent of MAIT cells closest
41
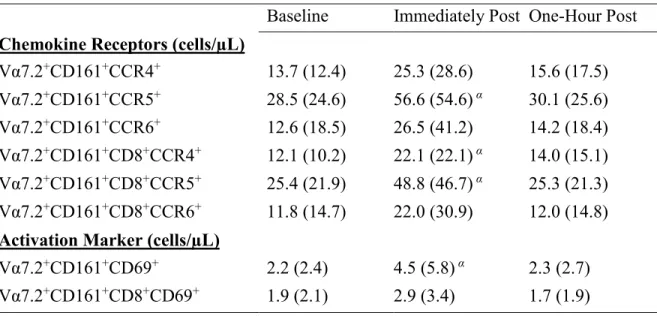
Table 5. Chemokine and activation marker cell counts during submaximal exercise. Baseline Immediately Post One-Hour Post Chemokine Receptors (cells/µL)
Vα7.2+CD161+CCR4+ 13.7 (12.4) 25.3 (28.6) 15.6 (17.5) Vα7.2+CD161+CCR5+ 28.5 (24.6) 56.6 (54.6) α 30.1 (25.6) Vα7.2+CD161+CCR6+ 12.6 (18.5) 26.5 (41.2) 14.2 (18.4) Vα7.2+CD161+CD8+CCR4+ 12.1 (10.2) 22.1 (22.1) α 14.0 (15.1)
Vα7.2+CD161+CD8+CCR5+ 25.4 (21.9) 48.8 (46.7) α 25.3 (21.3) Vα7.2+CD161+CD8+CCR6+ 11.8 (14.7) 22.0 (30.9) 12.0 (14.8) Activation Marker (cells/µL)
42
Because of the high percentage of MAIT cells expressing CCR5 and CCR6 (ceiling effect), mean fluorescence intensities were measured. Mean fluorescence intensities for CCR4, CCR5 and CCR6 did not change over any time point (Figure 8).
Figure 8. Mean fluorescence intensities of chemokine receptors CCR4, CCR5 and CCR6 at baseline, 0h
and 1h after exercise. MFI histograms were determined from FACS plots in Figure 7.
43
in CD69+ MAIT cell counts by 89.7% (117.9) (p = 0.031) before returning to baseline values during recovery (Table 5).
Figure 9. CD69+ cells gated on MAIT cells at A) baseline, B) 0h and C) 1h after sub-maximal aerobic
exercise. Representative FACS plots were selected from the participant with percent of CD69+ MAIT cells
closest to mean baseline value for the respective population while the 0h and 1h plots are from the same
participant.
Body composition and cardiopulmonary correlations with MAIT cells
44
CHAPTER V DISCUSSION
The purpose of this study was to examine changes in Vα7.2+CD161+ MAIT cell counts and chemokine expression (CCR4, CCR5, CCR6) and activation markers (CD69) with acute moderate intensity aerobic exercise. We report for the first time that MAIT cells and their subpopulations (CD8+ and DN) significantly increase in number immediately after exercise and follow a biphasic response by returning to baseline values after 1h of recovery. Additionally, absolute number of MAIT cells that expressed CCR4, CCR5 or CD69 followed the biphasic response after exercise whereas exercise-induced changes in CCR6 were less pronounced. Another novel finding within this study was MAIT cells are preferentially mobilized within the total T cell and also the CTL populations, demonstrating significant increases in the proportion of cells at 0h and 1h after exercise. This suggests that MAIT cells are rapidly mobilized within the exercise-induced lymphocytosis but may migrate/undergo egress more slowly in the 1h after exercise, which is consistent with the constant chemokine expression levels. While it is unclear if the transient rise in MAIT cell numbers over time results in functional change or tissue accumulation, it supports previous work and raises the possibility that exercise has the potential to heighten mucosal immunity in patient populations presenting with low MAIT cell counts.
45
respectively. Additionally, MAIT cell counts follow a biphasic response with counts at 1h matching baseline values while CD3+, CD3+CD4+ and CD3+CD8+ cell counts drop below baseline values during recovery. Several possibilities may exist for the higher MAIT cell percentage despite the decline in absolute cell number at 1h. The heightened percentage of MAIT cells within the CD3+ population could be due to decreased blood flow to mucosal tissue. It is well established that during moderate intensity exercise blood flow to the small intestine and kidney are reduced to facilitate oxygen delivery to active tissue (van Wijck et al., 2012; Tidgren et al., 1991). Accordingly, with less access to their residential tissue, MAIT cells would remain in the blood longer and account for the increased percentage immediately after exercise.
An additional hypothesis for the kinetic difference between MAIT cells and other CD3+ subpopulations could be due to the relative expression of adhesion proteins on MAIT cells. The high responsiveness of natural killer cells to exercise has been reported to potentially be due to modulation of adhesion molecules such as CD44 by exercise-induced catecholamine release (Nagao et al., 2000). Both murine MAIT cells and human MAIT cells have been shown to express CD44 (Martin et al., 2009; Sugimoto et al., 2015). Alternately, IL-18 stimulated MAIT cells upregulate very late antigen-4, an integrin that mediates T-cell migration through its interaction with vascular cell adhesion molecule-1 (Chiba et al., 2017). As such, CD44+ MAIT cell and other adhesion marker response to acute aerobic exercise is a potential target for future research to determine the mechanism behind elevated MAIT cell proportions after exercise.
46
exercise induced lymphocytosis that was several fold (137% vs. 35%) greater than the current study, despite larger changes in MAIT cell % (Fig 5). This difference in MAIT cell count changes at different exercise intensities supports previous literature which suggests that exercise intensity plays a key role in determining the extent of lymphocyte response to exercise (Nieman, 1992).
Our preliminary evidence indicates MAIT cell numbers increase with exercise (Hanson unpublished), but it is unclear if these cells undergo any functional changes. MAIT cells migrate to specific mucosa via expression of certain chemokines and we wanted to determine if acute exercise would increase chemokine expression. Increased CCR4+ MAIT cell counts and CCR5+ MAIT cell counts were observed after exercise with a tendency for elevated CCR6 MAIT cell counts. However, contrary to our hypothesis, there was no change in the frequency of CCR5 MAIT cells or CCR5 antigen density. The chemokine expression for CCR5+ MAIT cells in the current study (81.3%) was in line to previous work (Saeidi et al., 2015), while the percent of MAIT cells expressing CCR6+ (31.6%) was below previously reported work (Saeidi et al., 2015; Cosgrove et al., 2013). To investigate a possible ceiling effect, MFI was examined in these cells with no change in chemokine antigen expression with exercise. In healthy Individuals, chemokine expression and MAIT cell function may be optional and it is only with co-infections such as HIV/TB that decreased CCR6+ expression on MAIT cells is observed (Saeidi et al., 2015). Additionally, moderate intensity exercise may be insufficient to alter chemokine expression or one-hour after exercise is likely too soon to observe increases in new cell surface proteins.
47
al., 2010; Wilgenburg et al., 2016). While our CD69+ MAIT cell numbers increased after exercise, there was no change in the percentage of MAIT cells expressing CD69 or the total amount of CD69 being expressed, confirming previous work reported no change in CD69 expression in lymphocyte subpopulations (Green et al., 2003; Millard et al., 2013). The lack of stimulation precludes us from determining whether MAIT cell activation may increase after moderate intensity exercise.
It is also important to note that the percent of MAIT cells remains elevated while the total percentage of CTLs decreases during recovery (Figure 4). Previous literature reporting CD3+CD8+ T-cell responses to exercise have failed to take into account MAIT cell changes within the population. CD3+CD8+Vα7.2+CD161+ make up approximately 10% of all CTLs (Dusseaux, Martin et al. 2011, Walker, Kang et al. 2012, Cosgrove, Ussher et al. 2013, Fergusson, Huhn et al. 2016). While we report a slightly lower percentage at baseline (6.8%), increased proportions of MAIT cells within the CTL population at 0h and 1h after acute moderate intensity exercise contradicts our initial findings (Hanson et al unpublished). Previous research has found that CD8+ cells with high tissue-migrating potential are preferentially mobilized during exercise (Campbell et al., 2009; Simpson et al., 2007). In particular, Campbell et al. identified CD45RA- CD8+ cells, which mature MAIT cells express, as a subpopulation which is elevated after exercise (Campbell et al., 2009). Other cells within the CTL population may migrate into tissues which would explain the increase from 8.8% to 10.3% from 0h to 1h after moderate intensity exercise (Figure 6).
48
should be aware of this issue and future studies should be designed to provide more direct evidence of these effects now that it has been identified in multiple studies.
While MAIT cell chemokine and activation expression appears to be unaffected by moderate intensity aerobic exercise in a healthy population, these markers have been shown to be affected in diseased populations. Individuals with asthma, HIV, obesity and diabetes have all been shown to have decreased MAIT cell counts (Hinks et al., 2015; Cosgrove et al., 2013; Magalhaes et al., 2015). Furthermore, CCR6 and CD69 expression on MAIT cells has been altered in individuals affected with HIV and dengue virus (Cosgrove et al., 2013; Wilgenburg et al., 2016). Regular moderate intensity exercise may be a means to boost delivery of MAIT cells in these populations and the altered environmental factors associated with those diseases may contribute to chemokine alterations caused by exercise.
There were some limitations involved in this study. One limitation was the choice to investigate MAIT cell response in men only and this was done because there is some evidence that estrogen status may alter immune response (Tiidus et al., 2008). Another potential limitation to the study was the allowance of varying exercise modes to count towards moderate intensity exercise. Some participants participated exclusively in resistance training and were unable to maintain the Wattage selected throughout the moderate intensity exercise bout. However, these participants stayed within the desired VT range throughout the bout as determined by the VO2max test.
49
50
REFERENCES
Annibali, V., Ristori, G., Angelini, D. F., Serafini, B., Mechelli, R., Cannoni, S., . . . Salvetti, M. (2011). CD161(high)CD8+T cells bear pathogenetic potential in multiple sclerosis. Brain, 134(Pt 2), 542-554. doi:10.1093/brain/awq354
Battaglini et al., Prediction and Uncertainty in Cycling Performance" Unpublished, IRB #14-0967
Bishop, N. C., & Gleeson, M. (2009). Acute and chronic effects of exercise on markers of mucosal immunity. Front Biosci (Landmark Ed), 14, 4444-4456.
Bishop, N. C., Hayashida, H., Clark, M., Coombs, C., Miller, S., & Stensel, D. J. (2014). Effect of acute and regular exercise on growth hormone secretagogue receptor-1a expression in human lymphocytes, T cell subpopulation and monocytes. Brain Behav Immun, 39, 172-179. doi:10.1016/j.bbi.2013.09.017
Blannin, A. K., Robson, P. J., Walsh, N. P., Clark, A. M., Glennon, L., & Gleeson, M. (1998). The effect of exercising to exhaustion at different intensities on saliva immunoglobulin A, protein and electrolyte secretion. International Journal of Sports Medicine, 19(8), 547-552. doi:10.1055/s-2007-971958
Brutkiewicz, R. R., Bennink, J. R., Yewdell, J. W., & Bendelac, A. (1995). TAP-independent, beta 2-microglobulin-dependent surface expression of functional mouse CD1.1. J Exp Med, 182(6), 1913-1919.
Campbell, J.P., Riddell, N.E., Burns, V.E., Turner, M., van Zanten, J.J.C.S.V., Dryason, M.T., Bosch, J.A. (2009). Acute exercise mobilises CD8+ T lymphocytes exhibiting an effector-memory phenotype. Brain Behav. Immun, 23, 767–775
Cosgrove, C., Ussher, J.E., Rauch, A., Gartner, K., Kurioka, A…Klenerman, P., (2013). "Early and nonreversible decrease of CD161++ /MAIT cells in HIV infection." Blood , 121(6): 951-961.
Chiba A, Tamura N, Yoshikiyo K, et al. Activation status of mucosal-associated invariant T cells reflects disease activity and pathology of systemic lupus erythematosus. Arthritis
Research & Therapy. 2017;19:58. doi:10.1186/s13075-017-1257-5.
Dusseaux, M., Martin, E., Serriari, N., Peguillet, I., Premel, V., Louis, D., . . . Lantz, O. (2011). Human MAIT cells are xenobiotic-resistant, tissue-targeted, CD161hi IL-17-secreting T cells. Blood, 117(4), 1250-1259. doi:10.1182/blood-2010-08-303339
Fahlman, M. M., & Engels, H. J. (2005). Mucosal IgA and URTI in American college football players: a year longitudinal study. Med Sci Sports Exerc, 37(3), 374-380.
51
A. Folgori, E. Barnes, C. B. Willberg, J. E. Ussher and P. Klenerman (2016).
"CD161(int)CD8+ T cells: a novel population of highly functional, memory CD8+ T cells enriched within the gut." Mucosal Immunol, 9(2): 401-413
Gabriel, H., Schwarz, L., Born, P., & Kindermann, W. (1992). Differential mobilization of leucocyte and lymphocyte subpopulations into the circulation during endurance exercise. Eur J Appl Physiol Occup Physiol, 65(6), 529-534.
Gaskill, S. E., Ruby, B. C., Walker, A. J., Sanchez, O. A., Serfass, R. C., & Leon, A. S. (2001). Validity and reliability of combining three methods to determine ventilatory threshold. Medicine and Science in Sports and Exercise, 33(11), 1841-1848.
Genergal Physical Activities Defined by Level of Intensity
http://www.cdc.gov/nccdphp/dnpa/physical/pdf/PA_Intensity_table_2_1.pdf
Gleeson, M., McDonald, W. A., Pyne, D. B., Clancy, R. L., Cripps, A. W., Francis, J. L., & Fricker, P. A. (2000). Immune status and respiratory illness for elite swimmers during a 12-week training cycle. International Journal of Sports Medicine, 21(4), 302-307. doi:10.1055/s-2000-313
Gleeson, M., McDonald, W. A., Pyne, D. B., Cripps, A. W., Francis, J. L., Fricker, P. A., & Clancy, R. L. (1999). Salivary IgA levels and infection risk in elite swimmers. Med Sci Sports Exerc, 31(1), 67-73.
Gold, M. C., Cerri, S., Smyk-Pearson, S., Cansler, M. E., Vogt, T. M., Delepine, J., . . .
Lewinsohn, D. M. (2010). Human mucosal associated invariant T cells detect bacterially infected cells. PLoS Biol, 8(6), e1000407. doi:10.1371/journal.pbio.1000407
Gold, M. C., Eid, T., Smyk-Pearson, S., Eberling, Y., Swarbrick, G. M., Langley, S. M., . . . Lewinsohn, D. M. (2013). Human thymic MR1-restricted MAIT cells are innate
pathogen-reactive effectors that adapt following thymic egress. Mucosal Immunol, 6(1), 35-44. doi:10.1038/mi.2012.45
Gold, M. C., McLaren, J. E., Reistetter, J. A., Smyk-Pearson, S., Ladell, K., Swarbrick, G. M., . . . Lewinsohn, D. M. (2014). MR1-restricted MAIT cells display ligand discrimination and pathogen selectivity through distinct T cell receptor usage. J Exp Med, 211(8), 1601-1610. doi:10.1084/jem.20140507
Green, K.J., Rowbottom, D.G., Mackinnon, L.T. (2003). Acute exercise and T-lymphocyte expression of the early activation marker CD69. Medicine & Science in Sports & Exercise, 35 (4), 582-588.
Hanson, E.D, E. Danson, Catriona V. Nguyen Robertson, Jackson J. Fyfe, Nigel K. Stepto, & Samy Sakkal. (unpublished). Mucosal associated invariant T cells are increased following maximal aerobic exericse in healthy young males.