ELECTRON TRANSFER REACTIONS AT SENSITIZED NANOCRYSTALLINE METAL OXIDE INTERFACES
Brian N. DiMarco
A dissertation submitted to the faculty of The University of North Carolina at Chapel Hill in partial fulfillment of the requirements for the degree of doctor of Philosophy in the
Department of Chemistry.
Chapel Hill 2017
Approved by:
Gerald J. Meyer
Jillian L. Dempsey
Alexander J. M. Miller
Joanna M. Atkin
iii ABSTRACT
Brian N. DiMarco: Electron Transfer Reactions at Sensitized Nanocrystalline Metal Oxide Interfaces
(Under the Direction of Gerald J. Meyer)
The growing need for energy has spurred interest in the development of technologies
that can directly convert solar irradiance into useful forms of energy. Dye-sensitized solar cells
are a promising solar energy conversion technology due to the relatively low cost of the
materials used and the tunability of the absorption profiles of the devices. The latter makes
them amendable to integration into aesthetically appealing devices that can efficiently
generating power. This thesis is focused on understanding the fundamentals of the electron
transfer reactions that occur within these devices. The initial chapter introduces the
environmental challenges facing humanity as a result of our current means of generating
power. A review of the operation of a DSSCs and several important fundamental aspects are
also introduced. Chapter 2 is focused on the influence that small structural changes have on
the rate of electron self-exchange between ruthenium polypyridyl complexes anchored at
nanocrystalline TiO2 interfaces. Chapter 3 seeks to understand the role of Lewis acidic cations
during interfacial electron transfer to solution phase electron acceptors. Chapter 4 compares
the rates of interfacial electron to a pair of nearly identical triphenylamine acceptors, where
one of the acceptors is functionalized with a phosphonic acid functional group that allowed it
to anchored to the TiO2 interface. This provided insight into the influence of surface anchoring
iv
recombination reaction to series of substituted triphenylamine (TPA). The substitutions
afforded and ~ 0.5 V change in the TPA+/0 reduction potential, which was thought vary the
driving force by the same amount. Chapter 6 compares charge recombination rates from TiO2
and SnO2 nanocrystalline thin films. Similar to Chapter 3, the role of Lewis acidic cations
present in the external electrolyte was also investigated. Finally, Chapter 7 assess the role of
electric fields and dipole moments on the injection and emissive properties of Ru polypyridyl
v
ACKNOWLEDGMENTS
I would first like to thank my parents, siblings and extended family for their support
throughout this journey. I would not be where I am today without them. I am forever indebted
to Prof. Cliff J. Timpson for his guidance while I attended RWU, and his friendship since
graduation. I am forever in debt to the friendship and mentorship I received from the senior
lab members in the Meyer group when I began. Darren, Atefeh, Will, Ryan, Ke and Erinn
provided me with wonderful insights and training that were essential to my success. I must
also thank Tim and Evan who help share the angst of the move from Hopkins to Chapel Hill,
and to Wes and Tyler for being great lab mates when we arrived. I have been fortunate enough
to work with several phenomenal scientists during my tenure in the Meyer group. Renato,
Ludo, Cassie and Goucan each provided their own unique insights to many of the studies within
this thesis, and greatly improved the quality of the work in the process. I’ve also had the
pleasure of mentoring and training many of new students who have joined the lab in recent
year. I feel strongly that each of them will contribute positively to our understanding of
chemistry. I also need to thank my friends Steve Davidowski, Ron Lankone, Justin
DeFrancisco and Justin Desrosiers for helping me to keep my sanity over the year with good
conversations, cold drinks and backpacking adventures. I am thankful for the guidance
provided to me by Dr. Jerry Meyer throughout my graduate career. I have thoroughly enjoyed
my time in this lab, and I attribute the positive atmosphere that we all enjoy to his leadership.
vi
support throughout the many challenges that we’ve both faced during our graduate careers. I
vii
TABLE OF CONTENTS
LIST OF FIGURES….………....x
LIST OF SCHEMES ……….……….………...xv
LIST OF TABLES...………...………...………..…....xvii
LIST OF EQUATIONS..………….………...xviii
Chapter 1: Global Energy Demands and the Rise of Dye Sensitized Solar Cells………1
1.1 Current Energy Demand and Sources………..1
1.2 Photovoltaic and the Rise of Dye Sensitized Solar Cells………....5
1.2.1 Interfacial Electric Fields……….11
1.2.2 Electron Transport.………..…15
1.2.3 Charge Recombination………18
1.3 Conclusions………22
Chapter 2: A Distance Dependence to Lateral Self-Exchange Across Nanocrystalline TiO2. A Comparative Study of Three Homologous RuIII/II Polypyridyl Compounds………23
2.1 Introduction………23
viii
2.3 Results………...34
2.4 Discussion...43
2.5 Conclusions………...49
Chapter 3: Cation Dependent Charge Recombination to Organic Mediators in Dye-Sensitized Solar Cells………..….…51
3.1 Introduction………51
3.2 Experimental………..53
3.3 Results………55
3.4 Discussion………..60
3.5 Conclusion………..64
Chapter 4: Electron Transfer at TiO2 Interface. A Comparative Study Between Free and Anchored Tri-Phenylamine (TPA) Redox Mediators……….………..65
4.1 Introduction………65
4.2 Methods and Materials………...66
4.3 Results and Discussion………...71
4.4 Conclusions………80
Chapter 5: Driving Force Dependent Charge Recombination to Solution Phase Triphenylamine Redox Mediators..………..….81
5.1 Introduction
………
81ix
5.3 Results………84
5.4 Discussion………..89
5.5 Conclusion………..93
Chapter 6: Influence of Lewis Acidic Cations and Phantom Electrons on Charge Recombination from Nanocrystalline SnO2 Thin Films………..………...95
6.1 Introduction………95
6.2 Results and Discussion………...96
6.3 Conclusions………..106
Chapter 7: Excited State Dipoles Oriented Parallel and Anti-Parallel to TiO2 Surface Electric Fields………107
7.1 Introduction………..107
7.2 Experimental………109
7.3 Results………..113
7.4 Discussion………119
7.5 Conclusion………126
x
LIST OF FIGURES
Figure 1.1: Atmospheric CO2 concentrations measured over the past 50 years.
Data taken from Ref 16……….3
Figure 1.2: Global average temperatures over the past 130 years. Data reprinted from Ref 12..3
Figure 1.3: Solar irradiance A.M. 1.5. The area shaded light gray can be absorbed by Si, while the dark gray can be absorbed by both Si and anatase TiO2. The dashed blue lines represent the
spectral response observed for a TiO2 thin film sensitized
with a champion Ru complex28………..6
Figure 1.4: Representation of the advancements in DSSCs. Taken from Ref 27.…..…….……7
Figure 1.5: Schematic representation of a dye sensitized solar cell. In this figure, S is the surface anchored sensitizer, while M is the solution phase redox mediators. The injection, kreg,
sensitizer regeneration, kreg and recombination reaction
to the redox mediator, krec, or oxidized sensitizer, krec2,
are shown……….……...………..…………..7
Figure 1.6: Representative current-voltage (IV) plot.……….………….…..………..….9
Figure 1.7: (A) Shown in orange are the residuals seen after spectral modeling of the raw data (purple) (B) Similar spectral feature observed after application of an electrochemical
bias. Figures adapted from Ref 64 ………….……….……….….…13 Figure 1.8: Transient absorption data where the electrons in the
substrate were monitored at 750 nm, while also monitored in the Stark effect. The Stark effect clearly decays in a region where there is minimal electron loss. Data taken
from Ref 76………..….…14
Figure 1.9: Lateral electron self-exchange between surface anchored
Ru chromophores. Adapted from Ref 95………...……16 Figure 1.10: Contributions from both the charge carrier diffusion
through/across the TiO2 and the electron transfer event
on the overall rate of recombination. Figure adapted
from Ref 56……….………...20
xi
for a nonadiabatic (dashed lines) or adiabatic (solid lines) self-exchange electron transfer reaction. The orange and green spheres represent Ru molecules in the encounter complex before, during, and after electron transfer. The blue spheres depict counter ions and exaggerates their location and movement during the electron transfer
process…...……….…….26
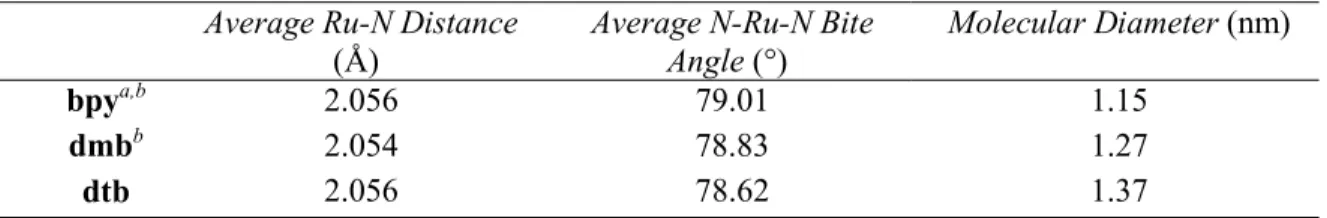
Figure 2.2: a) Crystal structure of [Ru(dmb)2(deeb)](PF6)2. b) Crystal
structure of [Ru(dtb)2(dcbH2)](ClO4)2. All hydrogen atoms
and anions are omitted for clarity purpose. Color code: Pink,
Ru; blue, N; red, O; gray, C.………...…….………..36
Figure 2.3: Normalized absorption spectra of compounds bpy, dmb, and dtb anchored to TiO2 in neat CH3CN (solid line) or in a 0.1 M
LiClO4 solution in CH3CN (dashed line). The TiO2 absorption
spectrum was subtracted out from the spectra of the surface-
functionalized films………...………..………..………36
Figure 2.4: Spectroelectrochemical oxidation of TiO2|dmb immersed in 0.1 M
LiClO4/CH3CN electrolyte. The inset plots the fraction of
oxidized or reduced compound as a function of applied potential.
Overlaid is a fit to a modified Nernst equation, Equation 2.5...38
Figure 2.5: Normalized absorption change measured after application of a potential sufficient to oxidize the indicated compounds plotted against the square root of time. Overlaid in gold is the fit based
on Equation 2.6.……….………...40
Figure 2.6: Representative cyclic voltammograms for dmb anchored to TiO2
immersed in 0.1 M LiClO4 in CH3CN at the indicated temperatures...………..…40
Figure 2.7: (A) Arrhenius plot for bpy, dmb, and dtb anchored to TiO2
describing the variation of DCV with inverse temperature as
obtained by cyclic voltammetry. Overlaid are the best fits to the Arrhenius equation. (B) The temperature dependence of kSE
as described by non-adiabatic Marcus theory (overlaid curves)...……...43
Figure 3.1: Steady-state UV-Vis absorbance of TiO2|Ru thin film submerged
in 0.1 M acetonitrile solutions of the indicated metal perchlorate salt………...…55
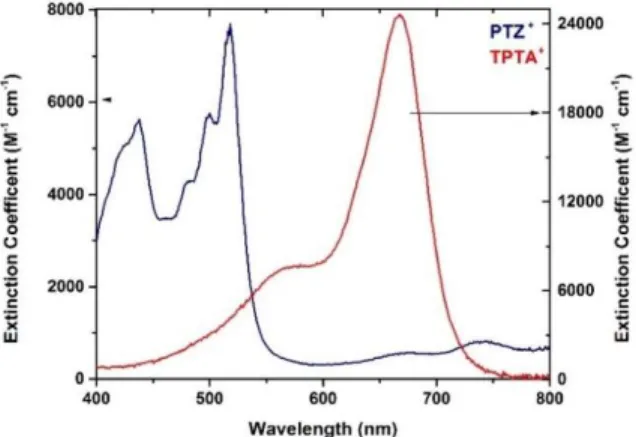
Figure 3.2: The visible absorption spectra of TPTA+ and PTZ+ in 0.1 M
NaClO4/CH3CN electrolyte....….………..………..………..………57
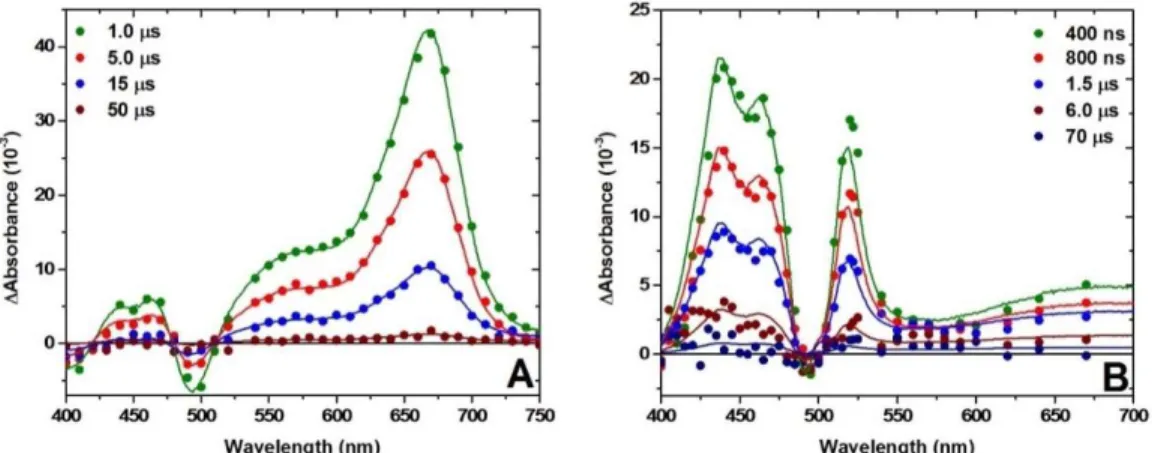
xii
film in a 0.1 M NaClO4/CH3CN electrolyte containing A) 25 mM
TPTA and B) 50 mM PTZ. Overlaid on the data as solid lines
are spectral simulations……….58
Figure 3.4: Single wavelength absorption changes measured after pulsed 532 nm laser excitation of a TiO2|Ru thin film in CH3CN solutions
with 0.1 M of the indicated metal perchlorate and A) 25 mM TPTA and B) 50 mM PTZ. Kinetics were monitored at 675 nm and 433 nm for TPTA+ and PTZ+ respectively. Fits to the KWW model are
overlaid on the data as solid yellow lines..………..………..…59
Figure 4.1: Structure of the ruthenium dye RuP, f-TPA and a-TPA used in this study...….66 Figure 4.2: Cyclic voltammograms performed in 0.1 M LiClO4 acetonitrile………..72
Figure 4.3: UV-Vis spectra of RuP sensitized TiO2 in neat ACN (black)
and 0.1 M LiClO4 CH3CN solution (red) as well as singly
oxidized f-TPA+ (blue) and a-TPA+ (green)……….73
Figure 4.4: Absorption changes observed after pulse 532 nm light irradiation of TiO2|RuP in the presence of 30 mM f-TPa (Blue scale) or
cofunctionalized with a-TPA (red scale) submerged in argon
saturated 0.1 M LiClO4 CH3CN.………...……...74
Figure 4.5: Single wavelength kinetics of f-TPA (a) and a-TPA (b) at various laser fluencies. Insets represent the abstracted rate using a stretched
exponential fitting versus absorption changes.. ...………....75
Figure 4.6: Single wavelength kinetics of f-TPA (a) and a-TPA (b) at various temperatures. Arrhenius plot (c) for f-TPA (blue
squares) and a-TPA (green circles)…..……….78 Figure 4.7: Schematic representation of the charge recombination processes
for a-TPA and f-TPA..………..………..………..………..………. ………80 Figure 5.1: Cyclic voltammograms performed for each TPA in acetonitrile solutions…..…85
Figure 5.2: Absorption spectra generated for TPA+ in acetonitrile electrolytes…………...86
Figure 5.3: Transient absorption spectra generated for TiO2|S submerged in
8 mM MeO-TPA at early (A) and late timescales (B)………...87
Figure 5.4: Transient absorption spectra generated after pulsed light
xiii
Figure 5.5: Recobination kinetics to TPA+. Overlaid are the best fits to these kinetic traces...89
Figure 5.6: Normalized recombination kinetics observed for Cl-TPA…..………...89
Figure 6.1: UV-Vis absorption changes for SnO2|Ru films submerged
in acetonitrile electrolytes. The spectral taking in LiClO4
and Mg(ClO4)2 were normalized relative to the sample in neat acetonitrile……...97
Figure 6.2: (A) Spectral changes observed after pulse light excitation of SnO2|Ru submerged in argon purge acetonitrile containing 0.1 M
LiClO4 and 0.25 M TBAI. (B) Comparison of spectral changes
2.5 s after excitation observed for TiO2 and SnO2 substrates in
the presence of 0.25 M TBAI and either 0.1 M
LiClO4 or Mg(ClO4)2……..……….…….99
Figure 6.3: Recombination kinetics to I3- monitored at 375 nm. Overlaid are the
best fits using a tri-exponential function.…………...100
Figure 6.4: Comparison between the absorption measure at 375 and 800 nm at 100 s…...102
Figure 6.5: Absorption comparison between I3- and TiO2 monitored ~100 s
after pulse light excitation. Approximately 20 s of data was averaged around this time point to improve signal to noise, and
the error bars represent the observed standard deviation in this measurement….103
Figure 7.1: Steady-state absorption and normalized photoluminescence (PL) spectra of A) Ru(dtb)2(dcb)/TiO2 and B) Ru(btfmb)2(dcb)/TiO2
in neat acetonitrile and in the presence of 0.1 M perchlorate acetonitrile solutions. Steady-state difference absorption spectra (ΔAss) of C) Ru(dtb)2(dcb)/TiO2 and D) Ru(btfmb)2(dcb)/TiO2
in the indicated perchlorate acetonitrile solutions………...114
Figure 7.2: Steady-state PL spectra of A) and B) Ru(dtb)2(dcb)/TiO2
and C) Ru(btfmb)2(dcb)/TiO2 in 0.1 M LiClO4 acetonitrile at
the indicated applied potentials………..………..………..……...…………116
Figure 7.3: The PL intensity maximum wavelength of A) Ru(dtb)2(dcb)/TiO2
and B) Ru(btfmb)2(dcb)/TiO2 measured in the five 0.1 M cation
perchlorate acetonitrile solutions as a function of applied potential. The dotted line is PL center wavelength measured for Ru(dtb)2(dcb)/TiO2
andRu(btfmb)2(dcb)/TiO2 in neat acetonitrile. The relative PL
intensities of C) Ru(dtb)2(dcb)/TiO2 and D) Ru(btfmb)2(dcb)/TiO2 in
xiv
and the corresponding, more negative potential PL bands, were scaled relative to the >200 mV band. The black circles in A and C are
from [Ru(dtb)2(dcb)]2+ anchored to ZrO2 in Li+ solution………...……….117
Figure 7.4: Representative time-resolved PL of Ru(dtb)2(dcb)/TiO2 in A) Li+
and B) Mg2+ acetonitrile solutions at the indicated applied potentials. The
black lines are from fitting with Equation 2 where the first-order rate constant was held constant and τ2 =1/k2 was determined through
global fits of the time-resolved data. The insets show τ2 at each
xv
LIST OF SCHEMES
Scheme 1.1: Commonly used champion sensitizers………...……..10
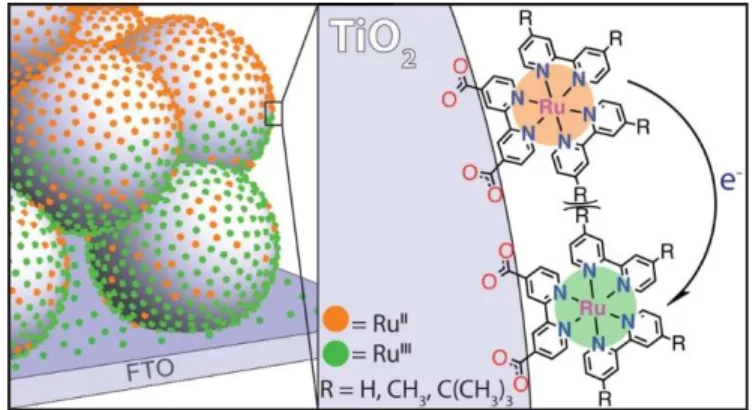
Scheme 2.1: Illustration of lateral intermolecular self-exchange electron transfer across anatase TiO2 nanocrystallites initiated at the fluorine-doped
tin oxide (FTO) substrate…….……….………...……...24
Scheme 2.2: Chemical Structure of the Molecules Used in this Hole Hoping Study……….28
Scheme 2.3: An idealized representation of three surface functionalized anatase layers on an FTO substrate during a chronoabsorptometry (CA) experiment. At time t0 all of the ruthenium compounds are in the
formal oxidation state of II. After a potential step 500 mV more positive than the formal E°(RuIII/II) reduction potential, the FTO
substrate oxidizes the RuII compounds present on the FTO surface
followed by self-exchange ‘hopping’ across the nanocrystalline TiO2
surface. A moving front of oxidized dyes nearly equidistant from the FTO substrate is observed at t > t0. At longer times t >> t0 all the
molecules within the mesoporous thin film are oxidized. The
semi-infinite diffusion boundary approximation restricts data analysis to about 60% oxidation of the thin film. In cyclic voltammetry
experiments that are now shown, only about 5% of the film is oxidized……...46
Scheme 3.1: Organic redox mediators. ………...53
Scheme 3.2: Comparison of the redox potentials of the mediators employ, and the energetics of the distribution of trap states in TiO2 when
different cations are employed. Reduction potentials for I3- /(I2-,I)
and I/I- are taken from reference. The latter potential is relevant to
sensitizer regeneration……….63
Scheme 5.1: Structure of the triphenylamines used throughout these studies………...82
Scheme 5.2: The dotted lines below the colored areas represent the energy
threshold required for efficient recombination………...92
Scheme 6.1: Structure of [Ru(dtb)2(dcb)]2+………..………...97
Scheme 6.2: Comparison of the I3- reduction potential and the distribution of
optically active electron accepting states for SnO2 or TiO2 in Li+
xvi
xvii
LIST OF TABLES
Table 2.1. Selected Crystal Structure Parameters for a Series of Ru Polypyridyl Compounds.36
Table 2.2. Selected Spectral, Electrochemical, and Film Parameters for the
CompoundsStudied………...38
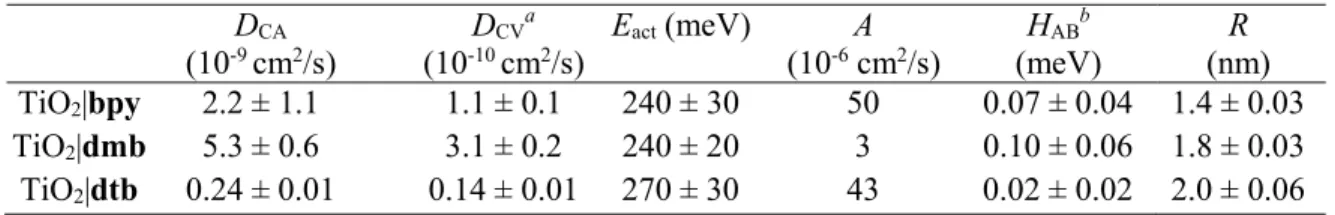
Table 2.3. Apparent Diffusion Coefficients and Marcus Self-Exchange Parameters
for Surface Anchored Ruthenium Compounds………...40
Table 3.1: Rate constants abstracted from KWW fits to the time resolved absorption data…59 Table 4.1: Electrochemical and photophysical properties of RuP, a-TPA
and f-TPA. Electrochemical data are recorded in 0.1M LiClO4
CH3CN solution whereas photophysical data are recorded in argon
saturated CH3CN………72
Table 5.1: Summary of electrochemical, spectroscopic and kinetic data……….86
Table 6.1: Values obtained from tri-exponential fit to recombination data………101
Table 7.1: Photophysical and Electrochemical Properties of Ru(dtb)2(dcb)/TiO2
xviii
LIST OF EQUATIONS
Equation 1.1: Light harvesting efficiency...9
Equation 1.2: The diode equation ...10
Equation 1.3: Molecule dipole moment determined from an absorbance shift...13
Equation 1.4: The Kohlraush-Williams-Watts function...….19
Equation 1.5: Diffusional and electron transfer contributions to observed rate constants...21
Equation 2.1:Non-adiabatic Marcus theory.………...25
Equation 2.2: Determination of surface coverage from absorbance….….………33
Equation 2.3: Surface concentration based on calculated surface coverage...33
Equation 2.4: Intermolecular distance based on surface concentration………….………...33
Equation 2.5: Modified Nernst equation …...………39
Equation 2.6: Apparent electron diffusion coefficient - absorbance……..………39
Equation 2.7: Apparent electron diffusion coefficient – current density...………41
Equation 2.8: Arrhenius equation for electron self-exchange...………..41
Equation 2.9: Electron self-exchange rate………..42
Equation 2.10:Non-adiabatic Marcus theory ………....42
Equation 3.1:The Kohlraush-Williams-Watts function...………..58
Equation 3.2: Average KWW rate constant.…..………59
Equation 3.3: Recombination reaction to an organic acceptor...60
Equation 4.1:Recombination reaction to a triphenylamine acceptor………….…………....75
Equation 4.2: A Sum ofKohlraush-Williams-Watts functions………..…………76
Equation 4.3: Average KWW rate constant …..………76
Equation 5.1: A Sum ofKohlraush-Williams-Watts functions…..………88
Equation 5.2: Average KWW rate constant …………..………88
Equation 6.1: Determination of surface coverage from absorbance ….………98
Equation 6.2: Tri-exponential fitting function...………..101
Equation 6.3: Average rate constant from tri-exponential fit………...101
Equation 6.4: Observed extinction coefficient based on transient absorption data ……….103
xix
Equation 7.2: Excited-state reduction potential Ru(II*/+)………..112
Equation 7.3: Parallel first- and second-order kinetic model……….………..118
Equation 7.4: Electron excited-state localization: [Ru(dtb)2(dcb)]2+…….………..119
Equation 7.5:Electron excited-state localization: [Ru(btfmb)2(dcb)]2+….………..120
Equation 7.6: Onsager theory of geminate recombination….………..124
Equation 7.7: Field dependent disassociation probability.…….………..124
1
Chapter 1: Global Energy Demands and the Rise of Dye Sensitized Solar Cells
1.1 Current Energy Demand and Sources
As the world’s population continues to grow and more nations increase their standard
of living, so too will our global energy demands.1 Total energy production generated globally
was 1.61 x 10⁸ kWh in 2012, with this value being expected to increase to 1.84 x 108 kWh by
2020, and 2.39 x 108 kWh by 2040, representing an approximate 40% increase in power
consumption.1 The ability to meet future energy demands with sustainable forms of energy
production represents one of the largest challenges currently facing humanity as it is becoming
abundantly clear that current means of energy production, mainly the burning of fossil fuel, is
unsustainable. The best course of action is to develop a diverse energy portfolio that can largely
eliminate our current dependence on fossil fuels.
Large man-made disasters resulting from fossil fuel collection and distribution are
numerous, having both short and long term environmental impacts.2 The scale of these
disasters also seems to be increasing with time. As an example, the Exxon-Valdez oil spill of
1989 resulted in the release of an estimated 1.1 million gallons crude oil into Prince Williams
Sound, and was the largest spill on record at the time. The environmental impacts of this spill
are still being assessed even today. More recently, the Deepwater Horizon spill of 2013 spilled
more than 210 million gallons of oil into the Gulf of Mexico, dwarfing the Exxon-Valdez spill.
Much like the Exxon-Valdez spill, it will likely be years before the damage from this spill can
2
operate in more remote and demanding environments. These sorts of spills will likely occur
more regularly as more easily accessible sources become scarce, driving exploration into
harsher and more demanding environments.
The burning of fossil fuels leads to the release of gaseous pollutants, heavy metals and
particulate matter that are all known to have a negative impact on human health.4,5 However,
it could be argued that main problem with all fossil fuel based energies is the release of CO2
in enormous quantities.6 It has been estimated that between 0.5 and 1 kg of CO
2 is released
per kilowatt hour (kWh) of energy generated depending on the source.4 In 2015, the US energy
sector consumed enough fossil fuels to release an estimated 1.9 x 10¹² kg of CO
2 into the
atmosphere.4 Despite the enormous size of the atmosphere, estimated to be 5 x 10¹⁸ kg7, there
is growing evidence that the rate at which fossil fuels are burned is having an impact on the
atmospheric CO2 concentrations. Theoretically, increased atmospheric CO2 can lead to
increased global temperatures by trapping thermal energy through a process known as the
greenhouse effect.8 There has been increasing experimental evidence of such a link between
global temperatures and atmospheric CO2 concentrations. For example, Antarctic ice cores
contain representative snap-shots of global atmospheric conditions through trapped bubble of
gas, while temperatures can be related to the 18O/16O isotopic ratio seen in the frozen water.9
Based on these data, a correlation between CO2 concentrations and global temperature have
been made, in agreement with predictions based on the greenhouse effect.10,11
Contemporary atmospheric CO2 concentrations were first measured in the late 19th
century, which were found to be 292 ppm.8 Since these initial measurements, a gradual increase
in the atmospheric CO2 concentration has been observed, with recent estimates placing
3
temperatures have also been observed over this period, Figure 1.2, in agreement with the
correlation made from ice core data.12 Concerningly, small changes in phenology, or the timing
of seasonal ecological activities such as migration, have been observed over the past few
decades and are often attributed to increased global temperatures.13 Such changes have the
potential to cause massive rates of extinction in animals that rely on seasonal timing for mating,
hibernation etc.14,15 In order to mitigate changes in the climate, drastic and rapid changes to
our energy production methods are needed.
Figure 1.1: Atmospheric CO2 concentrations measured over the past 50 years. Data take from ref 16.
4
Currently, only 18.9% of the global energy demands are met with non-fossil fuel
sources, with biofuels and nuclear taking the largest percentages at 10.3% and 4.8%
respectively1. However, neither of these sources is ideal. Though there is a net energy gain to
be had from biofuel production17, meeting our energy demands through this technology would
mean expanding farmlands, likely leading to increased deforestation which could ultimately
exacerbate global warming.18 The many benefits of nuclear, including the extremely high
energy density of the fuel, are overshadowed by the difficulties seen while managing the
radioactive waste generated during energy production.19 While the years 2013-2014 saw an
~11% increase in energy production from geothermal, solar thermal, photovoltaics and wind1,
greater strides must be taken in developing these technologies in order to avoid catastrophic
environmental changes.
Solar energy harvesting represents the best solution to our current and future demands.
In only 1.33 hours, enough solar energy strikes the Earth to meet our current annual global
energy demands.20 Several promising photovoltaic technologies have emerged over the past
few decades which may one day be used to generated the majority of our energy. An obvious
limitation for solar is its intermittency, requiring significant energy storage to account times of
darkness and heavy cloud coverage. Several approaches are successfully addressing these
issues, though their description is beyond the scope of this thesis.21,22 Instead, this thesis will
be concerned with direct solar to energy conversion, specifically focusing on dye sensitized
5
1.2 Photovoltaic and the Rise of Dye Sensitized Solar Cells.
Crystalline silicon is arguable the most prolific photovoltaic (PV) technology available
today. Silicon PVs are known to have light-to-energy conversion efficiencies as high as 25%,
and their relatively low cost makes them particular appealing.23 The cost of Si PVs have also
been steadily declining over the past few years, due in part to the scale at which they are being
produced.24 Despite the current dominance of Si PVs, a more efficient and less expensive
alternative could easily supplant Si as the primary PV technology.
Crystalline silicon has a band gap of 1.1 eV allowing it to absorb photons with energies
above this threshold. This spectral response is well tuned to match the solar spectrum, Figure
1.3.25 This broad absorption is not without its drawbacks. Photons with energies more than 1.1
eV will thermalize to the bandgap, losing the additional energy as heat.26. Employing
wide-bandgap semiconductors would allow for more energy to be extracted from each photon, but
only a small fraction of the solar spectrum can be absorbed by these materials. As an example,
the fraction of the solar spectrum that can be absorbed by anatase TiO2 (band-gap of 3.2 eV)
is shown in Figure 1.3, and only represents 3% of the solar irradiance.27
An ingenious solution to this problem is to combine wide bandgap semiconductors with
molecular chromophores which can absorb visible light and transfer the photon’s energy to the
semiconductor via electron transfer. These molecules are term “sensitizers” since they
extended the spectral response of the semiconductor well into the visible spectrum, Figure 1.3.
Reports of wide bandgap semiconductor sensitization date back to the 1960’s29, though the
concept of sensitization has been around since the end of the 18th century.30 During the early
6
Figure 1.3: Solar irradiance A.M. 1.5. The area shaded light gray can be absorbed by Si, while the dark gray can be absorbed by both Si and anatase TiO2. The dashed blue lines represent the spectral response
observed for a TiO2 thin film sensitized with a champion Ru complex.28
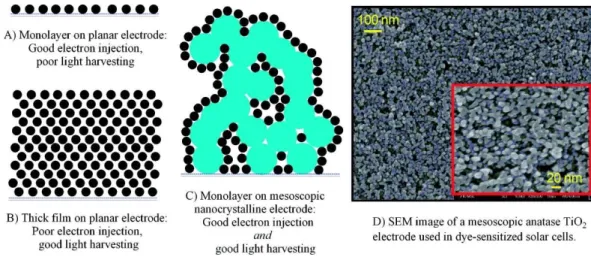
as the semiconductor of choice due to its low cost, low toxicity, and wide availability.30 Some
of these initial studies used Ru(bpy)32+ physisorbed onto planar TiO2 electrodes as means of
sensitization. These interactions are relatively weak, meaning that the sensitizer cam readily
desorb from the interface under relatively benign conditions. The planar TiO2 electrodes also
did not provide a significant path length for light absorption, which led to low photocurrents.
The Ru(bpy)32+ sensitizer was eventually replaced with a Ru sensitizer bearing a carboxylic
acid derivative, [Ru(bpy)2(dcb)]2+ (dcb = 4,4’-dicarboxylic acid 2,2’-bipyridine) which can
chemically bind, or anchor, to the TiO2 interface and greatly improve the device stability.31
The monolayer of sensitizers eventually gave way to thick films of sensitizer. Despite the
7
Figure 1.4: Representation of the advancements in DSSCs. Taken from Ref 27
A major breakthrough for this technology occurred in 1991, when O’Regan and Gratzel
combined a sensitized mesoporous thin film of TiO2 nanocrystallites with an organic
electrolyte containing the I-/I
3- redox couple, Figure 1.4.33 Light harvesting efficiencies of
7.12% were reported under full solar illumination, representing a significant technological
leap. Within several years, devices achieving 9% efficiencies were realized. Within the past
five years, devices exceeding efficiencies of 13% have been reported.34,35
Figure 1.5: Schematic representation of a dye sensitized solar cell. In this figure, S is the surface anchored sensitizer, while M is the solution phase redox mediators. The injection, kreg, sensitizer
regeneration, kreg and recombination reaction to the redox mediator, krec, or oxidized sensitizer, krec2, are
8
A schematic representation of a DSSC is shown in Figure 1.5. A typical DSSC is
comprised of a sensitized nanocrystalline TiO2 photoanode and a platinized counter electrode
with a liquid electrolyte junction between them. As mentioned, light harvesting is achieved
through light adsorption by a surface-anchored chromophore, which undergoes an
excited-state electron transfer to the acceptor excited-states in the TiO2, kinj. The electron transfer event is
reported to occur between 20 – 250 fs36, though evidence for slower injection extending into
the ps range under certain conditions does exist.37 Ideally, the oxidized sensitizer is rapidly
regenerated by a solution phase redox mediator, which can then transport the oxidizing
equivalent, or “hole”, through the external electrolyte solution to the counter electrode. The
prototypical redox mediator is based on the I-/I
3- redox couple. The efficacious of this system
as a redox mediator is often attributed to its complicated redox chemistry that impedes electron
recombination from the TiO2.38,39 Despite this, there are several drawbacks to this system
including its fixed energetics and caustic nature. Significant progress has recently been made
in developing alternative redox mediators that are both energetically tunable and less
caustic.34,35,40–42 Of particular note are those based upon Co(bpy)
33+/2+ that have seen broad
adoption in recent years43–49, and were used in the current record energy-to-light harvesting
efficiency DSSC.34
For the energy in an absorbed photon to be harvested, the injected electron must be
collected at the back contact without recombining with an oxidized sensitizer or redox mediator
during diffusion through the TiO2. These recombination reaction results in the loss of the
captured photon’s energy, lowering the light harvesting efficiency of the device. Overcoming
this unwanted charge recombination process represents a significant obstacle in the
9
Figure 1.6: Representative current-voltage (iV) plot.
The current-voltage response of an illuminated functional DSSC device can be used to
determine its overall light harvesting efficiency, , using Equation 1.1. In this equation, is
the short circuit current, is the open circuit voltage, is the fill factor, is the light flux
incident on the sample and is the cell area. A representative curve can be seen in Figure
1.6.
= (1.1)
The parameters in this equation report on underlying chemical processes occurring during
DSSC operation. For example, reports on the kinetic aspects of a DSSC. Light absorption
and electron injection efficiencies are thought to be the primary contributors to this value.
However, it is worth noting that the diffusion of the redox mediator can limit this parameter,
as has been reported for Co(bpy)33+/2+ based redox mediators.50,51 Significant effort has been
made over the years towards developing panchromatic molecules that can sensitize TiO2 from
the visible to the NIR, which has improved .38,52 Examples of champion sensitizers are given
10
sensitizer to the TiO2 interface. The most commonly used functional groups are carboxylic
acids, though alcohols, phosphonic acids and others have been used with varying degrees of
success.38,53,54
The open circuit voltage represents the maximum Gibbs free energy that can be
extracted from the cell, and is often represented as the energetic difference between the
reduction potential of the redox mediator and the quasi-Fermi level of the TiO2. The is
ultimately determined by the recombination rate, since the quasi-Fermi level under these
conditions is related to the number of injected electrons present in the TiO2. The so-called
Scheme 1.1: Commonly used champion sensitizers.
diode equation, Equation 1.2, relates to the electron injection flux, , the sum of the
recombination rate constants, , to the concentration of acceptors, [ ].55
11
Despite the importance of this reaction and significant effort in understanding it56–61, a
derivation of Equation 1.2 does not exist and the factors that control are poorly understood.
The remainder of this chapter will highlight several key aspects of DSSC operation,
which will be important throughout the subsequent chapters. These topics are: (1) Interfacial
electric fields; (2) Charge mobility; and (3) Charge Recombination.
1.2.1 Interfacial Electric Fields
For a number of years, electrons injected into the TiO2 substrate were thought to have
a minimal effect on the anchored sensitizer and surrounding electrolyte solution due to the
large dielectric constant of the substrate and the high ionic strength of the electrolyte.62,63 In
2010, transient absorption studies performed on sensitized TiO2 thin films by Meyer et al. and
Hagfeldt et al. showed this assumption to be incorrect.64,65
Nanocrystalline TiO2 thin films can be reduced by the application of a forward
(negative) electrochemical bias, yielding TiO2(e-). Reduced TiO2 nanocrystallites are known
to have a broad spectral absorption that spans the visible and the NIR.66,67 A study Ardo et al.
looked at the effect of TiO2 reduction on the photophysical properties of surface anchored
sensitizers. The spectral features of the sensitizer Ru(dtb)2(dcb)2+ (dtb =
4,4’-di-tert-butyl-2,2’-bipyridine and dcb = 4,4’-di-carboxylic acid-2,2’-4,4’-di-tert-butyl-2,2’-bipyridine) were found to hypsochromically
shift as the TiO2 film became reduced, Figure 1.7.64 These shifts were later attributed to a so
called electric field, or “Stark” effect by comparison to spectra generated through classical
Stark spectroscopy.68–70 The Stark effect occurs when a molecule is placed the presence of a
strong electric field.71,72 The electric field interacts with the electronic or vibration transitions
12
moment change relative to the electric field. Transitions which are aligned with the electric
field will become more favored and shift to lower energies, while transitions which are
antiparallel with the electric field will shift to higher energies.69,71,72 Unlike traditional Stark
spectroscopy, where measurements are taken on isotropically orientated molecules in a
frozen/rigid medium69,70, the Ru sensitizers are all aligned normal to the surface and thus
interact with the electric field in the same manner. This results in a unidirectional absorbance
shift, rather than a broadening effect which is more typically observed.
A similar spectral feature was observed for this Ru sensitizer during transient
absorption measurements. These features are most clearly seen after sensitizer regeneration by
a redox mediator that is present in the external electrolyte. This demonstrated that the injected
electrons can generate significant electric fields that can interact with the sensitizer and the
external electrolyte solution. Hagfeldt et al. found similar spectral features for organic
triphenylamine based sensitizers65, extending the observation of the Stark effect to another
class of sensitizers.
Ruthenium polypyridyl complexes anchored at TiO2 interfaces can probe the field strength
generated by the electrons. The observed shift in the sensitizer’s absorbance is can be related
to the dipole moment change of the sensitizer and the magnitude of the electric field. Assuming
that both the molecular dipole moment and the electric field are normal to the interface,
Equation 1.3 can be used to determine the electric field magnitude.73 This equation relates the
absorption shift to the magnitude of the electric field change Δ , by using a numerically
determined first derivative of the ground state absorption profile, . In this equation Δ is the
13
Figure 1.7: (A) Shown in orange are the residuals seen after spectral modeling of the raw data (purple) (B) Similar spectral feature observed after application of an electrochemical bias. Figures adapted from Ref 64.
= (1.3)
The molecular dipole moment change can be determined through traditional Stark
spectroscopy, as demonstrated by Boxer69, or through density functional theory.74,75 Using the
sensitizer Ru(dtb)2(dcb)2+ as a probe, the magnitude of the electric field change under normal
DSSC operating conditions has been estimate to on the order of ~1 mV/cm.76 These electric
fields can have a significant impact on the dynamics occurring at sensitized semiconductor
interfaces, and the implications of these fields on DSSC performance has received considerable
14
Figure 1.8: Transient absorption data where the electrons in the substrate were monitored at 750 nm, as well as features associated with the Stark effect. The Stark effect clearly decays in a region where there is minimal electron loss. Data taken from Ref 76.
Electrolytes used in DSSCs contain high concentrations of ions, which one would
expect to interact with the fields generated by the injected electrons. In a study by O’Donnell
et al., the spectral features for the Stark effect were monitored in relation to charge
recombination for sensitized TiO2 films immersed in acetonitrile solutions containing Li+ or
Mg2+ iodide salts. The iodide was present to regenerate the sensitizer, allowing the Stark effect
to be seen more clearly and to prolong the charge separated state. A key observation made
during these experiments was the decay of the Stark effect (absorbance bleach) prior to
significant recombination (absorbance at 750 nm), Figure 1.8.81 This was surprising, as both
decay processes should occur concurrently, since the electrons generating the field would be
depleted during recombination. The Stark effect decay was seen to be dependent on the cations
in the electrolyte, and thus it was surmised that the cations in solution migrate towards the
interface in the presence of the electric field, thereby reducing the electric field’s influence on
the surface anchored sensitizer. This effect, known as charge screening, has since been seen
15
liquids.82 The cation size-to-charge ratio can have an influence on both the magnitude and the
rate of screening. Smaller cations such as Na+ and Li+ screen more rapidly than larger cations
such as Mg2+ and Ca2+, though a larger magnitude screening effect have been seen for the
divalent cations under steady state conditions.76,59 More recently, Sampaio et. al demonstrated
that in the absence of cations (i.e. neat acetonitrile), the Stark effect decayed concurrent with
charge recombination, agreeing with expectations.74
1.2.2 Electron Transport
Efficient transport of charges through a DSSC is of paramount importance to the light
harvesting efficiency. Early on, electrons were thought to only be transported through the TiO2
conduction band and by the redox mediator present in the electrolyte. This changed in 1998,
when Bonhôte et al. first reported that tri-phenylamine (TPA) surface functionalized mesoporous thin films of TiO2could be reversible oxidized.83 This was surprising, as the
TPA+/0 reduction potential fell within the bandgap of TiO
2, meaning that the oxidation of the
TPA could not occur through the TiO2 (as in through the CB), but rather across the TiO2 by
either a self-exchange electron transfer reaction or by physical diffusion by the TPA. To
investigate the specific mechanism of transport, the surface coverage was systematically varied
and the percentage of the films that was oxidable was monitored. A key finding was that the
TPAs could not be oxidized below a certain surface coverage. This observation, termed a
percolation threshold, demonstrated that electron transfer occurred through a lateral electron
self-exchange, rather than the physical movement of the molecules across the surface. An
example of this is found in Figure 1.9. The latter should have allowed for complete oxidation
of the functionalize film at all surface coverages investigated. 84,85 The percolation threshold
16
Understanding these self-exchange reactions has garnered significant interest in recent years.87–
94
Figure 1.9: Lateral electron self-exchange between surface anchored Ru chromophores. Adapted from Ref 95.
The electron/hole mobility across the surface is likely governed by similar factors as
solution phase self-exchange electron transfer.92 Molecular structure has been shown to greatly
impact the electron transfer rate. For example, the inclusion of thiocyanate ligands onto a
ruthenium polypyridyl compounds (example Z907 in Scheme 1.1) increases the self-exchange
rate relative to similar sensitizers without the thiocyanate present.96 This is thought be a result
of increased electronic coupling between adjacent compounds. Solvent has also been shown to
play an important role during the lateral self-exchange, likely due to the outer sphere
reorganization energy component of self-exchange.94,97 The implications of this electron
transfer event on the charge recombination is poorly understood. Self-exchange has been
shown to be active on the timescale of charge recombination, as has demonstrated through
several time resolved techniques.88–90,98 How this influences charge recombination is currently
unknown, but is of significant interest. More recently, a functional DSSCs which rely solely
on this lateral-exchange process for transport of the hole to the counter electrode have been
17
The electron accepting states in mesoporous nanocrystalline TiO2 play a pivotal role
during charge transport. The electron accepting states in nanocrystalline semiconductors are
often modeled as localized states rather than the conduction bands of single crystal
semiconductors.76,100 The chemical identity of these states is not well understood, though many
postulate that these are lower energy trap states caused by oxygen vacancies.101–104 The
energetic position of these states can be tuned by additives in the external electrolyte solution.
For example, it has been well document that the conduction band of metal-oxide films shift by
59 mV/pH when submerged in aqueous electrolytes.67,105,106 Lewis acidic cations in acetonitrile
solutions can also cause a shift in acceptor states, though the magnitudes have not been
quantified so as to give a shift per concentration change.76 A shift towards positive energies
(i.e. away from the vacuum) often increases the excited state orbital overlap of the sensitizer
and electron accepting states in the substrate, thereby improving charge injection.63,107 This
can be seen in the photoluminescence quenching of Ru sensitizer anchored at TiO2 interfaces
after the introduction of Lewis acidic cations such as Li+.76,108 It is worth noting that the
bandgap is not observed to change with changing pH or the addition of cations, meaning the
valence and conduction band-like states move in concert.
Electrons injected into TiO2 localize within this distribution of electron accepting
states. In order to diffuse though the TiO2, these electrons must move between states, which
can reside at higher or lower energies. Two mechanisms that are commonly invoked to describe
this transport process are the so-called continuous-time random walk (CTRW) model60,109 and
a random time of flight (RTF) model110,111. Both model proposes that the injected electron
becomes trapped within a localized state, and that the transport of the electron is limited by the
18
assumes that electrons can only jump to their nearest neighbor, while the RTF model inserts a
tunneling effect that places equal jump probabilities on all the localized states in the TiO2.
Although similar, the trapping-detrapping rates was orders of magnitude slower for RTF
relative to CTRW. Several other models account for electron transport have also been
proposed112,113, though these two models have found the most broad application within the
field.
The mobility of charge has a strong influence on device performance. Slow electron
diffusion can lead to reduced charge collection, as charge recombination becomes more
competitive. Until recently, the mobility of charge across the interface was not thought to
significantly alter device performance. However, there is growing evidence that electron
mobility across the surface can influence charge recombination and therefore device
performance.94,97 The implications of charge mobility on recombination will be discussed in
the next section.
1.2.3 Charge Recombination
The recombination reaction between injected electrons and molecular acceptors
represents an unwanted electron transfer reaction that lowers the light harvesting efficiency of
DSSCs. Understanding and impeding these unwanted reactions has been the focus of numerous
studies56,38,44,111,113–120, but despite this, interfacial electron transfer reactions remain poorly
understood. An experimental difficulty is relating the observed rate constants, abstracted from
time resolved kinetic data, to the actual interfacial electron transfer step. Recombination
kinetics are dispersive, stretching from the nanosecond to the microsecond timescales and
beyond. A number of explanations have been given to explain the slow recombination kinetics,
19
dominated by electron/hole transport discussed above.124–126 Though often difficult to
understand, the charge rectification imparted by the large discrepancy in the electron injection
rate versus that for charge recombination ultimately allows for efficient charge separation and
DSSC performance.
Common approaches to modeling charge recombination kinetics are to use a sum of
exponential functions127 or a stretch exponential function, also known as the
Kohlraush-Williams-Watts function (KWW) 56,128,129, Equation 1.4. The time required for half the
injected electrons to recombine, t1/2, are often reported in lieu of kinetic modelling.58
∆ = ∆ ( ) (1.4)
Even with extensive kinetic modeling the abstracted rate constants often give little insight into
the recombination mechanism.38 The initial reaction conditions can greatly influence the
abstracted rate constants requiring systematic studies, where only a single parameter is
intentionally varied, in order to gain meaningful insights into the recombination mechanism.
It is worth noting that a study published by Kelly et al. saw that recombination kinetics
between TiO2 and an oxidized Ru sensitizer followed an second-order equal-concentration
kinetic model.108 A single rate constant was abstracted from concentration dependent kinetic
data. Although there are reports of this second-order kinetic model being utilized by other123,
it has not been broadly adopted by the field. In one recent study, Brigham and Meyer
monitored charge recombination when an electrochemical bias was applied to sensitized TiO2
electrodes.56 The electrochemical bias was used to establish either an excess of oxidized
sensitizer or electrons in the substrate. This was used to create pseudo-first order conditions
20
with a KWW function. The concentration of electrons when the oxidized sensitizers were in
excess was varied through the laser intensity and its influence on recombination was
quantified. The reaction was found to be first order in electrons. The recombination reaction
was also found to be first order in oxidized sensitizer when the oxidized sensitizer was in
excess.
The application of a light or electrochemical bias can have a significant influence on
the recombination rate,58,117,119,130–132 with important ramifications for functional DSSCs.
There are expected to be ~20 electrons in each nanocrystallite at the power point
condition.117,133 Under these conditions, Hu et al. showed that the increased charge
recombination rates under these conditions leads to incomplete sensitizer regeneration in
functional DSSCs that decreases the devices .117 The connections between electron
concentration and the rate of recombination has led to the development of different
recombination models that attempt to rationalize interfacial electron transfer behavior.
Figure 1.10: Contributions from both the charge carrier diffusion thought/across the TiO2 and the
21
The increased rate and less dispersive recombination kinetics reported by Durrant et.
al has been used to develop several models for charge recombination. These models involve
both electron diffusion through the TiO2, invoking a trap/detrap model, and kinetic parameters
governing the electron transfer event.60,101 Electron transfer reactions that are limited by
diffusion are known to follow Equation 1.5, where is the observed electron transfer rate
constant, is the diffusion coefficient, is the intrinsic electron transfer rate constant and
is an equilibrium, = / .56 As diffusion becomes slow relative to , the reaction is
dominated by diffusion, Figure 1.10. Understanding the diffusional components for charge
recombination would likely lead to better insights into interfacial electron transfer.
= + (1.5)
A study Farnum et al. reported charge recombination on sensitized indium doped tin
oxide (ITO) nanocrystalline thin films.134 Unlike TiO
2, ITO is metallic in nature without a
forbidden energy gap, i.e. bandgap, between the valence and conduction bands. This allows
rapid electron transport. The recombination processes for these films were monitored over a
series of applied potentials, with the difference between the applied potential and the Ru3+/2+
reduction potential was taken to be the driving force for the reaction. The rate constants found
followed Marcus-Gerisher theory. It is likely that similar kinetics would be observed for TiO2
films if the diffusional contribution to recombination was eliminated or minimized.
Ultimately, charge recombination represents an unwanted process in DSSCs. Several
tactics have been employed to slow charge recombination. Surface passivation with insulating
22
Molecular approaches have also be employed to slow recombination to molecular
sensitizers22,53,90,116,138,139 Extending the distance between the TiO
2 and the sensitizer can also
slow charge recombination,89,138 but may also lower the quantum yield for electron injection,
as the increased distance lowers electronic coupling between the excited-sensitizer and the
TiO2.37,140 To avoid this, dyad systems are often employed, where a sensitizer is covalently
linked to an electron donating moiety. After injection, the sensitizer rapidly transfers the hole
to the acceptor, increasing the distance between the acceptor and the interface.90,118 In some
cases, this approach can greatly slow charge recombination relative to simple sensitizer
systems. Molecular bridges between the donor and acceptor were recently shown to influence
recombination, suggesting a through bond recombination mechanism.118
1.3 Conclusions
Numerous electron transfer and transport processes govern the overall efficiency of a
DSSC. This thesis is focused on the fundamental electron transfer processes that underlie
DSSC operation. Through this research, we have gained a deeper understanding of the electron
self-exchange reaction TiO2 interfaces, the role of cations on charge recombination to solution
23
Chapter 2: A Distance Dependence to Lateral Self-Exchange Across Nanocrystalline TiO2. A Comparative Study of Three Homologous RuIII/II Polypyridyl Compounds
Reprinted with Permission from DiMarco, B. N.; Motley, T. C.; Balok, R. S.; Li, G.; Siegler, M. A.; O’Donnell, R. M.; Hu, K.; Meyer, G. J. J. Phys. Chem. C 2016, 120 (26), 14226-14235.
Copyright 2016 American Chemical Society
2.1 Introduction
Studies as far back as 1998 have demonstrated that molecules anchored to the mesoporous
nanocrystalline (anatase) TiO2 thin films commonly used in dye-sensitized solar cells can be
reversibly oxidized and reduced in standard electrochemical cells.83,141 Molecules with formal
reduction potentials that lie within the forbidden 3.2 eV band gap of TiO2 are rapidly and
quantitatively oxidized indicating that the redox chemistry does not involve the conduction or
valence bands. Instead a model was proposed wherein electron transfer was initiated at the
transparent conductive oxide substrate that supports the thin film and continues across the TiO2
nanocrystallites by lateral intermolecular self-exchange electron transfer, now commonly
referred to as ‘hole hopping’.83,142 A simplified description of RuIII/II self-exchange for three
Ru compounds linked to a single TiO2 nanocrystallite on a fluorine-doped tin oxide (FTO)
substrate is given in Scheme 2.1. A more realistic description would display about 500 Ru
compounds anchored to each ~ 20 nm anatase crystallite interconnected in an ~ 5-micron thin
film. The importance of self-exchange electron transfer between surface immobilized
24
without a loss of free energy. It this chapter, it is shown for the first time that such transport
can be controlled at the molecular level with insulating organic functional groups.
Scheme 2.1: Illustration of lateral intermolecular self-exchange electron transfer across anatase TiO2
nanocrystallites initiated at the fluorine-doped tin oxide (FTO) substrate.
It was previously found that a minimal surface coverage of the redox active molecules was
required for complete oxidation and reduction.83 At least 50% of the saturation (often assumed
to be a monolayer) surface coverage was necessary to ensure that all of the surface anchored
molecules could be electrochemically accessed.83,86 This minimum surface coverage, termed a
percolation threshold, helped demonstrate that oxidation occurs through electron
self-exchange, rather than physical diffusion of the anchored molecules. More recent
chronoamperometric studies have provided apparent electron diffusion coefficients (D) for
lateral self-exchange for a growing number of redox active molecules.87,89,90,92,93,142,143 From
this prior work, it is clear that self-exchange dynamics on TiO2 nanocrystallites can, in some
particular cases, be controlled at the molecular level. For example, the inclusion of two
isothiocyanate groups in a cis-geometry about the ruthenium center has been demonstrated to
significantly increase D.87 However, the extent to which self-exchange rate constants, and
hence charge transport, across nanocrystalline surfaces can be controlled by molecular
dye-25
sensitized solar cells do not require mediators such as iodide, and can instead use self-exchange
electron transfer to the complete the circuit and generate electrical power.99 Lateral
self-exchange also has relevance for the photo-oxidation of water to oxygen by molecular
catalysts.142,144 This manuscript seeks to identify structure-property relationships for
self-exchange ‘hole hopping’ in a family of three Ru polypyridyl compounds.
Non-adiabatic Marcus theory has been extensively used to quantify or predict
electron-transfer rate constants and has been thoroughly reviewed.145,146 Non-adiabatic Marcus theory
is commonly used to describe self-exchange electron-transfer reactions between weakly
coupled donors and acceptors in homogenous fluid solutions. A generic potential energy
diagram for self-exchange electron-transfer is shown in Figure 2.1. A key feature of self-exchange electron-transfer reactions is that G°= 0, due to the equivalence of the products and
reactants. The reactant and product surfaces are split at their intersection by 2 HAB, the
electronic coupling matrix element. For outer-sphere bimolecular self-exchange in fluid
solution, coupling in the encounter complex is weak, HAB << kT. Constraining molecules
undergoing exchange electron transfer to a surface is expected to further decrease HAB
justifying the use of non-adiabatic Marcus theory.
The self-exchange electron transfer rate constant, kSE, is described by Equation 2.1.
kSE= 2πħ |4πλk|
bT exp
-λ
4kbT (2.1)
This equation relates k SE to temperature (T), HAB, and the total reorganization energy (λ)
for the reaction. The total reorganization energy is related to the free energy of activation (G‡)
= λ/4 and is typically partitioned into inner sphere, λI, and outer sphere, λO components, λ = λI
26
electron transfer while λO reflects reorientation of the solvent molecules and ions present in the
electrolyte.
Figure 2.1: Plot of an example one-dimensional reaction coordinate for a nonadiabatic (dashed lines) or adiabatic (solid lines) self-exchange electron transfer reaction. The orange and green spheres represent Ru molecules in the encounter complex before, during, and after electron transfer. The blue spheres depict counter ions and exaggerates their location and movement during the electron transfer process.
The state-of-the-art in characterization of lateral self-exchange in mesoporous TiO2 thin
films was recently reported by Moia and coworkers.92 These authors quantified self-exchange
among ten different dye molecules as a function of temperature for the first time.
Self-exchange was found to be an activated process with Eact that ranged from 170-370 meV, values
that were dependent on the nature of the redox active molecule. Marcus analysis λ and HAB
for self-exchange in macrocyclic, ruthenium polypyridyl, and organic push-pull (i.e. D--A)
molecules. The λ’s abstracted from the transient kinetic data were found to be in good
agreement with expectations based on density functional theory. Reorganization energies
27
extended conjugation were concluded to be small. There was also some evidence that
non-conjugated functional groups on the molecules could potentially influence lateral
self-exchange. This report compliments this previous study through characterization of a
homologous series of compounds where λ is expected to be held near parity, yet the steric bulk
of the bipyridine ligand was intentionally varied. The data provide compelling evidence that
these side groups can be used to tune the self-exchange between immobilized redox sites.
In this chapter, a comparative study of three analogous Ru diimine compounds of the
general form [Ru(LL)2(dcbH2)](PF6)2 were dcbH2 is 2,2’-bipyridyl-4,4’-dicarboxylic acid and
LL is 2,2’-bipyridine (bpy), 4,4’-dimethyl-2,2’-bipyridine (dmb), or
4,4’-di-tert-butyl-2,2’-bipyridine (dtb), is reported, Scheme 2.2. These compounds share a tris-chelated,
pseudo-octahedral geometry and hence the reorganization energy for the RuIII/II redox chemistry is
expected to approximately the same across the series. Each compound possesses a single dcb
ligand for surface binding to TiO2 with two other substituted bipyridine ligands possessing
substitutions at the 4,4’-position that were expected to influence lateral self-exchange
reactivity. In fact, small changes to the molecular structure, such as replacement of a H atom
with a methyl group, was found to have a surprisingly large influence on the D, as observed
through both chronoabsorptometry and temperature-dependent cyclic voltammetry studies.
28 2.2 Methods
Materials. The following solvents and reagents were purchased from the indicated
supplied, and were used without further purification: titanium(IV) isopropoxide (Ti(i-OPr)4;
Aldrich ≥97.0%); deionized water; acetonitrile (CH3CN, Burdick & Jackson,
spectrophotometric grade); diethyl ether (Et2O; Fisher Scientific, 99.9%); anhydrous ethanol
(EtOH, Fisher Scientific, 99%); silver nitrate (AgNO3; Stream, 99.9%); sodium hydroxide
(NaOH; Sigma-Aldrich, >97%); hexafluorophosphonic acid (HPF6; 65% solution in H2O,
Sigma-Aldrich); lithium perchlorate (LiClO4; Sigma-Aldrich 99.99%); ammonium
hexafluorophosophate (NH4PF6; Sigma-Aldrich, 99.8%); 4,4’-dimethyl-2,2’-bipyridine (dmb;
Combi-Blocks), argon (Airgas, ≥99.998%); oxygen (O2, Airgas, ≥99.998%); fluorine-doped
tin(IV) oxide (FTO; Hartford Glass Co., Inc., 2.3 mm thick, 15 Ω/□), [Ru(bpy)2(dcbH2)](PF6)2
((bpy); Solaronix). The complexes [(p-cymene)Ru(deeb)Cl]Cl, where deeb is the
2,2’-bipyridyl-4,4’-diethyl ester, and [Ru(dtb)2(dcbH2)](PF6)2 (dtb) were available from previous
studies.147,148 Anion metathesis of dtb was used to generate a ClO
4- salt. Single crystals of the
perchlorate salt of dtb suitable for X-ray structure determination were obtained by slow
diffusion of hexanes into concentrated acetonitrile solutions.
Synthesis. [Ru(dmb)2(deeb)](PF6)2 (1): The [(p-cymene)Ru(deeb)Cl]Cl (80.1 mg, 0.13
mmol) precursor was combined with dmb (49.0 mg, 0.27 mmol) and AgNO3 (61.6 mg, 0.36
mmol) in 10 mL of EtOH. The solution was purged with N2 for >15 minutes, then heated to a
reflux under an N2 atmosphere for 14 h. After this time had elapsed, the solution was cooled
to room temperature and the solvent was removed. The colored product was redissolved in a
minimal amount of water. The aqueous solution was filtered to remove any remaining Ag+


 2 . b) Crystal structure of [Ru(dtb) 2 (dcbH 2 )](ClO 4 ) 2](https://thumb-us.123doks.com/thumbv2/123dok_us/8277511.2192130/54.918.207.772.715.980/figure-crystal-structure-deeb-crystal-structure-dcbh-clo.webp)