© The Author 2016. Published by Oxford University Press on behalf of the Maryland Psychiatric Research Center. All rights reserved. For permissions, please email: [email protected]
The Role of Cognition and Social Functioning as Predictors in the Transition to
Psychosis for Youth With Attenuated Psychotic Symptoms
Jean Addington*,1, Lu Liu1, Diana O. Perkins2, Ricardo E. Carrion3, Richard S. E. Keefe4, and Scott W. Woods5
1Hotchkiss Brain Institute, Department of Psychiatry, University of Calgary, Calgary, AB, Canada; 2Department of Psychiatry,
University of North Carolina, Chapel Hill, NC; 3Department of Psychiatry, Zucker Hillside Hospital, Glen Oaks, NY; 4Department of
Psychiatry, Duke University, Durham, NC; 5Department of Psychiatry, Yale University, New Haven, CT
*To whom correspondence should be addressed; Mathison Centre for Mental Health Research and Education, University of Calgary, 3280 Hospital Drive NW, Calgary, Alberta T2N 4Z6, Canada; tel: 403-210-6379, fax: 403-210-9182, e-mail: [email protected]
In the literature, there have been several attempts to develop prediction models for youth who are at clinical high risk (CHR) of developing psychosis. Although there are no spe-cific clinical or demographic variables that seem to consis-tently predict the later transition to psychosis in those CHR youth, in addition to attenuated psychotic symptoms, the most commonly occuring predictors tend to be poor social functioning and certain cognitive tasks. Unfortunately, there has been little attempt to replicate alogorithms. A recently published article by Cornblatt et al suggested that, for individuals with attentuated psychotic symptoms (APS), disorganized communication, suspiciousness, verbal memory, and a decline in social functioning were the best predictors of later transition to psychosis (the RAP model). The purpose of this article was to first test the prediction model of Cornblatt et al with a new sample of individu-als with APS from the PREDICT study. The RAP model was not the best fit for the PREDICT data. However, using other variables from PREDICT, it was demonstrated that unusual thought content, disorganized communication, baseline social functioning, verbal fluency, and memory, processing speed and age were predictors of later transi-tion to psychosis in the PREDICT sample. Although the predictors were different in these 2 models, both supported that disorganized communication, poor social functioning, and verbal memory, were good candidates as predictors for later conversion to psychosis.
Key words: prodromal/clinical high risk/prediction/ schizophrenia
Introduction
A major focus in the schizophrenia literature is the early identification of those at risk for schizophrenia or other
related psychotic disorders before the onset of a psy-chotic illness. The hope is that early intervention may slow down or even prevent the progression to a full blown psychotic illness. There already exist well-established criteria, the prodromal risk criteria,1,2 to determine this
risk. These criteria identify 3 syndromal subgroups. The first is the attenuated positive symptom syndrome (APSS) which includes the emergence or worsening of nonpsychotic level disturbances in thought content, thought processes, or perceptual abnormalities in the past year. The second is the brief intermittent psychotic symptom syndrome (BIPS) which requires the pres-ence of any one or more threshold positive psychotic symptoms (unusual thought content, suspiciousness, grandiosity, perceptual abnormalities, and disorganized communication) that are too brief to meet diagnos-tic criteria for psychosis. Finally, the third criterion is genetic risk and deterioration (GRD) which requires having a combination of both functional decline and genetic risk (ie, either schizotypal personality disorder or a first-degree relative with a schizophrenia spectrum disorder).1 Individuals presenting with one of these
syn-dromes are usually between 12 and 30 years old, and, since the criteria are clinically based, these individuals are considered to be at clinical high risk (CHR) for psy-chosis. Approximately 20–35% of these young people will develop fully blown psychotic symptoms over a 2-year period, although the risk is often more imminent, as most of the conversions occur during the first year after ascertainment with conversion rates decelerating after that first year.3,4
Unfortunately, there is often little consistency across these studies in terms of both the domains chosen as well as the specific measures selected as potential pre-dictors.9 Furthermore, these studies using combinations
often end up with relatively high positive predictive val-ues and specificity (eg, in the 50–70% range), but low sensitivity (eg, in the 10–30% range).4 More recent
stud-ies have considered adding biomarkers to their predic-tion models10 which may result in important information
about mechanisms. Regardless, even when only clinical and demographic variables are added, it is often that the best predictor of transition to psychosis is the severity of the attenuated psychotic symptoms.11 Thus, although
the CHR criteria, in particular attenuated psychotic symptoms, have been validated as being sensitive to the risk of transitioning to psychosis, at the present time their value in making predictions about individuals is limited. Finally, it should be noted that few studies have attempted direct replication of each other’s risk algo-rithms, which suggests heterogeneity among profiles of clinical and demographic risk indicators for those who make the transition to psychosis.
Cornblatt et al9 have suggested that combining the 3
subgroups of the CHR criteria, namely APSS, GRD, and BIPS, may have an impact on predictive validity in that the assumption that these 3 subgroups are similar in terms of risk and developmental trajectories is essen-tially untested.12 In their recent study at the Recognition
and Prevention (RAP) Program they excluded those who met BIPS and GRD criteria and selected their potential predictor variables primarily based on the vulnerability indicators they had described many years earlier.13 These
included cognitive deficits, anxiety and depression, and social and role functioning difficulties. These domains had been selected as they were the domains most impli-cated in schizophrenia and were potentially modifiable.13
Results of this study were that in the final prediction model only symptoms (disorganized communication, suspiciousness), cognition (verbal memory deficits) and decline in social functioning were included. In addition to attenuated psychotic symptoms, which all participants need to have to meet CHR criteria, both cognition and social functioning have continually been demonstrated to be among the most common deficits observed in those at CHR.14–17
Enhancing the Prospective Prediction of Psychosis (PREDICT)is a 2-year longitudinal study to deter-mine predictors of conversion in individuals at CHR of developing psychosis, conducted at the Universities of Toronto, North Carolina, and Yale. The main hypoth-esis of this study was that social functioning would be the best predictor of later transition to psychosis with cognition also being an important predictor. We have previously published on substance use in this sample.18
Approximately, 50% of the sample used alcohol, 30% tobacco and 30% cannabis. Use of other drugs was
minimal. There were no differences between those who converted and those who did not for tobacco and can-nabis; however, those who converted had slightly lower use of alcohol.18
The first aim of this article was to test the prediction model from the RAP sample presented by Cornblatt et al.9 When the previous model did not fully
repli-cate, the second aim was to determine if the RAP model could be improved upon with variables in the PREDICT sample. Potential predictors will include cognition and role and social functioning in addition to symptoms. Since this is exploratory we will consider several models.
Methods Participants
The PREDICT sample consisted of 172 individuals who met the criteria of prodromal syndromes (COPS) diag-nostic criteria for 1 of 3 psychosis-risk syndromes: the APSS, the BIPS, or GRD.1 Participants were excluded
if they met criteria for any current or lifetime axis I psy-chotic disorder, had a history or current use of anti-psychotic medications, had an IQ of less than 70, or had past or current history of a clinically significant central nervous system disorder. Since CHR syndromes other than APSS are infrequent, we restricted analysis to those diagnosed with APSS, either alone or in com-bination with another CHR syndrome. One hundred sixty-eight CHR participants met APSS criteria, 4 met only GRD criteria without APSS and no participants met BIPS. Of the 168 meeting APSS criteria, 23 either dropped out after baseline or did not complete the base-line assessment. Thus, for this article, the final sample consisted of 145 CHR individuals (82 males, 63 females) who met APSS criteria, and had at least one follow-up assessment. In this sample, 29 participants made the transition to psychosis.
Measures
The Structured Interview for Psychosis-risk Syndromes (SIPS) and the Scale of Psychosis-risk Symptoms (SOPS) were used to determine criteria for a prodromal syn-drome, and to determine severity of attenuated positive symptoms.1
Social and Role functioning was assessed using the Social Functioning Scale (SFS), a self-report question-naire developed for outpatients with schizophrenia and has been used for individuals at both the first episode and at CHR. The SFS has excellent psychometric properties.19
functioning subscale of the Quality of Life Scale (QLS).20
Using the last assessment carried forward we also cal-culated a change over time score for the total SFS and for role.
Cognitive tests were chosen on the basis of their dem-onstrated reliability, ability to discriminate patients with schizophrenia from healthy participants, lack of ceiling and floor effects in a CHR population, and appropriate-ness for individuals as young as 14 years of age. Verbal fluency was assessed with Category Instances21 and the
controlled word association tests (COWAT), verbal mem-ory with the Rey Auditory Verbal Learning Test,22
ver-bal working memory with the Letter-Number Sequencing Test,23 spatial working memory with the Computerized
Test of Visuospatial Working Memory (CTVWM)24
and the N-back task,25 attention with the Continuous
Performance Test—Identical Pairs26 and Digit Span
Distractibility, processing speed with Trails A,27
execu-tive functioning with the Wisconsin Card Sorting Test, 64-card computerized version (WCST),the Stroop Color-Word Test28 and Trails B,27 motor function with Finger
Oscillation Test27 and IQ with Wechsler Adult Intelligence
Test/Wechsler Intelligence Scale for Children-III (Block Design, Arithmetic, Digit Symbol/Coding, Vocabulary, Information).
Procedures
Clinical raters were experienced research clinicians who demonstrated adequate reliability on the SIPS at routine reliability checks. Gold standard post-training agreement on the distinction between high risk and psychotic lev-els of intensity was excellent (kappa = 0.90). All cases were reviewed on weekly conference calls chaired by JA. Cognitive assessments were conducted by research assis-tants, and pre- and post-doctoral neuropsychology fel-lows trained by RK. RK held monthly conference calls to review any concerns or issues related to cognitive testing. Clinical assessments were conducted every 2 months for the first 6 months, and then every 6 months. Functioning and cognition were conducted at 6 monthly intervals. The study protocols and informed consents were reviewed and approved by the Institutional Review Boards of each site. All participants provided written, voluntary consent to participate.
Statistical Analysis
All analyses were conducted in SPSS version 21 and R version 3.3.1. Descriptive statistics were used to present means, standard deviations, and ranges of all measures. To test the performance of the RAP model in PREDICT, we applied the original regression formula provided by Cornblatt et al to our data to obtain the prognostic index (PI). We only have the L1 information (PI) from Cornblatt et al. so we were only able to conduct very
limited validation work related to discrimination but not calibration.
After observing that the RAP model did not repli-cate well, we developed our model. We started with all 20 candidate variables for our full model (demographic variables, antidepressant medications at baseline, symp-toms from the SOPS, cognitive variables, and social and role functioning), and then the least absolute shrinkage and selection operator (LASSO) method for variable selection in the cox regression model was used. This is a new method for variable selection and shrinkage in cox regression models which reduces the estimation variance while providing an interpretable final model.29
A reasonable range of the tuning parameter λ (lambda) values appropriate for the data set was calculated by using GLMNET package in R.30 The cross-validated
performance of the model for each value of λ was esti-mated to find the optimal value for the λ that gives mini-mum mean cross-validation error, and the optimal λ was chosen for fitting our final model in the total sample. The cross-validated predictive performance (Harrel’s c-index) of our full model and the final model was esti-mated by using MLR package in R.31 The prognostic
index (PI), Harrel’s c-index of concordance, Kaplan– Meier curves for 3 risk groups and baseline cumulative hazard function of the final model was provided for external validation.
Results
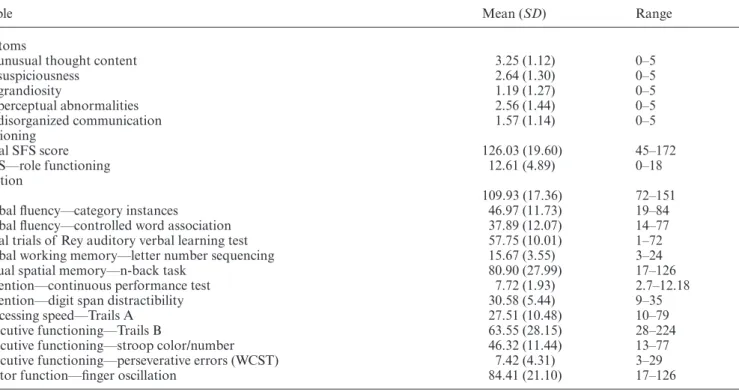
The sample consisted of 82 males and 63 females. Mean age was 19.84 years (SD = 4.69, range 12–31). The major-ity were white (75.9%), 68.6% had completed high school and 32.1% had some form of degree or professional train-ing either from a University or community college. Mean scores and ranges for all measures used are presented in Table 1.
In terms of DSM-IV diagnoses, 38 (26.3%) had a cur-rent mood disorder and 69 (47.9%) reported a previous mood disorder. Sixty-three (43.4) had a current anxiety disorder and 71 (48.9%) reported a previous anxiety dis-order. Five participants met criteria for obsessive com-pulsive disorder. Sixty participants (41.4%) were taking psychotropic medication at baseline. Forty-eight (33%) were taking an antidepressant. Differences between those who converted and those who did not are presented in Table 2. The groups only differed in social functioning, verbal memory, and verbal fluency with the converters always performing more poorly.
Table 2. Differences Between Those Who Converted and Those Who Did Not
Variable CHR Nonconverters (n = 116) Mean (SD) CHR Converters (n = 29) Mean (SD) t Value
Age 19.89 (4.72) 19.68 (4.62) −0.22
P1 unusual thought content 3.20 (1.09) 3.45 (1.24) 1.07
P2 suspiciousness 2.59 (1.26) 2.83 (1.47) 0.86
P3 grandiosity 1.26 (1.31) 0.90 (1.11) −1.37
P4 perceptual abnormalities 2.59 (1.44) 2.41 (1.45) −0.60
P5 disorganized communication 1.48 (1.11) 1.90 (1.21) 1.76
SOPS total positive symptoms 11.13 (3.20) 11.48 (2.96) 0.54
QLS—role functioning 13.01 (4.49) 11.04 (6.07) −1.64
Total SFS score 129.08 (17.17) 113.84 (23.93) −3.23**
Change over time in role 1.75 (4.50) 2.00 (3.60) 0.27
Change over time in SFS 7.73 (16.60) 16.42 (13.12) 2.62*
IQ score 111.15 (16.54) 105.08 (19.87) −1.69
Verbal memory z score 0.09 (0.83) −0.36 (0.84) −2.59*
Spatial working memory score 0.05 (0.89) −0.20 (0.92) −1.35
Executive functioning z score −0.03 (0.44) 0.13 (0.71) 1.48
Distractibility z score 0.05 (1.04) −0.20 (0.83) −1.20
Verbal fluency z score 0.10 (0.85) −0.39 (0.93) −2.69**
Processing speed z score −0.52 (0.99) 0.21 (1.03) 1.27
Motor function z score 0.06 (0.87) −0.22 (1.16) −1.39
Diagnoses N (%) N (%) Chi-square
Lifetime depression 54 (46.5) 15 (51.7) 0.21
Lifetime anxiety 54 (47) 17 (58.6) 1.26
Current depression 27 (23.5) 11 (37.9) 2.49
Current anxiety 49 (42.6) 14 (48.3) 0.30
Medications
Any psychotropic medication 48 (41.4) 12 (41.4) 0.00
Anti-depressant 38 (32.8) 10 (34.5) 0.03
*P < .05. **P < .01.
Table 1. Means, Standard Deviations, and Ranges of All Measures
Variable Mean (SD) Range
Symptoms
P1 unusual thought content 3.25 (1.12) 0–5
P2 suspiciousness 2.64 (1.30) 0–5
P3 grandiosity 1.19 (1.27) 0–5
P4 perceptual abnormalities 2.56 (1.44) 0–5
P5 disorganized communication 1.57 (1.14) 0–5
Functioning
Total SFS score 126.03 (19.60) 45–172
QLS—role functioning 12.61 (4.89) 0–18
Cognition
IQ 109.93 (17.36) 72–151
Verbal fluency—category instances 46.97 (11.73) 19–84
Verbal fluency—controlled word association 37.89 (12.07) 14–77
Total trials of Rey auditory verbal learning test 57.75 (10.01) 1–72
Verbal working memory—letter number sequencing 15.67 (3.55) 3–24
Visual spatial memory—n-back task 80.90 (27.99) 17–126
Attention—continuous performance test 7.72 (1.93) 2.7–12.18
Attention—digit span distractibility 30.58 (5.44) 9–35
Processing speed—Trails A 27.51 (10.48) 10–79
Executive functioning—Trails B 63.55 (28.15) 28–224
Executive functioning—stroop color/number 46.32 (11.44) 13–77
Executive functioning—perseverative errors (WCST) 7.42 (4.31) 3–29
Motor function—finger oscillation 84.41 (21.10) 17–126
Testing the RAP Model
For the external validation of the RAP model in PREDICT, we addressed the discrimination by conduct-ing regression on the PI in our data and checkconduct-ing the mea-sures of discrimination. The slope on the PI was 0.073 which is less than 1. For the measures of discrimination, Harrel’s c-index of concordance was 0.55 which means the predictive performance of the RAP model was poor.
The PREDICT Model
The final model, consisted of 7 variables: baseline social functioning, verbal fluency, unusual thought content, verbal memory, disorganized communication, processing speed, and age (Table 3).
The full model with all 20 candidate variables has a cross-validated Harrel’s c-index of concordance of 0.71. Our final model has a cross-validated Harrel’s c-index of concordance of 0.73. The formula to calculate the PI for our final model was: 0.13 × (unusual thought con-tent) + 0.096 × (disorganized communication) − 0.21 × (verbal fluency z score) − 0.11 × (verbal memory z score)
+ 0.071 × (processing speed z score) −0.49 × (baseline social functioning z score) + 0.02 × age.
Kaplan–Meier curves for the 3 risk groups are pre-sented in figure 1. To give a reasonable spread of risk, we chose 3 prognostic groups which are good, fairly good and poor. The required cut-points are the 27th and 73th centiles of the continuous variable, the PI in our data-set. The absolute values are 0.49 and 1.19, respectively. A look-up table for baseline cumulative hazard function is presented as Supplementary Table 1.
Discussion
The aim of this article was to report on testing the RAP model of prediction of conversion to psychosis in a dif-ferent study, PREDICT, another longitudinal study of conversion to psychosis. Secondly, we reported on a pre-diction model within the PREDICT sample with poten-tial predictors being social and role functioning and cognition in addition to attenuated psychotic symptoms. The sample for both models was limited to only partici-pants meeting APS criteria.
The RAP model was not the best fit for our PREDICT data. The slope on the PI was 0.07 suggesting poor dis-crimination. Harrel’s c-index of concordance was 0.55 which means the predictive performance of the RAP model in our data was poor.
The final PREDICT model consisted of 7 variables which ranked according to their standardized regression coeffi-cients included baseline social functioning, verbal fluency, unusual thought content, verbal memory, disorganized communication, processing speed, and age. Individuals with poorer baseline social functioning, poorer verbal flu-ency, increased severity ratings on unusual thought con-tent, poorer verbal memory, increased severity ratings on disorganized communication, poorer processing speed, and older age have higher rates of conversion to psychosis.
One of the goals of testing the different models was to determine their consistency, and indeed the RAP and PREDICT models are similar. Suspiciousness and unusual thought content are 2 of the most common attenuated psychotic symptoms,32 suspiciousness was a
predictor in RAP and unusual thought content was a pre-dictor in PREDICT. Other prediction models such as the North American Prodromal Study (NAPLS1) reported that both unusual thought content and suspiciousness were significant predictors in their model,4 and later in
NAPLS 233 both unusual thought and suspiciousness
were highly relevant in prediction. Secondly, both the RAP and PREDICT models report on social functioning as a significant predictor, the difference being that in RAP it is decline over time whereas in PREDICT it is baseline social functioning. Again, both have been reported in other studies with social functioning over the past year being a predictor in the EPOS model7 and baseline social
impairment being a predictor in NAPLS 1.4
Table 3. LASSO cox regression model
Variable Unstandardized Coefficient Standardized Coefficient
Baseline social functioning z score −0.49 −0.53
Verbal fluency z score −0.21 −0.25
Unusual thought content 0.13 0.15
Verbal memory z score −0.11 −0.13
Disorganized communication 0.096 0.12
Processing speed z score 0.071 0.094
Age 0.02 0.03
RAP reported verbal memory as a significant predic-tor whereas PREDICT reported verbal fluency, and pro-cessing speed in addition to verbal memory. Two other projects examining cognition as a predictor in addition to other factors reported processing speed as significant.6,8 In
schizophrenia, cognitive deficits are common with verbal memory and verbal fluency often being the most severe, as well as speed of processing. In contrast to the results of both the PREDICT and RAP studies, Ziermans et al34
reported that full scale IQ was the only cognitive marker that added to the prediction accuracy. However, this was a much smaller (N = 43) and younger (12–18 years) sam-ple which was comprised of at risk youth and not limited to only those meeting APSS.
There are several limitations of this study. First, there were differences between RAP and PREDICT. Entry criteria for PREDICT was that the attenuated psychotic symptoms had to have begun or worsened in the past year; whereas in the RAP sample this restriction was not applied. The studies differed in their measures of functioning. RAP used measures that were specifically designed for youth at high risk of psychosis35 whereas
PREDICT used measures of social and role function-ing that were typically used in psychotic populations. Furthermore, in PREDICT it was difficult to examine decline in social functioning due to the extent of missing follow-up data with the implication that our imputation may be less valid. However, PREDICT did have more missing social functioning follow-up data in the convert-ers (68.9%) compared to the nonconvertconvert-ers (30.2%). This may have resulted from differences in the mean time from baseline assessment to conversion to psychosis, which was 1.78 years in RAP compared to 0.89 years in PREDICT.
Secondly, there were differences in the assessment of cognition. RAP did not assess verbal fluency. With respect to verbal memory, RAP created a verbal mem-ory score from the total and delayed recall score of the California Verbal Learning Test, plus the immediate and delayed logical memory from the Wechsler Memory Scale, Revised. PREDICT created a verbal memory score from the Rey total score, and the letter-number test of auditory working memory.
In a recent article, Studerus et al36 reviewed 6
stud-ies that included neurocognitive measures in prediction models that contained other variables. These authors concluded that although the majority of these prediction studies offered support to neurocognitive measures mak-ing a unique contribution to the prediction of psychosis, such measures generally seemed to be weaker predictors than clinical measures. In fact, Studerus et al36 suggest
that when clinical measures are considered the strength of the association of neurocognitive measures with tran-sition is weakened.
Limitations of prediction studies such as reported here often do not address the fact that the predictive marker may at times be dependent on its developmental trajectory.
For social functioning, these studies did address change over time. Future models may want to consider using similar “developmental” measures for cognition. Results presented in this article support the position of Cornblatt et al9 that these prediction models tend to capitalize on
associations within a given sample and that locally devel-oped models should only be expected to work on samples that were recruited in the same way and possibly the same or similar locations. Furthermore, it would be important to use the same measures across studies, since one pos-sible reason for the lack of convergent results is the use of different instruments. As has been done for cogni-tion through the Nacogni-tional Institute of Mental Health, it may be timely to begin to develop consensus batteries for assessing CHR individuals in order to achieve better predictive value. It may take several samples and several studies to begin to approach what the “true predictors” might be.
In summary, in this article we first demonstrated that the RAP model was not the best fit for the PREDICT data and then examined PREDICT to determine the optimal predictors in the PREDICT sample with an eye to the later possible meta-analysis of consistency of opti-mal predictors across samples. What does seem to be con-sistent at this stage is that severe levels of unusual thought and/or suspiciousness, poor social functioning and cogni-tive functioning in particular verbal memory and/or ver-bal fluency are highly potential candidate predictors.
Supplementary Material
Supplementary material is available at http://schizophre-niabulletin.oxfordjournals.org.
Funding
The National Institute of Mental Health (U01MH06634 to J. Addington, U01MH066069 to D. Perkins, and U01MH066160 to S. Woods).
References
1. McGlashan T, Walsh BC, Woods SW. The Psychosis Risk Syndrome: Handbook for Diagnosis and Follow-up. New York: Oxford University Press; 2010.
2. Yung AR, Yuen HP, McGorry PD, et al. Mapping the onset of psychosis: the comprehensive assessment of at-risk mental states. Aust N Z J Psychiatry. 2005;39:964–971.
3. Fusar-Poli P, Bonoldi I, Yung AR, et al. Predicting psychosis: meta-analysis of transition outcomes in individuals at high clinical risk. Arch Gen Psychiatry. 2012;69:220–229.
4. Cannon TD, Cadenhead K, Cornblatt B, et al. Prediction of psychosis in youth at high clinical risk: a multisite lon-gitudinal study in North America. Arch Gen Psychiatry. 2008;65:28–37.
5. Nelson B, Yuen HP, Wood SJ, et al. Long-term follow-up of a group at ultra high risk (“prodromal”) for psychosis: The PACE 400 study. JAMA Psychiatry. 2013;70:793–802.
6. Riecher-Rossler A, Pflueger MO, Aston J, et al. Efficacy of using cognitive status in predicting psychosis: a 7-year follow-up. Biol Psychiatry. 2009;66:1023–1030.
7. Ruhrmann S, Schultze-Lutter F, Salokangas RK et al. Prediction of psychosis in adolescents and young adults at high risk: results from the prospective European prediction of psychosis study. Arch Gen Psychiatry. 2010;67:241–251. 8. Michel C, Ruhrmann S, Schimmelmann BG, Klosterkotter J,
Schultze-Lutter F. A stratified model for psychosis prediction in clinical practice. Schizophr Bull. 2014;40:1533–1542. 9. Cornblatt BA, Carrion RE, Auther A, et al. Psychosis
pre-vention: a modified clinical high risk perspective from the Recognition and Prevention (RAP) Program. Am J Psychiatry. 2015;172:986–994.
10. Addington J, Cadenhead KS, Cornblatt BA, et al. North American Prodrome Longitudinal Study (NAPLS 2): over-view and recruitment. Schizophr Res. 2012;142:77–82. 11. Fusar-Poli P, Borgwardt S, Bechdolf A, et al. The psychosis
high-risk state: a comprehensive state-of-the-art review. Arch Gen Psychiatry. 2013;70:107–120.
12. Nelson B, Yuen K, Yung AR. Ultra high risk (UHR) for psy-chosis criteria: are there different levels of risk for transition to psychosis? Schizophr Res. 2011;125:62–68.
13. Cornblatt BA, Lencz T, Smith CW, Correll CU, Auther AM, Nakayama E. The schizophrenia prodrome revis-ited: a neurodevelopmental perspective. Schizophr Bull. 2003;29:633–651.
14. Cornblatt BA, Carrion RE, Addington J, et al. Risk factors for psychosis: impaired social and role functioning. Schizophr Bull. 2012;38:1247–1257.
15. Seidman LJ, Giuliano AJ, Meyer EC, et al. Neuropsychology of the prodrome to psychosis in the NAPLS consortium: rela-tionship to family history and conversion to psychosis. Arch Gen Psychiatry. 2010;67:578–588.
16. Fusar-Poli P, Deste G, Smieskova R, et al. Cognitive func-tioning in prodromal psychosis: a meta-analysis cognitive functioning in prodromal psychosis. Arch Gen Psychiatry. 2012;69:562–571.
17. Addington J, Barbato M. The role of cognitive functioning in the outcome of those at clinical high risk for developing psychosis. Epidemiol Psychiatr Sci. 2012;21:335–342.
18. Buchy L, Perkins D, Woods SW, Liu L, Addington J. Impact of substance use on conversion to psychosis in youth at clinical high risk of psychosis. Schizophr Res. 2014;156:277–280.
19. Birchwood M, Smith J, Cochrane R, Wetton S, Copestake S. The Social Functioning Scale: The development and valida-tion of a new scale adjustment for use in family intervenvalida-tion programmes with schizophrenic patients. Br J Psychiatry. 1990;157:853–859.
20. Heinrichs DW, Hanlon T, Carpenter WT. The quality of life scale: an instrument for rating the schizophrenic deficit syn-drome. Schizophr Bull. 1984;10:388–398.
21. Benton AL, Hamsher K. Mulilingual Aphasia Examinatoin. Owa City: AHA Associates; 1983.
22. Rey A. L’examin clinique en psychologie. Paris: Presse Universitaire de France; 1958.
23. Gold JM, Carpenter C, Randolph C, Goldberg TE, Weinberger DR. Auditory working memory and Wisconsin Card Sorting Test performance in schizophrenia. Arch Gen Psychiatry. 1997;54:159–165.
24. Lyons-Warren A, Lillie R, Hershey T. Short- and long-term spatial delayed response performance across the lifespan. Dev Neuropsychol. 2004;26:661–678.
25. Kirchner WK. Age differences in short-term reten-tion of rapidly changing informareten-tion. J Exp Psychol. 1958;55:352–358.
26. Cornblatt B, Keilp J. Impaired attention genetics, and the pathophysiology of schizophrenia. Schizophr Bull. 1994;20:31–46.
27. Reitan R, Wolfson D. The Halstead-Reitan Neuropsychological Test Battery. Tucson, AZ: Neuropsychology Press; 1985. 28. Golden C. Stroop Color and Word Test Manual (Cat.
30150M). Chicago, IL: Stoelting Co; 1978.
29. Tibshirani R. The lasso method for variable selection in the Cox model. Stat Med. 1997;16:385–395.
30. Simon N, Friedman J, Hastie T, Tibshirani R. Regularization paths for Cox’s proportional hazards model via coordinate descent. J Stat Softw. 2011;39:1–13.
31. mir: Machine Learning in.R.R. package version 2.9. 2016. 32. Addington J, Liu L, Buchy L, et al. North American Prodrome
Longitudinal study (NAPLS 2): the prodromal symptoms. J Nerv Ment Dis. 2015;203:328–335.
33. Perkins DO, Jeffries CD, Cornblatt BA, et al. Severity of thought disorder predicts psychosis in persons at clinical high-risk. Schizophr Res. 2015;169:169–177.
34. Ziermans T, de WS, Schothorst P, et al. Neurocognitive and clinical predictors of long-term outcome in adolescents at ultra-high risk for psychosis: a 6-year follow-up. PLoS One. 2014;9:e93994.
35. Cornblatt BA, Auther AM, Niendam T, et al. Preliminary findings for two new measures of social and role function-ing in the prodromal phase of schizophrenia. Schizophr Bull. 2007;33:688–702.