DEVELOPMENT OF A HUMIDITY-RESISTANT COATING TO IMPART HIGH OXYGEN BARRIER PERFORMANCE TO FOOD PACKAGING FILMS
A Thesis presented to
the Faculty of California Polytechnic State University, San Luis Obispo
In Partial Fulfillment
of the Requirements for the Degree Master of Science in Polymers and Coatings
by
iii
COMMITTEE MEMBERSHIP
TITLE: Development of a Humidity-Resistant
Coating to Impart High Oxygen Barrier Performance to Food Packaging Films
AUTHOR: Ryan Yinghua Cox
DATE SUBMITTED: June 2017
COMMITTEE CHAIR: Raymond Fernando, Ph.D.
Professor of Polymers and Coatings Science Director of Polymers and Coatings Program Department of Chemistry and Biochemistry
COMMITTEE MEMBER: Ajay Kathuria, Ph.D. Assistant Professor of Business
Department of Industrial Packaging and Technology
COMMITTEE MEMBER: Ben Caes, Ph.D.
Innovation Manager CUSA
iv ABSTRACT
Development of a Humidity-Resistant Coating to Impart High Oxygen Barrier Performance to Food Packaging Films
Ryan Yinghua Cox
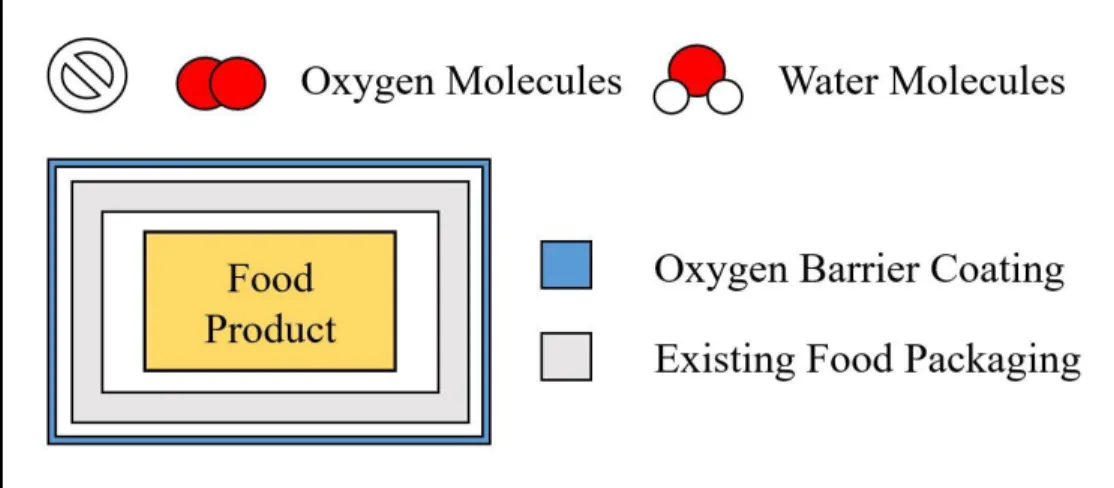
Oxygen barrier coatings have the potential to greatly extend the lifetime of certain food products by incorporating them into existing food packaging. Present technologies face definite challenges of maintaining high performance, while attaining simple and inexpensive preparation methods. The oxygen barrier effect obtained with these coatings is also susceptible to a plasticization effect when exposed to high humidity, since water vapor molecules are readily soluble in typically hydrophilic resins. In this work, we demonstrate a 1 – 2 micron thick oxygen barrier coating, prepared on a 12 micron poly(ethylene terephthalate) substrate, that has oxygen transmission rates as low as 1.44 cc m-2 day-1 under standard conditions and can maintain similar oxygen barrier
v
ACKNOWLEDGMENTS
First and foremost, I would like to thank my advisor, Dr. Ray Fernando, for approaching me with the opportunity to join this project. Over the last year, he has provided insight and assistance, while generally allowing me to take strong ownership of this research to the degree that would be expected in industry.
I would like to thank Dr. Ben Caes and Dr. Scot Pedersen from Siegwerk Corporation for providing the chance to turn their initial concept into the product described herein. Their advice and direction helped drive progress during the project’s duration.
I would like to thank two professors, Dr. Ajay Kathuria and Dr. Malcolm Keif, who have both selflessly taken extensive time out of their schedules to help make this project a success. In their respective fields, each of these professors have helped me understand the complex background information related to preparation and testing of these films. Dr. Kathuria’s involvement allowed use of the MOCON OX-TRAN instrument in the
Industrial Packaging and Technology department. Dr. Keif allowed us to utilize several important film preparation techniques, including use of the QD Proofer and the Mark Andy flexographic printing press located within the Graphic Communications
department. I am grateful to both of these departments for allowing use of facilities and their general support on the project.
vi
I would like to thank Siegwerk Corporation and the Bill Moore Endowment for Financial Support for providing funding for the project. This financial support aided collaboration between departments, and provided the materials that were essential to putting the project into action.
I would like to thank my colleagues Josh Wolcott, Jake Asola, and Jenny Liang for their assistance during the production stages of the project. These undergraduate students worked around their schedules, and took great care in the film preparation and oxygen transmission rate testing to help achieve the goals of the project.
Thank you to the Chemistry and Biochemistry department for permission to use the Kenneth N. Edwards Western Coatings Technology Center for this project. Additional thanks must be expressed to this department for providing an excellent education, caring professors, research opportunities, chemicals, funding, and support throughout my years at California Polytechnic State University, San Luis Obispo.
vii
TABLE OF CONTENTS
Page
LIST OF TABLES ... ix
LIST OF FIGURES ... xii
LIST OF SCHEMES... xiv
CHAPTER 1. INTRODUCTION ... 1
2. BACKGROUND ... 6
2.1 Oxygen Permeability and Transmission ... 6
2.2 Resins ... 9
2.3 Substrates ... 10
2.4 Aqueous Poly(vinyl alcohol) Coatings ... 12
2.5 Sol-gel Coatings ... 13
2.6 Fillers ... 15
3. METHODS AND MATERIALS ... 17
3.1 Materials Used During Coating Preparation ... 17
3.2 Preparation of Over-Print Varnish Polyurethane Coatings with Added Fillers ... 18
3.3 Preparation of Sol-Gel Coatings ... 18
3.4 Preparation of Poly(vinyl alchohol) & Vinyltrimethoxysilane Coatings ... 19
3.5 Preparation of Coated Films Using the QD Proofer ... 20
viii
4. RESULTS AND DISCUSSION ... 24
4.1 Polyurethane ... 25
4.2 Sol-Gel ... 37
4.3 Poly(vinyl alchohol) & Vinyltrimethoxysilane ... 46
4.3.1 74/26 PVOH/VTMS Blends ... 50
4.3.2 85/15 and 97/3 PVOH/VTMS Blends ... 55
4.3.3 90/10 PVOH/VTMS Blends ... 59
4.3.4 Diluted 90/10 PVOH/VTMS Blends ... 61
4.3.5 Block Testing of 90/10 PVOH/VTMS Films ... 63
4.3.6 90/10 PVOH/TEVS and 90/10 PVOH/TEOS Blends ... 65
4.3.7 90/10 PVOH/VTMS Blend Prepared without Heat ... 67
4.3.8 Stability of HCl in a PVOH Stock Solution... 68
4.3.9 90/10 PVOH/VTMS Blend Prepared with Citric Acid... 69
4.4 Press Trials ... 71
5. CONCLUSIONS... 77
ix
LIST OF TABLES
Page Table 1. OTR comparison of common polymer films used as substrates in the food
packaging industry4,27 ... 11
Table 2. 35% NVW OPV polyurethane formulation with and without added filler ... 27
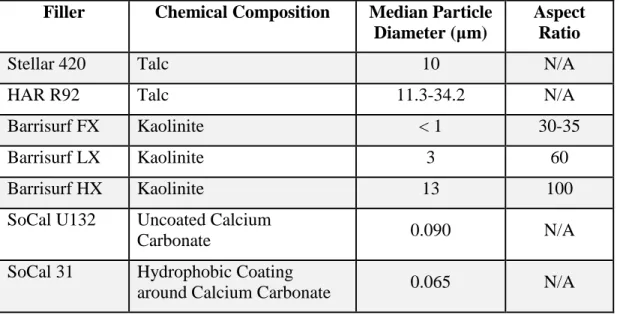
Table 3. Description of filler material compositions, median particle diameters, and aspect ratios as provided ... 28
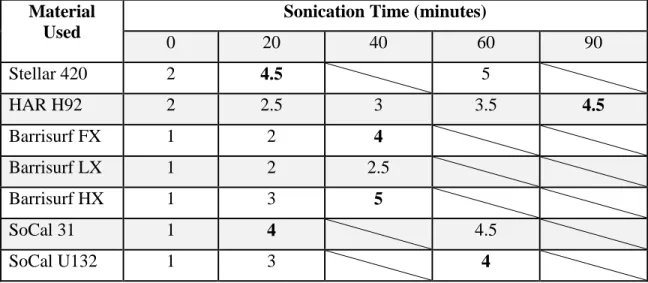
Table 4. Summary of sonication times necessary to achieve proper filler dispersion and coating quality for each filler material ... 30
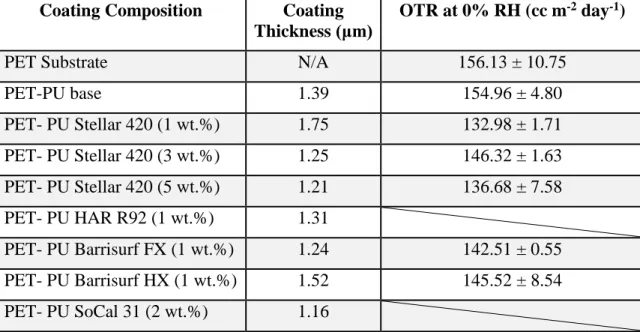
Table 5. Oxygen transmission rates and related thicknesses for the 30% NVW PU formulations ... 34
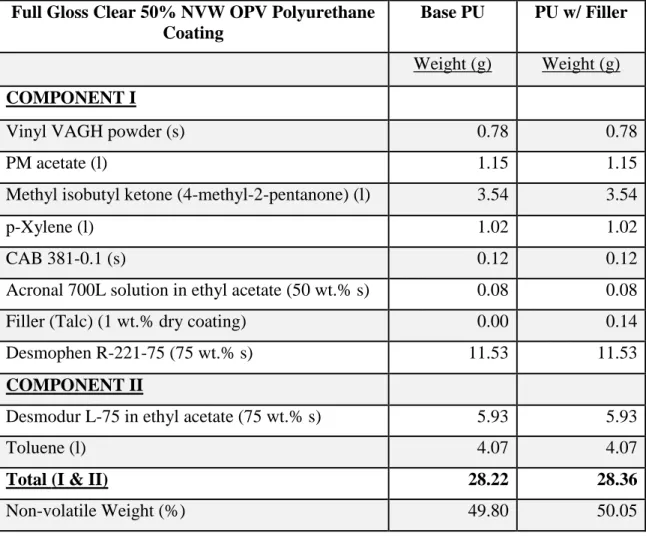
Table 6. 50% NVW OPV PU formulation with and without filler ... 36
Table 7. Oxygen transmission rates and thicknesses obtained for the 50% NVW PU formulations ... 37
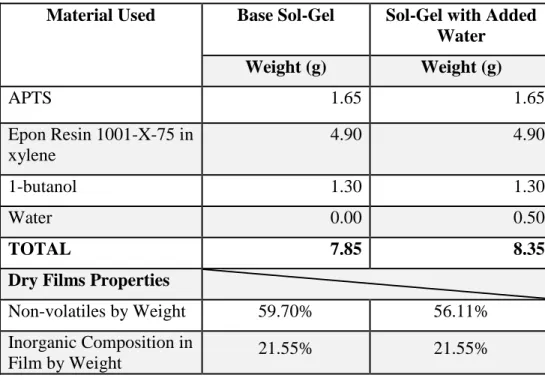
Table 8. Sol-Gel formulation utilizing APTS and Epon 1001-X-75 ... 40
Table 9. Sol-Gel formulation utilizing APTS and ERL 4221 ... 41
Table 10. Sol-gel formulation utilizing TEOS, APTS, and PTOL ... 43
Table 11. Sol-gel formulation utilizing TEOS, GPTMOS, and ERL 4221 ... 44
Table 12. Oxygen transmission rate and properties for the sol-gel systems ... 45
Table 13. Summary of reagent quantities and resultant properties for the 74/26 PVOH/VTMS blends ... 51
x
Table 15. Summary of reagent quantities and resultant properties for the 85/15 and 93/7 PVOH/VTMS blends ... 56 Table 16. Oxygen transmission rates and thicknesses obtained for the 85/15, 93/7
single layer, and 93/7 double-layer PVOH/VTMS films... 57 Table 17. Summary of properties and reagent quantities for the 90/10 PVOH/VTMS
blend ... 60 Table 18. Oxygen transmission rates and thicknesses obtained for the 90/10
PVOH/VTMS films ... 60 Table 19. Summary of properties and reagent quantities for the diluted 90/10
PVOH/VTMS blends ... 62 Table 20. Oxygen transmission rates and thicknesses obtained for the diluted 90/10
PVOH/VTMS films ... 63 Table 21. Summary of properties and reagent quantities for the 90/10 PVOH/TEVS
and 90/10 PVOH/TEOS blends ... 65 Table 22. Oxygen transmission rates and thicknesses obtained for the 90/10
PVOH/TEVS and 90/10 PVOH/TEOS films ... 67 Table 23. Summary of properties and reagent quantities for the 90/10 PVOH/VTMS
blend prepared with a citric acid catalyst ... 70 Table 24. Oxygen transmission rates and thicknesses obtained for the 90/10
PVOH/VTMS films prepared with a citric acid catalyst ... 71 Table 25. Summary of properties and reagent quantities for the 90/10 PVOH/VTMS
xi
xii
LIST OF FIGURES
Page Figure 1. Illustration of the basic concept of oxygen barrier coatings ... 3 Figure 2. Chemical structures of a) PVOH and b) EVOH repeat units ... 12 Figure 3. Illustration of the different outcomes of filler integration within an existing
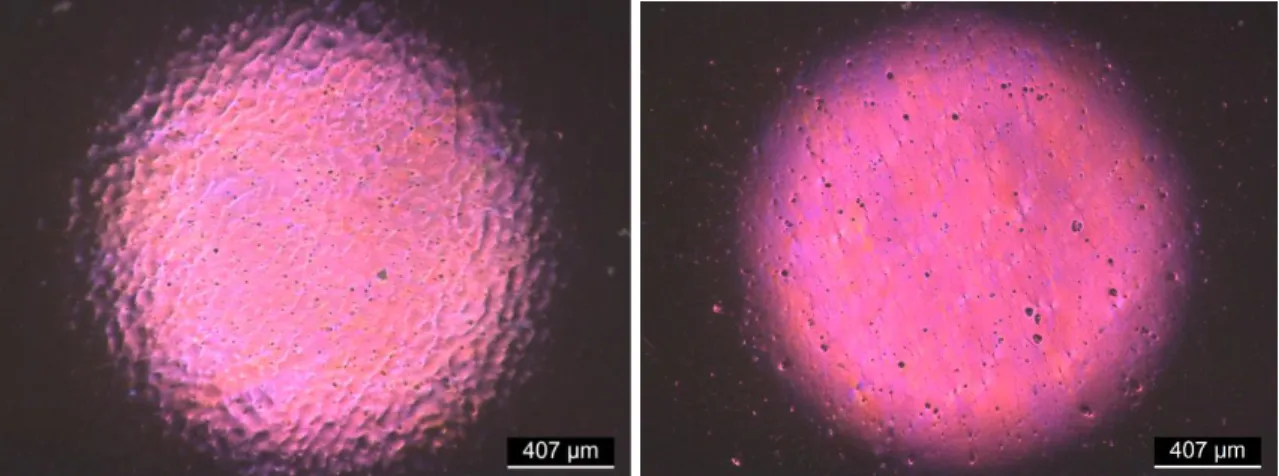
polymeric resin... 16 Figure 4. POM image of unfilled (left) and 1 wt.% Stellar 420 (right) OPV 50%
NVW PU films at 5x magnification... 33 Figure 5. Chemical structures of several commonly used alkoxysilane molecules ... 38 Figure 6. POM image of the TEOS/GPTMOS/ERL 4221 films at 5x magnification ... 46 Figure 7. ATR-FTIR overlay of the traces of VTMS (purple), PVOH (green), and
74/26 PVOH/VTMS (red) films ... 54 Figure 8. POM image of the 74/26 PVOH/VTMS film (left) compared to an
unaltered PVOH film (right) at 5x magnification ... 55 Figure 9. POM images of the 85/15 (left) and 74/26 (right) PVOH films at 5x
magnification ... 58 Figure 10. POM images of the 90/10 PVOH/TEVS film (left) and 90/10
PVOH/TEOS film (right) at 5x magnification... 66 Figure 11. 1H NMR overlay of traces for unreacted PVOH (blue) and the
PVOH/HCl mixture (crimson) ... 69 Figure 12. Images of the up scaled, round bottom reaction setup (left) and Mark
xiii
Figure 13. POM images of M504 2 BCM (top left), M541 2 BCM (top right), M504 6 BCM (bottom left), and M541 6 BCM (bottom right) films at 5x
xiv
LIST OF SCHEMES
Page Scheme 1. The two-step reaction mechanism found in sol-gel chemistry involving
a) hydrolysis of the alkoxysilane and b) condensation of multiple hydrolyzed silane molecules ... 14 Scheme 2. The condensation reaction that would occur between a mixture of PVOH
and an alkoxysilane molecule, from which additional reactions could take place to form a network structure ... 14 Scheme 3. Typical reaction mechanism between a diisocyanate molecule and a
1 1. INTRODUCTION
The development of improved food packaging technologies is driven by the extent of food waste occurring worldwide. Traditionally, the food supply chain is divided into several distinct stages: field growth, post-harvest, processing, distribution, retail, and consumer use.1 The latter two stages mentioned are where enhanced food packaging could provide the largest impact. Packaged foods are typically kept under conditions during the retail and consumer stages that can be detrimental to the quality of the food. This is due to limitations on how well environmental aspects can be controlled while keeping the product available and attractive to the costumer. Food packaging can be modified to provide varying amounts of control over most of these conditions, often resulting in better food preservation.
Looking at recent statistics, food waste continues to grow over time as global
populations simultaneously increase. In 1995, the mass of food lost to waste by stores and households was estimated at 8.6 million metric tons, accounting for roughly half of the loss over the entire supply chain.2 Studies from 2011 have reported that 1.3 billion metric tons of food is wasted throughout all stages of the supply chain, which accounts for a third of all food produced worldwide.3 This inefficiency within the food supply chain is likely to have a major impact on society if they continue to increase with time. An important distinction between food waste occurring in developed countries, like Europe and North America, compared to developing countries, such as Africa and Latin
2
countries, where food is seen as less of a luxury item, leading to increased consumer waste.
Progress in food packaging technology promises an increase in food stability and lifetime that could reduce losses found at both the retail and consumer levels. Higher reduction would then be expected for developed countries due to the consumer mentality towards food use, and a greater capability to invent and integrate new food packaging into existing food packaging systems.
Variables that affect food degradation can be separated into two main classifications: intrinsic factors and extrinsic factors. Intrinsic factors include pH, microbiological activity, chemistry of the product, and the possible interactions between the packaging material and the food product.4 These factors are uncontrollable to a
certain extent since they are dependent on the composition of the food involved. Extrinsic factors are defined as the environment that the food product will experience during its shelf life and consumer usage, including processing conditions, heat exposure and regulation, relative humidity, ultraviolet (UV) and infrared (IR) radiation exposure, and the internal atmospheric composition.
3
including oxide radicals, hydrogen peroxide, and hydroxyl radicals. These chemical species are produced in low percentages, 5 – 10%, during respiration.6 Peroxidation of these polyunsaturated fatty acids form a range of unwanted products that negatively affect the taste and quality of the food. Red meats, in particular, also suffer from significant browning due to oxygen radical reactions with myoglobin.7 Regular myoglobin is converted into metmyoglobin, which in high concentrations changes the food’s appearance. While appearance may not seem as important as food quaily, an improvement of one to two days in color retention would save an estimated $175 million to $1 billion annually for the US meat industry.7
Prevention of this undesired oxidation degradation has traditionally been achieved through storage in dry conditions, which can slow the kinetics of lipid oxidation, and by the introduction of oxygen scavengers or pre-determined atmospheric compositions to the internal environment.8 Recently, oxygen barrier coatings have emerged as a highly-controllable component of food packaging, that can help reduce oxygen permeation and control the atmosphere surrounding the food product (Figure 1).
4
Prominent integration of oxygen barrier plastics and coatings can be traced back to the 1980s. Initial oxygen barrier coatings consisted of metalized plastics that were created using vacuum deposition methods. This technique added a layer of metal, typically aluminum, onto existing plastic films to improve thermal, barrier, and mechanical properties.9 A similar approach involved a multilayer design, wherein several thin layers of varying composition were used, whose overall thickness was the same as a single layer of coating.10 A large number of patents, granted during the 1980s, show the quick
development of oxygen barrier technologies from metalized films11 to enhanced solvent-based barrier coatings.12-14 These older oxygen barrier coating systems gave a strong foundation upon which future technologies could be developed.
5
6 2. BACKGROUND
2.1 Oxygen Permeability and Transmission
To better understand oxygen barrier performance, a review of oxygen permeation fundamentals is required. The permeability of oxygen (P) depends on two parameters, the solubility coefficient (S) and diffusivity coefficient (D) as given by Equation 1.
𝑷 = 𝑺 ∗ 𝑫
(Equation 1)
To model the permeation of an oxygen molecule through a coating, there are two main transitions that must be considered. First, the oxygen molecule must absorb into the polymeric coating, a process dictated by oxygen’s solubility in the particular polymeric resin. This transition must also take place as the oxygen molecule desorbs from the coating. Generally, solubility of a gas within a solid or liquid is generally affected by polarity. Introduction of a polar resin lowers the solubility of oxygen molecules within the coating; called a solubility barrier effect.
7
concept is often referred to as the ‘more torturous path’ in literature, and will be referred to as a diffusivity barrier effect in this study. Diffusivity barrier effects are typically the main mechanism through which strong oxygen barrier coatings control oxygen
permeation.
There are several other factors that can also influence oxygen permeation, such as temperature, humidity, and defects. Temperature always plays an important role whenever kinetics are involved, and higher temperatures have been shown to result in significantly raised oxygen transmission rates.23 Typically, oxygen barrier films are tested at high humidity to see if performance is withheld, which will be discussed in more detail as a significant challenge for this project. Many oxygen barrier coatings degrade in the presence of water, as these polar molecules are readily soluble in their resin structure and can break it apart. The presence of defects within the coating sample facilitate oxygen diffusion causing a diminished barrier performance. Models suggest that defects with a certain radius in the horizontal plane will dominate the diffusion rate in a coating depth three times that of the defect radius.24 Since a small quantity of defects can completely ruin the performance of a barrier coating, the use of sequential layering and optimization of the coating deposition are vital to ensure the success of an oxygen barrier coating.
8
pressure differential (atmospheres or atm) are not accounted for in the OTR expression, as shown in Equations 2 and 3.
𝑶𝑻𝑹 = 𝒗𝒐𝒍𝒖𝒎𝒆 𝒐𝒇 𝒑𝒆𝒓𝒎𝒆𝒂𝒏𝒕 𝒈𝒂𝒔
(𝒇𝒊𝒍𝒎 𝒂𝒓𝒆𝒂)∗(𝒕𝒊𝒎𝒆 𝒅𝒖𝒓𝒂𝒕𝒊𝒐𝒏) = 𝒄𝒄
𝒎𝟐 × 𝒅𝒂𝒚
(Equation 2)
𝑷 = (𝒗𝒐𝒍𝒖𝒎𝒆 𝒐𝒇 𝒑𝒆𝒓𝒎𝒆𝒂𝒏𝒕 𝒈𝒂𝒔)∗(𝒕𝒉𝒊𝒄𝒌𝒏𝒆𝒔𝒔 𝒐𝒇 𝒇𝒊𝒍𝒎)
(𝒇𝒊𝒍𝒎 𝒂𝒓𝒆𝒂)∗(𝒕𝒊𝒎𝒆 𝒅𝒖𝒓𝒂𝒕𝒊𝒐𝒏)∗(𝒑𝒓𝒆𝒔𝒔𝒖𝒓𝒆 𝒅𝒊𝒇𝒇𝒆𝒓𝒆𝒏𝒕𝒊𝒂𝒍) =
𝒄𝒄 × 𝝁𝒎
𝒎𝟐 × 𝒅𝒂𝒚 × 𝒂𝒕𝒎
(Equation 3)
If these two parameters are provided along with the oxygen transmission rate, the equivalent permeability can be readily calculated. Due to the dependence of OTR on thickness and pressure differential, this means that OTRs are only comparable if they are measured at the same film thickness and with the same pressure on either side of the film samples. The terms of oxygen transmission rate and permeability are often used
synonymously in industry and literature.
9
around 10 cc m-2 day-1 under standard temperature and pressure conditions (STP) and 1 cc m-2 day-1 would indicate exceptional oxygen barrier performance.26 This value is important to keep in mind when evaluating the results and progress throughout the project.
2.2 Resins
The major component of all oxygen barrier coatings is the polymeric resin structure which can be modified to specific needs through specialized polymerization routes. The specific requirements necessary for oxygen barrier performance are well defined in literature and include a high degree of polarity, high chain stiffness, inertness to oxygen, high chain packing, intermolecular forces between chains, and high glass transition temperature. 27–30 Most of these characteristics affect either solubility or diffusivity barrier effects. As discussed earlier, solubility barrier effect is due to the difference in polarity between the resin and the permeant gas. Oxygen gas is nonpolar, meaning that, to efficiently keep oxygen molecules from permeating through a coating, a highly polar resin structure should be chosen to lower the solubility of oxygen gas molecules within it. Diffusivity barrier effects result from a combination of contributions including tacticity of the polymer, packing or free volume of adjacent polymer chains, and the
intermolecular forces possible between functional groups. The presence of strong intermolecular forces, like hydrogen bonding and strong dipole moments, can promote the formation of crystalline lamella structures due to the attraction caused between chains. Again, the structural effects that cause a barrier due to diffusivity are more
10
The oxygen permeability related to specific functional groups has been extensively studied, which reinforces the analysis done for the common polymeric substrates. The functional groups with the lowest permeability were alcohol/hydroxyl groups (-OH) and acrylonitrile groups (-CN). Both of these chemical structures provide solubility barrier due to their polar nature, and can hinder oxygen diffusion because of strong hydrogen bonding capability that tightens molecular arrangement or can influence crystalline structure. Comparatively, simple hydrocarbon (C-H) linkages provide insignificant solubility and diffusivity barrier effects, as they are nonpolar and can only form weak London dispersion forces. These carbon-hydrogen bonds are typically highly flexible as well, resulting in a high free volume. The difference in oxygen permeability between high barrier functional groups and these simple hydrocarbon bonds is three orders of magnitude.27 By analyzing the chemical structure, one can predict whether a given resin structure will provide significant barrier performance.
2.3 Substrates
11
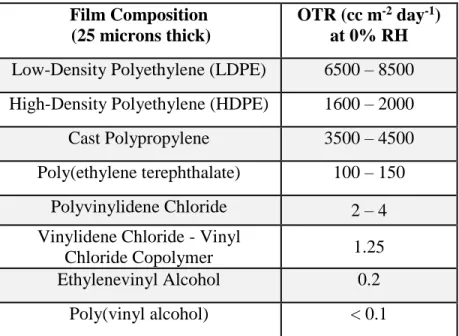
Over thirty different types of polymeric substrates have been used in some form for food packaging; polyolefins and polyesters are the most commonly used.28 Of those polymers, several show strong barrier performance. As shown in Table 1, the OTR values for 25 micron thick polymer films of a vinylidene chloride-vinyl chloride copolymer and ethylenevinyl alcohol (EVOH) copolymer have extremely low OTRs. These OTRs are mainly influenced by the polyvinylidene chloride (PVDC), commonly known as Saran wrap, and poly(vinyl alcohol) (PVOH) components of these copolymers. These high barrier polymers are semi-crystalline and contain polar functional groups, which limit oxygen diffusion and solubility, respectively. Poly(ethylene terephthalate) (PET) has moderate oxygen barrier properties and is commonly used to produce bottles and food packaging. Simple hydrocarbon polymers like polyethylene (PE) and polypropylene (PP) feature high OTRs on account of their simple internal structure and nonpolar nature.
Table 1. OTR comparison of common polymer films used as substrates in the food packaging industry4,27
Film Composition (25 microns thick)
OTR (cc m-2 day-1)
at 0% RH
Low-Density Polyethylene (LDPE) 6500 – 8500 High-Density Polyethylene (HDPE) 1600 – 2000 Cast Polypropylene 3500 – 4500 Poly(ethylene terephthalate) 100 – 150
Polyvinylidene Chloride 2 – 4 Vinylidene Chloride - Vinyl
Chloride Copolymer 1.25
Ethylenevinyl Alcohol 0.2
Poly(vinyl alcohol) < 0.1
12 2.4 Aqueous Poly(vinyl alcohol) Coatings
One of the strongest oxygen barrier polymers, poly(vinyl alcohol), deserves a mention (Figure 2). Both polymers provide OTRs that can be several orders of
magnitudes lower than other packaging polymers. Since PVOH typically comes in the form of crystalline flakes, the easiest way to create a thin coating of this polymer is by utilizing its solubility in water at temperatures near PVOH’s glass transition temperature of 85C.31 By approaching this temperature, an aqueous polymeric solution that is deposited through traditional liquid coating deposition methods, then dried and cured at elevated temperatures. EVOH, a copolymer of poly(vinyl alcohol) and polyethylene, provides comparable oxygen permeation to unaltered PVOH with significantly improved water resistance due to the nonpolar hydrocarbon segments introduced.
Figure 2. Chemical structures of a) PVOH and b) EVOH repeat units
Unlike most polymers, PVOH is synthesized through the hydrolysis of poly(vinyl acetate), making vinyl acetate (CH2CHOCOCH3) the monomeric unit instead of vinyl alcohol (CH2CHOH). Hydrolysis of part of the acetate group under alkaline or acidic conditions provides poly(vinyl alcohol)’s structure. The degree of hydrolysis (in %) has a direct effect on properties such as molecular weight, solubility, flexibility, tensile
13
promotes semi-crystallinity on the order of 20 – 30 % which gives higher tensile strength compared to other polymers.
There are a few limitations that PVOH coatings have that can negatively affect its performance as an oxygen barrier coating. PVOH has a melting point of 215C and tends to thermally degrade through dehydration at temperatures near its melting point.31 This makes the polymer unsuitable for melt processing and other high temperature processing techniques. The other major drawback of PVOH is that water molecules have high solubility in PVOH due to its highly polar nature. Water molecules effectively plasticize the PVOH resin causing defects to form within the coating. This is a common occurance for most high oxygen barrier coatings and other hydrophilic molecules like proteins and polysaccharides.33 At a relative humidity of 85 – 90 %, where water vapor concentration is high, this effect can reduce the oxygen barrier coatings to complete ineffectiveness.
2.5 Sol-gel Coatings
Sol-gel coatings prepared from alkoxysilanes (HSiOR3 or SiOR4) represent another approach to preparing oxygen barrier coatings. The overall two synthetic process, known as sol-gel chemistry, is illustrated in Scheme 1. First, an alkoxysilane is hydrolyzed by excess water resulting in the substitution of short alkoxide (methyl -OCH3 or ethyl – OCH2CH3) groups with hydroxyl groups. The newly formed, reactive hydroxyl groups can then further react through condensation to form Si-O-Si linkages between
14
to the inorganic-organic nature of the resultant resin. The inorganic/organic content of these sol-gel resin systems can be controlled through varying amounts of the initial materials used to prepare them. An acid catalyst is commonly needed in these reactions.
Scheme 1. The two-step reaction mechanism found in sol-gel chemistry involving a) hydrolysis of the alkoxysilane and b) condensation of multiple hydrolyzed silane molecules
An alternative reaction similar to sol-gel reactions is the combination of
alkoxysilanes with PVOH to form a unique structural network with a variety of different linkages. The reaction mechanism that would occur between these molecules is shown in Scheme 2. It is expected that the integration of silane chemistry into a PVOH resin could help improve water resistance by limiting plasticization by water.
15 2.6 Fillers
In a conceptual sense, the integration of filler materials is relatively straightforward as the addition of these platy structures can provide diffusivity barrier effects, lowering OTR. Fillers are commonly used in coating formulations to alter gloss and give coatings a translucent appearance due to their low refractive index. Their use in oxygen barrier coatings, however, can be extremely difficult due to the thin nature of these coatings, and limited ability to utilize advanced alignment methods within an industrial production line. The addition of filler materials like talc, kaolinite, montmorillonite, and hectorite clays in small volume fractions of 0 – 20 % have been used to show improvement in barrier performance.36 Even when randomly oriented, these filler particles can affect the barrier ability of a coating. Enhanced barrier performance is obtained when the orientation of the filler is parallel to the coating surface37, and no defects are introduced in the resin.
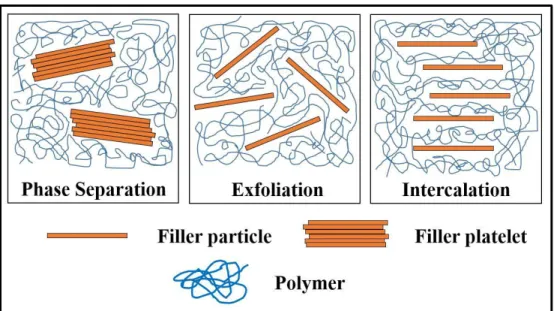
The three most common scenarios that occur when a filler is integrated into a polymer resin are illustrated in Figure 3. The first circumstance produces phase separation, where filler particles remain in small platelets exist separate from the polymeric resin. The improper disperison provides only minor oxygen barrier improvement and risks damaging the initial resin structure via introduction of these clusters.26 The second case is that the resin and polymer form an intercalated structure, where multilayers of alternating filler particles and polymeric resin are present
16
Figure 3.Illustration of the different outcomes of filler integration within an existing polymeric resin
17 3. METHODS AND MATERIALS
All coating compositions were prepared in the Cal Poly Kenneth N. Edwards Western Coatings Technology Center Laboratories. Since the composition and specific formulas changed multiple times over the course of the project, the sources of all materials used and the general procedures for the preparation of these different coatings types are summarized here.
3.1 Materials Used During Coating Preparation
In preparation of the polyurethane coatings, propylene glycol monomethyl ether acetate, toluene, and methyl isobutyl ketone were supplied by Sigma Aldrich. p-xylene was supplied by Fisher Scientific. Acronal 700L was supplied by BASF. Cellulose acetate butyrate (CAB-381-0.1) was supplied by Eastman Chemical Co. Desmophen R-221-75 and Desmodur L-75 were supplied by Bayer MaterialScience. Vinylchloride-acetate-alcohol powder was provided by Siegwerk Corporation. All filler materials: Stellar 420, HAR R92, Barrisurf FX, LX, and HX, SoCal U132 and 31 were supplied by Imerys.
As used for preparing the various sol-gel formulations, 1-butanol, pentaerythritol tetraacrylate, and (3–aminopropyl)triethoxysilane were supplied by Sigma Aldrich. Hydrochloric acid (12 N) was supplied by Fisher Scientific. Epon Resin 1001-X-75 was supplied by Hexion. ERL 4221 was supplied by Polysciences Inc. Darocur 1175 was supplied by Ciba. Glycidoxypropyltrimethoxysilane was supplied by Acros Organics. UVI 6992 was provided by Siegwerk Corporation.
18
vinyltrimethoxysilane, tetraethylorthosilane, and triethylvinylsilane were supplied by the Tokyo Chemical Industry Company. Hydrochloric acid (12 N) was supplied by Fisher Scientific. All materials were used as received without further purification.
3.2 Preparation of Over-Print Varnish Polyurethane Coatings with Added Fillers
Plastic THINKY cups were used to mix and transfer the two component over-print varnish (OPV) polyurethane (PU) formulation. The use of the terms components A and B describe the groups of materials that are prepared separately. Components A and B were prepared in individual cups prior to mixing them together. Materials were added to THINKY cups in the order listed in the PU formulation using a digital scale to accurately measure out each specified mass. Once all materials were added to each component, the cup was placed into a THINKY AR-100 conditioning mixer for 60 seconds. If fillers were added, component A was sealed with Parafilm and the filler material was dispersed using a Branson 2510 bath sonicator prior to mixing with component B. Dispersing times varied between 20 minutes and 90 minutes depending on the filler used. Once properly mixed, components A and B were then combined, stirred for several minutes with a spatula, and were given an hour induction time before use.
3.3 Preparation of Sol-Gel Coatings
THINKY cups were also used in the preparation of the various sol-gel formulations. Depending on whether the system had dual cure capabilities, there were either two or three components. Both components were prepared in individual cups and mixed for 30 minutes using a magnetic stir bar and hot plate. After this mixing period, both
19
(0.025 mL). Typically a 10-20 minute induction time was allowed before use. If
necessary, the third component was added after this curing period and was mixed for 1-2 minutes immediately before use. Thermal curing was conducted by placing the applied film in a Dispatch LDF Series Protocol 3 oven at 60C for 5 minutes. UV curing was accomplished using a LC6 Fusion Conveyor System (“D” lamp I300 Irradiator) operated at a 75 ft/min belt speed was utilized. This curing rate resulted in an estimated dose of 277 mJ/cm2 with a 3200 mW/cm2 peak radiation.
3.4 Preparation of Poly(vinyl alchohol) & Vinyltrimethoxysilane Coatings
A 150 or 250 mL beaker heated with an oil bath and outfitted with a mechanical stirrer was used for the preparation of the poly(vinyl alchohol) (PVOH)/
20
3.5 Preparation of Coated Films Using the QD Proofer
Sample films were prepared using a Harper QD Proofer flexographic doctor-blade printing instrument available in the Cal Poly Graphic Communications Inks & Substrates Laboratory. The speed on the QD Proofer was kept at a setting of 5 on the speed dial throughout its use. The substrate used was a corona-treated, 12 micron thick
poly(ethylene terephthalate) (PET) sheet off of a printing spool provided by Siegwerk Corporation. An anilox roll with a 600 cells per inch (CPI) line screen and a 3.2 billion cubic micron (BCM) cell volume was used in combination with the doctor-blade to deposit coating evenly on the QD Proofer’s base roll. Leftover materials were cleaned from all pieces exposed to the coating between every QD Proofer run to prevent residue buildup and skidding.
A 20 mL vial of the desired coating composition was prepared 24 hours prior to QD Proofer use. Less than a milliliter of coating was required to coat each strip of film. A plastic pipette was used to transfer the mixed coating onto the doctor blade. Once set to ‘Proof’ the QD Proofer would deposit the coating from the doctor blade, onto the anilox roll, then onto the base roll, and finally onto the PET substrate. The coated region appeared evenly distributed with 7 cm width, with leftover coating built up at the edges. The PET substrate width, comparatively, was 10 cm, leaving about a third of the film width uncoated on either edge of the substrate. A 32 cm long strip of the coated PET film was cut, placed on a piece of cardstock, and transferred into an JEIO Tech Lab
21
to as a ‘double-layer’ film, the original cured single layer film was fastened on the QD Proofer, another layer of coating was deposited, and the film was subjected to a second curing period.
3.6 Oxygen Transmission Rate Testing
All oxygen transmission rate tests were conducted in the Cal Poly Industrial
Packaging and Technology Laboratory. Oxygen transmission rate was measured using a MOCON OX-TRAN 2/22 Model L instrument. The units of these OTRs were expressed in milliliters of oxygen gas per square meter of film per day of testing (cc m-2 day-1). Continuous testing mode was utilized with an hour of conditioning time and advanced manually after approximately 12 hours; normally following the general procedure
described in ASTM D3985-05.9These tests used a 98% nitrogen/2% hydrogen mixture as the carrier gas and oxygen as the test gas at a constant temperature of 23°C and pressure of 1 atm. Relative humidity (RH) either was tested at 0% or 90% RH.
For each coating composition, two set of tests were run to ensure reproducibility, with each test involving use of both sampling cells of the OX-TRAN instrument, yielding a total of four trials. Occasionally one to three trials were obtained due to damaged samples or malfunctions of the instrument.
22
noticeable defects. The inner plastic backing was removed from both faces of the mask to expose the adhesive backing and the square of film was placed over one face’s cutout. The second face was then folded over to enclose the mask with the coated side of the film oriented downwards. In order to mount the samples, Apiezon T grease was used to seal the mask onto the metal half of either of the OX-TRAN instrument’s sampling cells with the coating oriented downwards. The second half of the cell was placed underneath the metal half enclosing the film mask in-between.
3.7 Coating and Film Characterization
Viscosity profiles were extensively taken toward the later stages of development of the PVOH/VTMS blends. After preparation, the viscosity was monitored approximately every two hours for the first 24 hours and progressively for up to a month after. A TA Instruments Discovery Hybrid Rheometer (DHR-2) was equipped with a 2 40 mm cone set to a 55 micron gap to measure the shear viscosity. A 60 second test was conducted at a shear rate of 10 s-1 and a temperature of 25C, giving viscosity values as a function of time. The 60 second viscosity was used for all reported measurements.
Solids content was determined closely following ASTM D2369-10. Samples of the coatings were weighed prior to being heated in a Dispatch LFD series Protocol 3 oven at 110C for an hour. Each sample was then weighed after oven treatment to quantify the weight loss due to water and solvent evaporation. Aluminum pans were used to hold the samples and a typical 1-2 gram coating sample was spread out over the bottom of each pan.
23
weighed individually on a digital scale to determine coating weight, using a square piece of aluminum foil below them to prevent static. The length, width, and mass were entered in an Excel sheet, which, along with the estimated density of the coating, were used to determine the coating thickness.
While this thickness determination method seems like an inaccurate method, the thickness obtained from sample to sample with different compositions generally agreed closely with one another. However, to justify that the thicknesses resulting from this procedure were a proper indication of the actual coating thickness, verification by an advanced method was sought after. First, attempts to measure the coating thickness by imaging the cross-section using a Leica DM2500P Polarized Optical Microscope (POM) and FEI Quanta 200 Scanning Electron Microscope (SEM) were conducted. Use of the SEM was provided by the Materials Engineering department. These methods didn’t allow for accurate determination of thickness since the cross-section was typical not cleanly cut and differentiation between the coating layer and the substrate was impossible. One time use of a white light interferometer was provided by the Civil and Environmental
Engineering department. This spectroscopy method allows for 3D mapping of a sample’s surface height profile using the information provided by light wave fronts. The
24 4. RESULTS AND DISCUSSION
At the beginning of the project, a conference call was conducted with the entire team of students, professors, and Siegwerk representatives to distinctly set several key
objectives for the envisioned oxygen barrier coating. Several polymeric films were considered as substrates for this project including polyethylene, poly(ethylene
terephthalate), and polypropylene. From these choices, PET was selected for use due to its medium oxygen barrier performance, good mechanical properties, high thermal ceiling, and resistance to shrinking.4 The barrier coating was to preferably be
solventborne to allow for versatile film formation; alternatively a dual cure formulation, or waterborne formulation was desired. The ideal working viscosity was expected to be 50 seconds on a #2 Zahn cup, which is roughly equivalent to 100-200 mPa s. A high solids percentage was desired to produce a clear, continuous coating with a thickness no greater than 2 microns. The dried, cured film was expected to be water resistant, have no objectionable odor, and be able to resist heat exposure up to 100C. The oxygen
transmission rate of this coated film at 0% relative humidity was expected to meet or exceed the performance of leading barrier films. An OTR of 1 – 10 cc m-2 day-1 is the standard for food packaging applications.24 Testing of prepared films at high humidity was a necessary task to test water resistance. Poly(vinyl alchohol), ethylenevinyl alcohol (EVOH), and polyvinyldiene chloride (PVDC) systems were to be avoided ether due to environmental concerns with the chemicals involved or due to the difficulty involved in creating a novel variation of existing coating compositions.
25
Corporation, and sol-gel formulations found commonly in literature studies. As the name suggests, the OPV PU is typically used as a thin, transparent laminate layer put on paper prints. This polyurethane formulation was not expected to provide significant oxygen barrier performance without alteration, since the resin is amphiphilic in nature and doesn’t form significant internal structure. The desired oxygen barrier performance was hypothesized to be obtainable through the addition of filler material to the PU
formulation. In this system, it was vital to ensure effective dispersion of the filler particles throughout the coating depth to allow for diffusivity barrier effects. If proper integration of the filler was demonstrated, significant reduction of OTR of the coated film was expected when compared to the OTR of the substrate. In contrast, the sol-gel
approach would develop dense organic-inorganic networks formed through hydrolysis and condensation reactions. These coatings were expected to have significantly higher oxygen barrier performance than the OPV PU coatings. This prediction was based on the dense resin structure formed in a sol-gel coating that can act as a diffusion barrier for both oxygen molecules and water molecules attempting to permeate through the coating.
4.1 Polyurethane
26
crystallinity formed by the polyurethane resin is largely dependent on the ratio between ‘hard’ segments of the polyurethane, composed of mainly by aromatic regions with low free volume, and ‘soft’ segments, composed of flexible hydrocarbon and ester bonds that have high free volume. The low degree of crystallinity expected in this polyurethane formulation thus limits contribution to oxygen barrier from diffusivity barrier effects.
Scheme 3. Typical reaction mechanism between a diisocyanate molecule and a polyol forming a polyurethane
This PU formulation has a moderate non-volatile weight (NVW) of 35%, otherwise made up of solvents including propylene glycol monomethyl ether acetate (PM acetate),
p-xylene, methyl isobutyl ketone,and toluene. These providing optimal solubility for the resin components and help control the film formation process. Small amounts of
vinylchloride-acetate-alcohol (VAGH) powder, CAB 381-0.5, and Acrynol 700L are added to help control characteristics of the coating such as viscosity, chemical resistance, adhesion, toughness, and hardness. Once solubilized, these molecules have active
functional groups that can also be integrated into the network structure of the resin. In low levels (1 – 3 wt. % of the dry film composition), filler materials were expected to be fairly easily dispersed through mechanical or hand mixing.36 The OPV PU formulation is shown in Table 2, both with and without filler additions. Integration of these filler
27
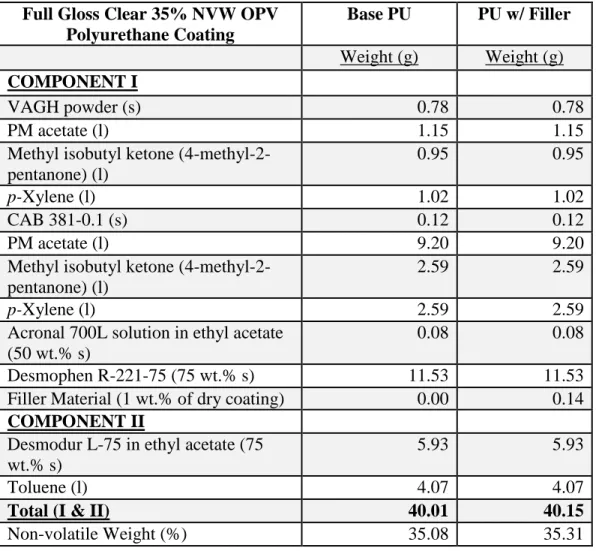
Table 2. 35% NVW OPV polyurethane formulation with and without added filler
The main focus in the early stages was to successfully integrate each filler variation into the OPV PU coating, while maintaining a uniform and transparent coating for each system. Several fillers were selected for testing from materials already available in the Kenneth N. Edwards Western Coatings and Technology Center, or that were obtained by Siegwerk Corporation. The fillers that were used are summarized in Table 3 with
compositions, particle sizes, and aspect ratios as detailed by the supplier. The Stellar 420 and HAR R92 fillers were talcs that have significantly different median particle
diameters. Kaolinite clays, known by tradenames Barrisurf FX, LX, and HX, were
Full Gloss Clear 35% NVW OPV Polyurethane Coating
Base PU PU w/ Filler
Weight (g) Weight (g)
COMPONENT I
VAGH powder (s) 0.78 0.78
PM acetate (l) 1.15 1.15
Methyl isobutyl ketone (4-methyl-2-pentanone) (l)
0.95 0.95
p-Xylene (l) 1.02 1.02
CAB 381-0.1 (s) 0.12 0.12
PM acetate (l) 9.20 9.20
Methyl isobutyl ketone (4-methyl-2-pentanone) (l)
2.59 2.59
p-Xylene (l) 2.59 2.59
Acronal 700L solution in ethyl acetate (50 wt.% s)
0.08 0.08
Desmophen R-221-75 (75 wt.% s) 11.53 11.53
Filler Material (1 wt.% of dry coating) 0.00 0.14
COMPONENT II
Desmodur L-75 in ethyl acetate (75 wt.% s)
5.93 5.93
Toluene (l) 4.07 4.07
Total (I & II) 40.01 40.15
28
claimed to disperse well in aqueous media and their varying aspect ratios allow for comparison of how different particles shapes affect the ease of dispersion. Both the talc and kaolinite fillers fall under the classification of a clay, and are provided in the form of platelets of clay particles that require adequate dispersion for most uses. Two calcium carbonate materials, SoCal U132 and 31, were also used as filler materials. These calcium carbonates were the only true nanofillers according to the average median particle. This is an important distinction from the micro-sized clay particles, as the nanofiller may ease the dispersion process. As a result, these calcium carbonate nanofillers could provide larger improvements in OTR.
Table 3. Description of filler material compositions, median particle diameters, and aspect ratios as provided
Filler Chemical Composition Median Particle
Diameter (μm)
Aspect Ratio
Stellar 420 Talc 10 N/A
HAR R92 Talc 11.3-34.2 N/A
Barrisurf FX Kaolinite < 1 30-35
Barrisurf LX Kaolinite 3 60
Barrisurf HX Kaolinite 13 100
SoCal U132 Uncoated Calcium
Carbonate 0.090 N/A
SoCal 31 Hydrophobic Coating
around Calcium Carbonate 0.065 N/A
29
within the coating, and the retention of full transparency. After obtaining several cured films with grainy textures and translucent appearance, it became apparent that hand mixing originally used in preparation of the PU formulation was insufficient to properly disperse the filler materials.
Since the THINKY AR-100 conditioning mixer had already been used in the
preparation of the OPV PU formulations, hand mixing was replaced by a 1 minute run in the THINKY mixer in an attempt to better disperse the filler within the coating. This approach caused the filler particles to be pulled out of the mixture, accumulating at the bottom of the THINKY cup. This effect was explained by the centrifugal force that the THINKY mixer utilizes in its mixing mechanism, which can force solid materials to settle out. Instead, a Branson 2510 bath sonicator was used to aid in dispersion of the fillers. This instrument emits ultrasound waves through a water filled metal reservoir, which can break apart clustered particles. In order to keep the plastic THINKY cups submerged in the ultrasound bath, metal clamps were utilized, attached to an adjacent ring stand. The THINKY cups were sealed with Parafilm to prevent agitated water from splashing into the formulation.
For each filled PU system, aliquots of the sonicated coatings were taken at regular intervals for up to 90 minutes to determine how much ultrasound sonication was
30
was obtained yielding a homogenous and transparent coating. All of the PU coatings were translucent when applied to the glass plates, though, once dried and cured they reverted to near transparency. The summary of these results are illustrated in Table 4, organized by filler material. The optimal sonication times for each filler material are indicated by a bolded number. For example, the Stellar 420 filler gave significantly improved dispersion after 20 minutes of sonication, while 90 minutes was required to achieve the same level coating quality for the larger HAR H92 talc particles. Sonication times resulting in a quality value of 4 – 5 for a given filler were considered to provide good enough particle dispersion and coating quality to justify preparing actual films on the QD Proofer using that filled PU system.
Table 4. Summary of sonication times necessary to achieve proper filler dispersion and coating quality for each filler material
Material Used
Sonication Time (minutes)
0 20 40 60 90
Stellar 420 2 4.5 5
HAR H92 2 2.5 3 3.5 4.5
Barrisurf FX 1 2 4
Barrisurf LX 1 2 2.5
Barrisurf HX 1 3 5
SoCal 31 1 4 4.5
SoCal U132 1 3 4
From the talc compositions, it was immediately apparent that the Stellar 420 talc
31
diameter of any of the fillers at 34.2 microns, the high end of the range specified by the provider. This diameter is over three times as long as the second longest filler particle, and may be the main reason poor dispersion results from integration of the HAR R92 particles compared to Stellar 420 particles. Since the coating layers produced using the QD Proofer were 1 – 2 microns thick, it is easy to speculate that larger filler particles are harder to properly align within the coating layer, especially without causing defects to occur. Due to significantly ease of dispersion and better coating quality, the Stellar 420 filler was designated for further testing out of the two talc compositions.
The Barrisurf kaolinite clays provided by Siegwerk had a range of aspect ratios that could be used to compare the effect that different particle shapes have on the ability to disperse individual particles. Barrisurf FX, LX, and HX have an increasing median diameter and aspect ratio in the order listed. Interestingly, the three kaolinite grades didn’t provide a direct relationship between particle size and quality of dispersion. The smallest median particle, Barrisurf FX, and the largest median particle, Barrisurf HX, showed similar dispersion and coating transparency at an optimal sonication time of 40 minutes. The Barrisurf HX kaolinite particles have a median particle diameter of 13 microns, similar to the size of Stellar 420 talc particles. For this reason, Barrisurf HX was picked to represent the kaolinite filler composition, so that its OTR could be directly compared with the OTR obtained from films of the Stellar 420 PU system.
32
Use of the QD Proofer to prepare coated films gave higher reproducibility from sample to sample than films prepared using the drawdown bar on glass plates.
Occasionally the base roll would skid while depositing the coating layer, or residue from a previous run would cause consistent defects in the coated region. These films were discarded since damage to the coating could cause major increases in OTR. Both of these problems could be remedied, either through adding grease to portions of the base roll, or by cleaning the pieces of the doctor blade, anilox roll, and base roll more extensively between uses. Films prepared on the QD Proofer had uniform thickness across the coated area, typically 1 – 3 microns thick, varying slightly between compositions. The thinner films didn’t exhibit any problems with increased translucency, since the path length taken by light through the coating isn’t long enough for a hiding effect to occur. None of these films showed the grainy texture observed in the thicker glass drawdown coatings.
33
Figure 4. POM image of unfilled (left) and 1 wt.% Stellar 420 (right) OPV 50% NVW PU films at 5x magnification
Masked samples were prepared to begin oxygen transmission rate testing on the MOCON OX-TRAN instrument as soon as films of the unaltered and filled OPV PU formulation had been prepared on the QD proofer. Before testing the filled PU films, reference OTRs at 0% relative humidity were measured for the 12 micron thick, uncoated PET substrate, as well as a coated film of the base PU formulation. For the bare substrate and OPV PU coated film, OTR values of 156.13 cc m-2 day-1 and 154.96 cc m-2 day-1 (0.75% reduction), respectively, were obtained from an average of four samples per film type. These two oxygen transmission rates established a baseline of approximately 155 cc m-2 day-1, and confirmed that the unfilled PU coating doesn’t display significant oxygen barrier performance.
34
similar to prominent oxygen barrier coatings, these formulations were far from the barrier performance expected. The OTRs of the other filler compositions are listed in Table 5, along with the coating thickness. Due to time constraints, the OTRs of HAR R92 and SoCal 31 filled PU films were not tested.
Table 5. Oxygen transmission rates and related thicknesses for the 30% NVW PU formulations
The lack of improvement seen by these filler additions could be attributed to a variety of reasons. The most likely contribution comes from the inability to properly intercalate or exfoliate the filler into the resin. Without this thorough dispersion, filler particles are not expected to align within the coating, limiting their ability to provide substantial diffusivity barrier effects. The slight OTR reduction observed can still be explained simply due to the integrated filler materials that provide low diffusivity barrier effects, even if they are only randomly or partially oriented with the coating.
The most significant result coming from the preparation of these filled PU films was the average dry coating thickness using the specified anilox roll. Thickness of these films
Coating Composition Coating
Thickness (μm)
OTR at 0% RH (cc m-2 day-1)
PET Substrate N/A 156.13 ± 10.75
PET-PU base 1.39 154.96 ± 4.80
PET- PU Stellar 420 (1 wt.%) 1.75 132.98 ± 1.71
PET- PU Stellar 420 (3 wt.%) 1.25 146.32 ± 1.63
PET- PU Stellar 420 (5 wt.%) 1.21 136.68 ± 7.58 PET- PU HAR R92 (1 wt.%) 1.31
35
was consistently an average value of 1.35 microns, within the target thickness
specifications established for the project. Since other coating resin compositions were predicted to have similar solids percentages, viscosities, and film formation processes, thicknesses of any films prepared on the QD Proofer were expected to remain within 1 – 2 microns. Thicknesses obtained throughout the project confirm this expectation.
In response to the inadequate OTR reduction observed for the 35% NVW filled PU formulations, the PU formulation was adjusted to raise the non-volatile weight from 35% to 50. This change to the formulation was expected to increase the dry coating thickness. By increasing the thickness of the coating layer, it was thought that any defects resulting in the thinner films would be less likely to occur from a thicker deposition. These thicker coatings may also allow more depth for the filler particles to effectively orient, without causing defects near the surface of the coating layer. The adjusted 50% NVW PU
36
Table 6. 50% NVW OPV PU formulation with and without filler
Full Gloss Clear 50% NVW OPV Polyurethane Coating
Base PU PU w/ Filler
Weight (g) Weight (g)
COMPONENT I
Vinyl VAGH powder (s) 0.78 0.78
PM acetate (l) 1.15 1.15
Methyl isobutyl ketone (4-methyl-2-pentanone) (l) 3.54 3.54
p-Xylene (l) 1.02 1.02
CAB 381-0.1 (s) 0.12 0.12
Acronal 700L solution in ethyl acetate (50 wt.% s) 0.08 0.08
Filler (Talc) (1 wt.% dry coating) 0.00 0.14
Desmophen R-221-75 (75 wt.% s) 11.53 11.53
COMPONENT II
Desmodur L-75 in ethyl acetate (75 wt.% s) 5.93 5.93
Toluene (l) 4.07 4.07
Total (I & II) 28.22 28.36
Non-volatile Weight (%) 49.80 50.05
The change in NVW had little effect on the preparation of the coatings or films but did show a noticeable increase in viscosity to 500 mPa.s. The viscosity of the 35% NVW PU coatings was never directly measured, but was estimated to be in the 100-300 mPa.s range. The thickness of these coatings was, on average, slightly higher than the 30% NVW PU film samples, but the quality of the coatings didn’t appear different. Again, the OTR testing for these 50% NVW PU films came back with poor oxygen barrier
37
formulation had no significant effect on the OTR compared to the that of the base PU film. These results strongly suggest that the limited reduction of OTR for these filled OPV PU coatings was due to improper dispersion and alignment of the filler particles within the coating layer.
Table 7. Oxygen transmission rates and thicknesses obtained for the 50% NVW PU formulations
Coating Composition Thickness (μm) OTR at 0% RH
(cc m-2 day-1)
PET-PU Base 1.77 154.09 ± 4.38
PET-PU Stellar 420 (2 wt.%) 1.77 155.00
From these results, it was clear that having a resin structure with poor oxygen barrier ability wasn’t going to achieve high reduction in OTR without introducing complex dispersion methods. The biggest drawback was an inability to qualify the extent of dispersion of the filler particles and their orientation in the cured coating. No solutions to this problem were thought of that could fit the specifications of the project and enable use this system moving forward given the up-scaling capabilities required of it.
4.2 Sol-Gel
38
further reduce OTR. This would require additional investigation into dispersion of the filler of course. Four sol-gel systems were designed and prepared while investigation into the filled over-print varnish polyurethanes was also happening.
The key component behind these sol-gel systems are alkoxysilanes. Alkoxysilanes comprise one to four Si-O-R linkages about the central Si atom are found in one
molecule. The R group(s) are alkyl groups, such as methyl (-CH3) or ethyl (-CH2CH3). Some examples of alkoxysilane molecules include tetraethylorthosilane (TEOS), (3– glycidoxypropyl)trimethoxysilane (GPTMOS), (3–aminopropyl)triethoxysilane (APTS), vinyltrimethoxysilane, and triethoxyvinylsilane (TEVS), which are shown along with other common alkoxysilanes in Figure 5.
39
The reaction between alkoxysilane molecules occurs in a two-step reaction mechanism. In the first step, the alkoxysilanes undergo a hydrolysis reaction involving water and an acid catalyst. This hydrolysis reaction cleaves silyl ether groups (Si-O-R), which are immediately replaced with hydroxide groups. This causes each alkoxysilane arm of the molecule to be converted into a reactive silanol (Si-O-H) which can react with another hydrolyzed alkoxysilane to form a Si-O-Si linkage. A different crosslinking molecule can be added into these sol-gel systems that has reactive groups such as amines, epoxides, or alcohols, that can covalently bond with silanol groups once the alkoxysilane undergoes hydrolysis. These reactions continue extensively until the majority of
molecules have been integrated into a network resin structure.
Significant testing was done with each composition in order to achieve and optimize the curing time and quality of the resulting coatings. Varying the mole ratios of the initial reagents helped control reaction rates and the inorganic-organic content of the resin. Often, with increasing inorganic content, the mixture would rapidly form an opaque gel. The finalized formulations for these sol-gel systems had variable working times before gelation occurred. Batches were prepared immediately preceding film preparation. The earliest sol-gel formulation prepared was a system composed of
(3-aminopropyl)triethoxysilane and Epon Resin 1001-X-75. Epon Resin 1001-X-75 is an aromatic resin with epoxide functionality allowing it to crosslink with another molecule such as APTS.43 Thermal curing methods were used with this initial sol-gel formulation. The formulation used for this APTS/Epon sol-gel coating is shown in Table 8.
40
Table 8. Sol-Gel formulation utilizing APTS and Epon 1001-X-75
Material Used Base Sol-Gel Sol-Gel with Added
Water
Weight (g) Weight (g)
APTS 1.65 1.65
Epon Resin 1001-X-75 in xylene
4.90 4.90
1-butanol 1.30 1.30
Water 0.00 0.50
TOTAL 7.85 8.35
Dry Films Properties
Non-volatiles by Weight 59.70% 56.11%
Inorganic Composition in
Film by Weight 21.55% 21.55%
This APTS/Epon formulation was found to have a working lifetime of
approximately 4 hours. After this period, the viscosity raised past a critical level, forming an opaque gel. The addition of water into the formulation was shown to speed up the curing rate. How the lifetime would differ with varying quantities of water was hard to accurately predict. Once these sol-gel coatings were formulated, they were given a 30 minute induction time prior to film preparation on the QD Proofer. Thermal curing at 65C for an hour was enough to progress these sol-gel films to a dry to the touch state. The average thickness associated with this formulation was 2.06 microns.
41
the resin structure may also hinder oxygen barrier due to an increased oxygen solubility in the resin. The APTS/ERL 4221 sol-gel formulation is given in Table 9.
Table 9. Sol-Gel formulation utilizing APTS and ERL 4221
Material Used Weight (g) Non-volatile Weight (g)
APTS 1.65 1.01
Water 0.50 0.00
Butanol 1.30 0.00
ERL 4221 1.22 1.22
Total 4.67 2.23
Dry Films Properties
Non-volatiles by Weight 47.75%
Inorganic Composition in
Film by Weight 45.29%
Film preparation on the QD Proofer was never done using this formulation, but drawdowns were prepared using a 5 mil drawdown bar on a glass plate. This APTS/ERL 4221 sol-gel formulation took longer to reach a dry to touch state, and the glass
drawdowns needed heating in the oven at 65C for 24 hours to ensure complete curing. The films prepared following this formulation were clear and continuous with a similar working lifetime to the APTS/Epon sol-gel formulation of approximately 4 hours. In industry, shorter thermal treatments can help significantly reduce cost during preparation. For this reason, the curing times necessary for this coating are undesirable.
Dual cure sol-gel formulations were also of interest, since the utilization of UV curing or thermal curing is possible. The ability to cure the films within seconds via UV radiation can be easily integrated into a film printing line, eliminating problems
42
(Table 10) attempted was modeled around APTS and TEOS molecules that form the basis of the resin. Pentaerythritol tetraacrylate (PTOL) was also included in this formation for its acrylate group functionality. These acrylate groups can be used to extend the sol-gel network structure via Michael addition reactions with amine
functionality as well as through photo-induced free-radical polymerization when paired with a photoinitiator package, like Darocur 1173.45 UV exposure can provide the energy to catalyze free-radical formation, which rapidly react causing a tight chemically-bonded network to form within the coating. The extensive resin structure eventually formed from these three molecules was expected to give high diffusivity barrier effects to reduce the OTR of the substrate.
Compared to the thermal cure sol-gel formulations, the coated film quality of the TEOS/APTS/PTOL mixture was no different than those previously tested on the QD Proofer. A potential drawback to this formulation is that, once mixed, it only has a working lifetime of 10 – 20 minutes before gelation occurs. Working lifetime, or pot life, is a term used to describe the time period in which the mixture’s composition and
condition are acceptable for use. Having a working lifetime of at least 8 hours
43
Table 10. Sol-gel formulation utilizing TEOS, APTS, and PTOL
Material Used Weight (g) Non-volatile
Weight (g)
TEOS 2.5 0.72
Water_TEOS 0.86 0.00
Butanol_TEOS 0.88 0.00
HCl, conc 0.03 0.00
APTS 2.5 1.53
Water_APTS 0.75 0.00
Butanol_APTS 1.03 0.00
HCl, conc 0.03 0.00
PTOL 1.2 1.20
Darocur 1173 0.1 0.10
Total 9.88 3.55
Dry Films Properties
Non-volatiles by Weight 35.93%
Inorganic Composition in
Film by Weight 40.65%
44
Table 11. Sol-gel formulation utilizing TEOS, GPTMOS, and ERL 4221
Material Used Weight (g) Non-Volatile
Weight (g)
TEOS 6.45 1.86
GPTMOS 3.60 2.55
Water 3.37 0.00
HCl, conc 0.06 0.00
ERL 4221 2.04 2.04
UVI 6992 0.32 0.00
TOTAL 15.84 6.45
Dry Films Properties
Non-volatiles by Weight
40.72% Inorganic Composition in
Film by Weight 41.19%
Like the other sol-gel coatings, no defects or opacity problems were observed in the coated films prepared on the QD Proofer. Both thermal and UV cure methods provided rapid curing of films similar to the TEOS/APTS/PTOL sol-gel films. The average thickness of the TEOS/GPTMOS/ERL 4221 films prepared on the QD Proofer was 1.24 microns.
45
reduction) at 0% RH. The reduction of OTR provided by the 1 wt.% Stellar 420 PU coating of 12% was still better than the reduction from the APTS/Epon coating. All the sol-gel film OTRs are illustrated in Table 12.
Table 12. Oxygen transmission rate and properties for the sol-gel systems
Coating Composition Thickness (μm) OTR at 0% RH
(cc m-2 day-1)
PET - APTS/Epon Resin Sol-Gel 2.03 143.55 ± 5.19
PET - APTS/ERL 4221 Sol-Gel
PET - TEOS/APTS/PTOL Sol-Gel 1.39 144.1
PET -TEOS/GPTMOS/ERL 4221 Sol-Gel 1.24 163.37 ± 14.82
46
Figure 6. POM image of the TEOS/GPTMOS/ERL 4221 films at 5x magnification
It is difficult to explain why these sol-gel formulations didn’t perform as well as some successful oxygen barrier coatings demonstrated in literature. The procedure behind making these sol-gel coatings isn’t extremely complex, however, variation of molar ratios between components of each formulation seems to have a strong impact on how fast and to what extent the sol-gel reaction occurs. Given the OTR results obtained between the polyurethane and sol-gel oxygen barrier coatings, it was apparent that these approaches weren’t close to achieving the 1 – 10 cc m-2 day-1 target oxygen transmission rate.
4.3 Poly(vinyl alchohol) & Vinyltrimethoxysilane
47
outlining synthetic conditions, curing conditions, oxygen permeability, and oxygen transmission rates for various barrier coating systems. A particular interest was taken in studies that reported oxygen transmission rates since the relative improvement between the coated and uncoated films could be compared for these systems. Considering only examples of oxygen barrier coatings that showed improvements of ~85% or more,
thirteen papers were selected that met that qualification. Several of these articles could be ruled out as future directions for this project, either due to use of expensive technologies that were not available on the Cal Poly campus, or insufficient detail in their procedures to effectively replicate and develop the system
One paper stood out among others as a potential system for this project because of a simple preparation procedure, data suggesting significant reduction in OTR, and a similar nature to the sol-gel systems previously tested.46 This oxygen barrier coating was
prepared through a two component, solution-based system utilizing an acid catalyst. The concept was to combine sol-gel chemistry into the typical poly(vinyl alcohol) structure, to create an intrinsically strong oxygen barrier resin. The general reaction mechanism closely resembles that of sol-gel systems, since PVOH has pendant hydroxyl groups that can undergo condensation reactions with hydrolyzed VTMS molecules. For the sol-gel chemistry to occur, hydrolysis of silyl ether (Si-O-R) linkages in the VTMS molecule occurs under acidic conditions, forming reactive silanol (Si-O-OH) moieties.