Sasan Mahmoodi, Member, IEEE, Bayan S. Sharif, Member, IEEE, E. Graeme Chester, John P. Owen, and
Richard Lee
Abstract—An automated knowledge-based vision system for skeletal growth estimation in children is reported in this paper. Images were obtained from hand radiographs of 32 male and 25 female children of age 1–16 yr. Phalanx bones were automatically localized and segmented using hierarchical inferences and active shape models, respectively. A number of shape descriptors were obtained from the segmented bone contour to quantify skeletal growth. From these descriptors, a feature vector was selected for a regression model and a Bayesian estimator. The estimation accuracy was 84% for females and 82% for males. This level of accuracy is comparable to that of expert pediatric radiologists, which suggests that the proposed approach has a potential application in pediatric medicine.
Index Terms—ASM segmentation, Bayesian estimation, feature extraction, skeletal growth assessment.
I. INTRODUCTION
S
KELETAL age assessment is often required in diagnosing or monitoring growth disorders, or in some cases as an aid to predicting ultimate height. The two main methods used in pediatric radiology are attributed to Greulich and Pyle [1] and Tanner and Whitehouse (TW2) [2]. Both methods are based on assessment of bone morphology from hand radiographs. However, such manual assessment procedures tend to be laborious and prone to inter and intra observer inconsistency. An automated assessment process, based on digital image analysis, is thus highly desirable, and considerable effort has been dedicated toward this aim. Conventional image analysis methods have been applied for bone segmentations and classi-fications [3]–[7]. Pal et al. [8] proposed an algorithm based on fuzzy logic to automate skeletal age assessment based on TW2 [2]. Levitt et al. suggested an artificial intelligence approach based on Bayesian inference to localize and segment phalanges [9]. However, these techniques attained limited success due to faint bone edges and significant intensity variation throughout the hand radiographic image. In our approach, we used knowl-edge-based techniques, such as hierarchical inferences and active shape models (ASM) to localize and segment bones, respectively [10], [11]. A number of shape descriptors were obtained from the segmented bone contour to quantify skeletal growth. These descriptors were particularly selected to reflectManuscript received December 7, 1999.
S. Mahmoodi, B. S. Sharif, and E. G. Chester are with the Department of Electrical and Electronic Engineering, University of Newcastle, Newcastle upon Tyne, U.K.
J. P. Owen and R. Lee are with the Department of Radiology, University of Newcastle, Newcastle upon Tyne, U.K.
Publisher Item Identifier S 1089-7771(00)02789-8.
growth-related shape variations in the metaphysis-epiphysis junction. A Bayesian classifier was then applied to the de-scriptors to estimate skeletal growth. The paper is organized as follows. In Section II, bone localization and segmentation methods are described. Bone shape descriptors are presented in Section III. Section IV presents a Bayesian approach for age estimation. Discussion and concluding remarks are provided in Section V.
II. BONELOCALIZATION ANDSEGMENTATION
A. Hierarchical Bone Localization
Hand radiographs are characterized by a large optical density range due to varying levels of X-ray absorption by bones and soft tissue. For example, distal phalanges are thinner and appear darker than proximal phalanges and carpal bones. Therefore, global bone edge detection schemes often fail when applied to digitized radiographic images, and alternative local schemes must be used. In our approach, anatomical and intensity infer-ences were used in order to localize bones prior to boundary de-tection. A hierarchical approach was used to “locate and infer” starting from the hand object in the radiographic image and ter-minating with bone localization. Binary thresholding was used to segment the hand to produce a hand silhouette, and a con-cave–convex detection algorithm was then applied to localize the finger tips and bases. Finally, anatomical knowledge of the finger was used in addition to gray-level information to localize bones [12].
B. Active Shape Models Training
Bone contour detection, using active shape models, is based on active deformation of an approximate contour superimposed on the localized bone. This deformation is constrained by prior ASM training, and, for this purpose, we used a training set of 57 sample bones from 32 male and 25 female children, at various stages of normal skeletal growth.
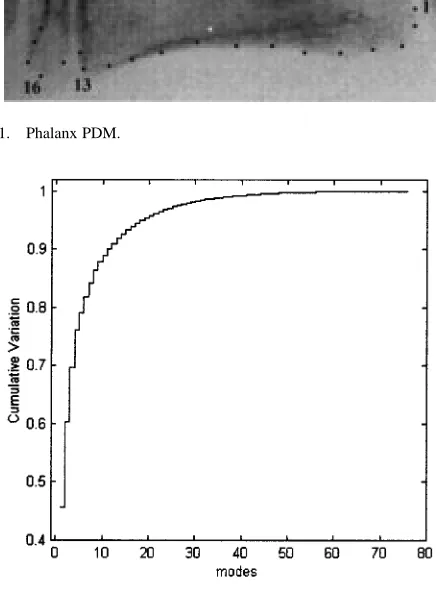
A bone is considered to be a class of shapes described by a set of points known as a point distribution model (PDM). Fig. 1 shows an -point PDM of the middle phalanx of the middle finger. In this study, was set to 38 and the PDM points were manually assigned to salient locations of the phalanx to ensure that variation of the PDM points over the training set corre-sponded to growth-related development. Since we are only in-terested in shape variations during growth, all sample PDMs were aligned by scaling, rotation, and translation with respect
Fig. 1. Phalanx PDM.
Fig. 2. Cumulative contour variations for the 76 modes in the feature space.
to an arbitrary reference PDM. The mean PDM and the covari-ance matrix were then calculated, and variation modes were ob-tained from the eigenvectors and eigenvalues of the covariance matrix. The most significant variation modes were generated by the eigenvectors corresponding to the larger eigenvalues. There-fore, a small number of modes were sufficient to describe most variations, and new shapes could then be approximated by ap-plying the most significant modes to the Hotelling transform [11] as follows:
(1)
where is the approximated shape which defines the contour space, is the mean shape, is a matrix whose columns are the eigenvectors responsible for the most significant variation modes, and is a vector of weights which defines the feature space. Fig. 2 shows the cumulative contour variations for all 76 ( ) modes. The cumulative variations revealed that the first 35 modes corresponded to 99% of contour variations. Therefore, these modes were chosen and higher modes that corresponded to very small variations were discarded to improve computa-tional efficiency. New shapes could therefore be reconstructed by varying vector . To ensure shape plausibility, each element of the weight vector was limited to the Mahalonobis dis-tance based on the 97% confidence interval [11], i.e.,
[image:2.612.54.275.108.403.2](2)
Fig. 3. Contour shape deformations due to the variations of the second mode.
where and are the th element of vector and the th eigen-value of the covariance matrix, respectively. Each element of vector is responsible for one mode of shape variations. Fig. 3 shows the shape variations caused by varying be-tween 60 and 60.
C. Bone Contour Detection
The mean bone contour shape is obtained from the ASM training set and is used as the initial contour in an iterative algorithm to detect the test bone contour. Also, from hierar-chical localization, we have a priori knowledge of the scaling ( ), rotation ( ), and translation ( ) necessary to superimpose the initial contour on the test bone. The iterative algorithm is summarized in the Appendix. At each iteration, an image contour displacement is generated using the maximum image derivative along lines normal to the previous contour PDM. The derivative can be approximated using methods such as the Sobel, derivative of Gaussian, or the multiscale derivative of Gaussian [13]–[15]. In this study, the derivative of Gaussian was used to estimate the image derivative. The image contour displacement produces a change in scaling ( ), rotation ( ), and translation ( ). A scaling and rotation transformation is then applied on the tentative image contour to produce a displacement in the local frame contour. A new feature vector is then obtained which is tested for plausibility using the criterion in step 7). Finally, the new local frame and image con-tours are updated in steps 8) and 9), respectively. The iterative algorithm stops when consecutive contour differences reach a set threshold. Fig. 4 shows three iterations of the ASM contour detection algorithm, namely the 1st, 4th, and the final 12th iteration. The residual errors were small ( 1 pixel) and were considered to be acceptable by expert pediatric radiologists, based on qualitative assessment.
III. BONESHAPEDESCRIPTIONS
(a)
(b)
[image:3.612.85.248.59.624.2](c)
Fig. 4. ASM contour fitting. (a) Iteration 1. (b) Iteration 4. (c) Iteration 12.
TABLE I
CORRELATION COEFFICIENTS OF THE
[image:3.612.306.551.60.351.2]SHAPEDESCRIPTORS WITHRESPECT TOGROWTHAGE
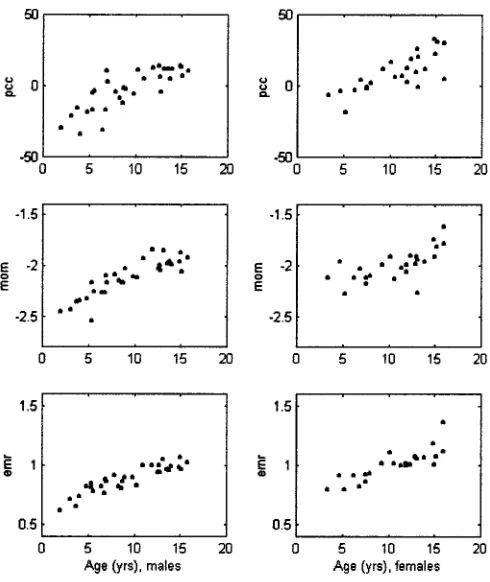
Fig. 5. Scatter diagrams of shape descriptors with respect to growth age.
TABLE II
CORRELATION OF THEFIRSTFOURPRINCIPALCOMPONENTCOEFFICIENTS WITHGROWTH
A. Principal Component Coefficients (PCC)
(a) (b)
Fig. 6. (a) Phalanx PDM and (b) signature of the proximal end.
growth estimation feature vector. This result is further demon-strated in Fig. 3, where variations of correspond to significant shape variations in the epiphysis.
B. Shape Moments (MOM)
The PCC is a global contour shape parameter that describes phalanx development including the epiphysis region. To obtain a finer scale representation of the epiphysis, its shape moment was measured as a local parameter to describe epiphysis devel-opment. To generate the shape moment, three reference PDM points are chosen, as shown in Fig. 6: two at the epiphysis–meta-physis joint (A & B) and one midway between them (C). The contour between A and B is then traversed clockwise, and the Euclidean distance to reference point C is measured to gen-erate a 1-D signature representation of epiphysis contour varia-tions [13]. Different order moments of this signature were cal-culated; however, only the fourth-order moment was selected by the finite interception test for inclusion in the estimation feature vector.
C. Epiphysis-to-Metaphysis Ratio (EMR)
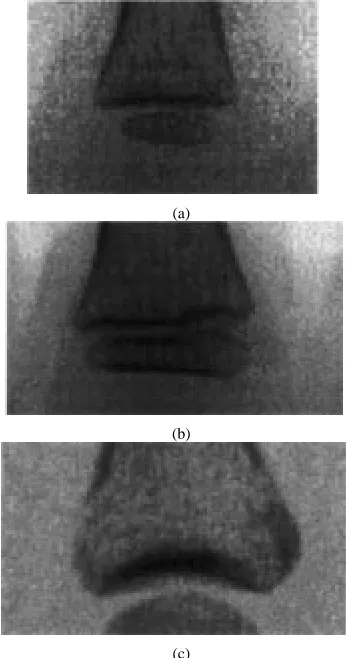
The metamorphosis of the epiphysis is used by expert pedi-atric radiologists as an important indicator of growth. Its genesis occurs at the early stages of skeletal growth (around 1 year). The epiphysis then grows in size relative to normal skeletal growth and eventually, at the latest growth stages, fuses with the phalanx metaphysis [2]. This development of the epiph-ysis–metaphysis junction is illustrated in Fig. 7. To quantify this growth-related development, we defined a descriptor to measure the ratio of epiphysis width to metaphysis width in the phalanx PDM. This is obtained, as indicated in Fig. 1, from the Euclidean distance between PDM points (16, 23) for the epiphysis and (13, 26) for the metaphysis.
IV. AGEESTIMATION
The feature vector [PCC MOM EMR], selected by the finite interception test was used to model growth by calculating linear regression equations from the training set (32 males and 25 fe-males) [17]. Table III shows the slopes of the regression lines
(a)
(b)
(c)
Fig. 7. Proximal part of the proximal phalanx for: (a) 4-, (b) 8-, and (c) 16-yr-old growth stages.
TABLE III
REGRESSIONLINESLOPES FOR THESHAPEDESCRIPTORS WITHRESPECT TO
GROWTH AT A95% CONFIDENCEINTERVAL
computed by using student- distribution, for the descriptors dis-cussed in Section IV with a 95% confidence interval.
Using the Bayes principle in decision-making theory [18], an age value “ ” is estimated to minimize the risk function
(3)
where is the true age, and is the prior probability func-tion which is assumed uniform, since all age groups occur with equal probability. , and are the loss and Gaussian sample distribution functions, respectively, given as
(4)
[image:4.612.44.285.62.245.2]where is the estimation resolution (0.5 yr), is the descriptor parameter vector, is its mean vector determined from the re-gression curve for a given age , and is the covariance matrix of the descriptors over the training set. Since the prior proba-bility is uniform, the sample distribution function plays a signif-icant role in estimating growth age using the Bayesian approach. This is more accurate than a simple regression algorithm or a canonical-correlation-based approach where a sample distribu-tion funcdistribu-tion is not considered.
Without loss of generality, we assume the same variance for all age groups. An interval estimation of variance for different descriptors is inferred by using the Chi-square distribution with 95% confidence interval. This is shown in Table IV.
By minimizing the risk function of (3), we then have
(6)
The estimated age “ ” was computed using the trapezoidal nu-merical integration method.
A hold-one-out approach was used, where one sample was excluded and and were obtained from the remaining data set in order to estimate the age of the excluded sample. Using the feature vector [PCC MOM EMR], the Bayesian algorithm produced 82% 3% and 84% 3% accuracy for males and fe-males, respectively. The mean error was estimated with a 95% confidence interval. The estimation error was higher for very young children, which could be attributed to the assumption of equal variance for all age groups. We suggest that a more sophis-ticated model for variance, which requires far more samples for both sexes, would lead to a lower relative error.
V. DISCUSSION ANDCONCLUSIONS
In the past, skeletal age assessment has been tedious and unre-liable due to human interaction in pediatric age assessment. This process could be facilitated by the automated system presented in this paper. The main processing blocks of the system such as seg-mentation, description, and estimation are typical constituents of most computer vision solutions for healthcare systems. How-ever, a number of unique characteristics pertaining to hand ra-diographs have necessitated a knowledge-based approach to both bone segmentation and localization. A number of inferences was made from anatomical and optical density knowledge of hand ra-diographs. The large optical density range has meant that a global segmentation approach, such as conventional edge detection or thresholding could not be used. A local knowledge-based seg-mentation approach based on active shape models proved to be a
for skeletal assessment when the manual detection of such fuzzy edges is in itself coarse and subjective.
At the next level of the analysis hierarchy, a set of three pa-rameters describing bone shape was extracted to quantify the appearance variations of bones with respect to growth age. A shape descriptor (PCC) was obtained from ASM segmentation by using the Hotelling transformation from the data to the fea-ture space. The other two descriptors were the shape moment of the proximal part of the phalanx (MOM), and the ratio of epiphysis width to metaphysis width (EMR). These descriptors exhibited large correlation with growth and were selected by the finite interception test (at a 5% level of significance) for the age estimation feature vector. Other descriptors that also correlated to growth were discarded by the test. This could be explained by a colinear relationship with correlation.
Age estimation based on the Bayesian principle was ap-plied to the significant growth-related parameters, and this has yielded a level of accuracy ( 82%) comparable to that of pediatric radiologists. Other authors have reported lower accuracy (75% and 63%) based on computer image analysis of the phalanx and carpal regions, respectively [6]. It should be noted that skeletal age estimation could be further improved, using the proposed system in this paper, by using more samples to accurately model the shape descriptors’ variance.
At different stages of maturity, it is possible for various bones to be more advanced or retarded due to growth abnormality. Therefore, a more precise estimation may be achieved by segmenting more bones in a hand radiograph. However, carpal bones appear in the later stages of growth and are continuously deformed throughout the growth process. In these cases, more general-purpose localization and contour detection methods such as genetic algorithms and active contour models are suggested to initially approximate the bone shape. This shape approximation would then be improved by continuing the segmentation process using the ASM algorithm.
The proposed automated assessment system, in this paper, is robust and reliable and free from inter–intra inconsistencies, which can result from different radiologists’ assessment or even from the same radiologist at different times. Experience shows that these inconsistencies can be up to 15%. Furthermore, age assessments based on methods proposed by medical atlases such as the TW2 method relate only to the populations considered in the atlases, whereas the proposed approach can be adapted to other populations with different growth rates. The only require-ment is that growth estimation is obtained from the training set of the target population.
APPENDIX
SUMMARY OF THEASM CONTOURDETECTIONALGORITHM
model training is achieved. is a transformation operator used to scale and rotate PDM points. is a principal component coefficient vector corresponding to the contour. is a matrix whose columns are the eigenvectors of the contour covariance matrix. is the th eigenvalue of the contour covariance matrix.
For iteration until :
1) 2)
3) Compute
4) , ,
5) 6)
7) for each element in if then
8)
9) .
REFERENCES
[1] W. W. Greulich and S. I. Pyle, Radiographic Atlas of Skeletal Develop-ment of Hand Wrist, 2 ed. Palo Alto, CA: Stanford Univ. Press, 1971. [2] J. M. Tanner, R. H. Whitehouse, W. A. Marshall, M. J. R. Healy, and H. Goldstein, Assessment of Skeletal Maturity and Prediction of Adult Height (TW2 Method). New York, NY: Academic, 1975.
[3] D. J. Michael and A. C. Nelson, “HANDX: A model-based system for automatic segmentation of bones from digital hand radiographs,” IEEE Trans. Med. Imag., vol. 8, no. 1, pp. 191–193, 1990.
[4] D. T. Morris and C. F. Walshaw, “Segmentation of the finger bones as a prerequisite for the determination of bone age,” Image Vis. Comput., vol. 12, no. 4, pp. 239–245, 1994.
[5] B. S. Sharif, S. A. Zaroug, E. G. Chester, J. P. Owen, and R. E. J. Lee, “Bone edge detection in hand radiographic images,” in Proc. IEEE EMBS Conf., 1994.
[6] E. Pietka, “Computer-assisted bone age assessment based on features au-tomatically extracted from a hand radiograph,” Comput. Med. Imaging Graph., vol. 19, no. 3, pp. 251–259, 1995.
[7] C. C. Ko, C. W. Mao, C. J. Lin, and Y. N. Sun, “Image analysis for skeletal evaluation of carpal bones,” in Proc. SPIE, vol. 2501/2, 1995, pp. 951–961.
[8] A. Pathak and S. K. Pal, “Fuzzy grammars in syntactic pattern recogni-tion of skeletal maturity from X-rays,” IEEE Trans. Syst., Man, Cybern., vol. SMC-16, no. 5, pp. 657–667, 1986.
[9] T. S. Levitt, M. W. Hedgcock Jr., D. Vosky, and V. M. Shadle, “Model-based prediction of phalanx radiograph boundaries,” in Proc. SPIE, vol. 1898, 1993, pp. 670– 678.
[10] N. D. Efford, “Knowledge-based segmentation and feature analysis of hand wrist radiographs,” School of Computer Studies, University of Leeds, Report 94.31, Research Report Series, 1994.
[11] T. F. Cootes, C. J. Taylor, D. H. Cooper, and J. Graham, “Active shape models-their training and application,” Comput. Vis. Image Understanding, pp. 38–59, 1995.
[12] S. Mahmoodi, B. S. Sharif, E. G. Chester, J. P. Owen, and R. E. J. Lee, “Automated vision system for skeletal age assessment using knowledge based techniques,” in Proc. 6th Int. Conf. Image Processing and its Ap-plications (IEE), 1997, pp. 809–813.
[13] R. C. Gonzalez and R. E. Woods, Digital Image Processing. Reading, MA: Addison-Wesley, 1993.
[14] J. Canny, “A computational approach to edge detection,” IEEE Trans. Pattern Anal. Machine Intell., November 1986.
[15] S. Mahmoodi, B. S. Sharif, and E. G. Chester, “Contour detection using multi-scale active shape models,” in Proc. Int. Conf. Image Processing (IEEE), 1997, pp. 708–711.
[16] P. R. Krishnaiah, “Selection of variables under univariate regression models,” in Handbook of Statistics. Amsterdam, The Netherlands: North-Holland, 1982, vol. 2, pp. 805–820.
[17] J. E. Freund and G. A. Simond, Modern Elementary Statis-tics. Englewood Cliffs, NJ: Prentice-Hall, 1992.
[18] J. O. Berger, Statistical Decision Theory, Foundations, Concepts and Methods. Berlin, Germany: Springer-Verlag, 1980.
Sasan Mahmoodi (M’94) received the B.S. degree
from Amirkabir University of Technology in 1988, the M.S. degree from Sharif University of Technology, Tehran, Iran, in 1991, and the Ph.D degree from the University of Newcastle, Newcastle upon Tyne, U.K., in 1998.
He currently holds a Research Fellowship in math-ematical analysis of human vision from the Univer-sity of Newcastle. His current research interests are in medical signal and image processing and mathe-matical modeling of human vision.
Dr. Mahmoodi is an Associate Member of the IEE.
Bayan S. Sharif (M’93) received the B.S. degree
from Queen’s University of Belfast, U.K., in 1984 and the Ph.D. degree from Ulster University, U.K., in 1988.
In 1989, he held a Research Fellowship post at Queen’s University of Belfast, where he worked on parallel programming algorithms for image processing applications. He joined the University of Newcastle, Newcastle upon Tyne, U.K., in 1990 as a Lecturer in electronic engineering. He is currently a Professor at the University of Newcastle with research interests in DSP algorithms for digital communications and image processing.
Dr Sharif is a Chartered Engineer and a Member of the IEE.
E. Graeme Chester received the B.S. and Ph.D.
de-grees from the University of Newcastle, Newcastle upon Tyne, U.K. in 1979 and 1983, respectively.
He was appointed Lecturer in 1984 after working one year as a Research Associate on VLSI design automation. His current research interests are in medical signal and image processing and microelec-tronics system design.
Dr Chester is an Associate Member of the IEE.
John P. Owen received the M.B.B.S. degree from the University of Newcastle,
Newcastle upon Tyne, U.K., in 1968, the D.M.R.D. degree (London) in 1972, and the F.R.C.R. degree (London) in 1974.
In 1981, he was appointed Senior Lecturer at the University of Newcastle and Honorary Consultant Radiologist at the Royal Victoria Infirmary. Since 1988, he has been the Head of the University Department of Radiology. He is currently Editor of the Imaging Journal and is on the Editorial Board of the British Journal of Radiology.
Dr. Owen is a member of the British Institute of Radiology, the Scottish Ra-diological Society, and the RaRa-diological Society of North America.
Richard Lee received the B.Sc. degree in anatomy in 1967 and the M.B.B.S.
degree in 1970 from Lada University. He received the M.R.C.S. and the L.R.C.P. degrees (London) in 1969 and the F.R.C.R. degree (London) in 1975.
Since 1980, he has been a Consultant Pediatric Radiologist at the Royal Vic-toria Infirmary and a Clinical Lecturer in Radiology with the University of New-castle, Newcastle upon Tyne, U.K.