DEVELOPMENT OF MICROARRAY TECHNIQUES FOR THE
STUDY OF GENE EXPRESSION IN THE EUROPEAN EEL
(ANGUILLA ANGUILLA) DURING SILVERING AND MIGRATION
TO SEAWATER
Iain Stuart McWilliam
A Thesis Submitted for the Degree of PhD
at the
University of St. Andrews
2008
Full metadata for this item is available in the St Andrews
Digital Research Repository
at:
https://research-repository.st-andrews.ac.uk/
Please use this identifier to cite or link to this item:
http://hdl.handle.net/10023/502
Development of microarray techniques for the
study of gene expression in the European eel
(
Anguilla anguilla
) during silvering and
migration to seawater
Iain Stuart M
cWilliam
A thesis presented for the degree of Doctor of Philosophy at the
University of St Andrews
Acknowledgements
This study was carried out within the Biomolecular Osmoregulatory Research Group at the University of St Andrews and was funded by the Natural Environment Research Council; grant NER/T/S/2001/00282. The group is headed by Dr Gordon Cramb and thanks go to him for providing guidance and expertise where mine fell short. Thanks also to Dr Svetlana Kalujnaia who was directly involved in the study and to Dr Chris Cutler who was there at its inception. The other members of the group and technical staff, past and present have also helped me along the way; Dr Lara Meischke in particular was always a refuge of sanity. A special thank you to Dr Val Smith and the members of her Comparative Immunology Group who were always accommodating and helpful with my QPCR experiments.
To my friends who brightened up my periods of experimental darkness; Jamie, Paul, Vic, Rob, Timda, Stevie, Ally and the rest of the Crusties and surfing mates; Alice (who even after witnessing my entire PhD rollercoaster hasn’t been dissuaded from taking the plunge); to my friends from undergrad days, Fearghal, Babs, Kirsty and Aki; to all the Friday night St Andrews pub crowd and finally to Mother Nature who sends me waves. I’m lucky to know you all and I promise there’ll be no more eel chat for a while.
Huge thanks to all my family for their love and support, especially to my brothers and their clans, Peter et al and Grant et al (I really am getting a job
now), to my granddad Neil, and of course to Mum and Dad who proofread the whole thing but more importantly gave me the opportunities and freedom that got me here in the first place.
Declarations
I, Iain Stuart McWilliam, hereby certify that this thesis, which is approximately 65,000 words in length, has been written by me, that it is the record of work carried out by me and that it has not been submitted in any previous
application for a higher degree. Date
Signature of candidate
I was admitted as a research student in October 2001 and as a candidate for the degree of PhD in October 2002; the higher study for which this is a record was carried out in the University of St Andrews between October 2002 and January 2007.
Date
Signature of candidate
I hereby certify that the candidate has fulfilled the conditions of the Resolution and Regulations appropriate for the degree of PhD in the University of St Andrews and that the candidate is qualified to submit this thesis in application for that degree.
Date:
Signature of supervisor
In submitting this thesis to the University of St Andrews I understand that I am giving permission for it to be made available for use in accordance with the regulation of the University Library for the time being in force, subject to any copyright vested in the work not being affected thereby. I understand that the title and abstract will be published, and that a copy of the work may be made and supplied to any bona fide library or research worker, that my thesis will be electronically accessible for personal or research use, and that the library has the right to migrate my thesis into new electronic forms as required to ensure continued access to the thesis. I have obtained any third-party copyright permissions that may be required in order to allow such access and migration. Date:
Acknowledgements 3
Declarations 4
1.0 Abstract 7
1.1 Table of abbreviations 8
2.0 Introduction 10
2.1 The eel life-cycle 13
2.2 Introduction to osmoregulation 18
2.3 Osmoregulatory adaptations: Gill 19
2.4 Osmoregulatory adaptations: Renal system 26
2.5 Osmoregulatory adaptations: Intestine 30
2.6 Introduction to brain function in osmoregulation and development. 32
2.7 Introduction to Microarray Technology 39
2.8 Hypothesis and aims. 43
3.0 Materials and methods 44
3.1 Animal treatment and tissue collection 45
3.2 Metadata 47
3.3 Total RNA Extraction 48
3.4 Messenger RNA Isolation 50
3.5 Commonly used techniques, buffers and oligonucleotides 51
3.6 SMART cDNA PCR Amplified Library 55
3.7 CloneMiner™ cDNA library: Procedures 58
3.8 Second generation (2G) CloneMiner™ libraries 63
3.9 Normalisation 64
3.10 Post-biotinylation of DNA 65
3.11 Cloning of 18S and 28S rRNA fragments 66
3.12 Driver production 67
3.13 Subtraction with pH directed hybridisation. 68
3.14 Temperature directed subtraction in the presence of formamide. 69
3.15 Temperature directed subtraction in the absence of formamide. 70
3.16 Third generation (3G) CloneMiner™ libraries 71
3.17 Investigation of SA-PMP non-specific binding 72
3.18 Solvent treatment of SA-PMPs to remove DNA. 73
3.19 NeutrAvidin™ biotin binding protein agarose beads 74
3.20 Inclusion of spin-columns to separate NeutrAvidin™ beads 75
3.21 Suppression Subtractive Hybridisation. 76
3.22 Creation of a high quality subtracted attB brain library 77
3.23 RNA Amplification 80
3.24 Microarray probes, labelling and hybridisation 82
3.25 Sequencing analysis 86
3.26 Microarray data acquisition, normalisation and analysis 87
3.27 Real-time Quantitative PCR Assays 92
4.0 Results 93
4.1 Metadata 94
4.2. RNA Quality Analysis 96
4.3 Overview of cloning method evolution 98
4.4 SMART cDNA PCR amplified library 100
4.5 CloneMiner™ cDNA library 104
4.6 Second generation (2G) CloneMiner™ libraries 109
4.7 Normalisation 111
4.8 Post-biotinylation of cDNA 118
4.9 Subtraction 121
4.10 Non specific DNA binding by SA-PMPs 129
4.11 NeutrAvidin™ biotin binding protein agarose beads: Specific and non-specific
DNA binding capacity 132
4.12 Suppressive Subtraction Hybridisation cDNA libraries 135
4.13 Creation of the high quality subtracted attB brain library 141
4.14 RNA amplification for microarray hybridisation 144
4.16 Optimising microarray print quality 153
4.17 Validation of array reproducibility 160
4.18 Brain microarray results: Comparison of brain gene expression profiles between 7
day FW yellow and 5 month FW acclimated silver eels. 162
4.19 Brain microarray results: Comparison of brain expression profiles between 2 day
freshwater acclimated and 2 day seawater acclimated silver eels 183
4.20 SSH multi-tissue array results 194
4.21 Online Holdings Database 195
4.22 Validation of the brain microarray results 197
4.23 Real Time Quantitative PCR (QPCR) Assays 199
4.24 QPCR Primer Design and Optimisation 205
4.25 QPCR assay of A. anguilla 14-3-3 and VRK3 expression in yellow 7 day FW and
silver 5 month FW acclimated eel brain. 217
4.26 QPCR assay of prolactin expression in silver 2 day FW and silver 2 day SW
acclimated eel brain. 220
4.27 Confirmation of 14-3-3 protein clone identity. 225
4.28 Confirmation of Vaccinia related kinase 3 protein clone identity 228
4.29 Confirmation of prolactin precursor protein clone identity 230
5.0 Discussion 231
5.1 Gene expression changes during the life cycle of the eel. 234
5.2 Gene Expression Changes During Osmoregulation 243
5.3 Development of a new microarray platform for a non-model species. 246
5.4 Future studies 250
6.0 References 251
Appendices on the accompanying CD.
Appendix 1 CloneMiner cDNA Library Construction Kit
Appendix 2 PCR-Select cDNA Subtranction Kit User Manual
Appendix 3 Kalujnaia, S., McWilliam, I. S., Feilen, A. L., Nicholson, J., Zaguinaiko, V. A., Hazon, N., Cutler, C. P., Balment, R. J., Cossins, A. R., Hughes, M. et al. (2007). Salinity adaptation and gene profiling analysis in the European eel
(Anguilla anguilla) using microarray technology. General and Comparative
Endocrinology.
Appendix 4 Kalujnaia, S., McWilliam, I. S., Zaguinaiko, V. A., Feilen, A. L., Nicholson, J., Hazon, N., Cutler, C. P. and Cramb, G. (2007b). A transcriptomic approach to the study of osmoregulation in European eel Anguilla anguilla. Physiol.
1.0 Abstract
The European eel, Anguilla anguilla, has a complex life-cycle involving
migrations between the Sargasso Sea and the river systems of Europe and North Africa. The requirement to move across large salinity gradients presents a significant physiological challenge and the developmental stages of the eel are closely linked to these migrations. Microarrays were created to elucidate gene expression changes occurring during;
i. The transition from juvenile yellow to the adult sexually maturing, migrating silver eel and;
ii. Salinity adaptation during the migration from freshwater to seawater.
Groups (n = 6) of freshwater-acclimated yellow or silver eels were transferred to seawater for between 6 hours and 5 months and
complementary control groups were transferred to freshwater. Brain, kidney, intestine and gill cDNA libraries were constructed using suppression
subtractive hybridisation (SSH) techniques and a novel protocol based on Invitrogen's Gateway cloning system. The latter technique produced a low redundancy (~4 %) EST bank with a wide range of insert sizes (0.5 – 10 kb). Two microarray types were produced; one comprised 5760 clones from the two brain libraries whilst the other was a multi-tissue microarray incorporating 6144 clones from the SSH libraries. Pooled RNA samples were probed against the microarrays to highlight differentially expressed genes. Real-time quantitative PCR (QPCR) was used to validate the observed expression changes of selected genes in the tissues of individual fish. Following yellow to silver transformation of freshwater-adapted eels, the expression of tyrosine 3-mono-oxygenase/tryptophan 5-mono-oxygenase activation protein (14-3-3) and vaccinia related kinase 3 was shown to be consistently elevated.
1.1 Table of abbreviations
14-3-3 Tyrosine 3-mono-oxygenase/tryptophan 5-mono-oxygenase activation protein BCP 1bromo-2chloropropane
2G Second generation
AANAT Arylalkylamine N-acetyltransferase AQP Aquaporin
Blast Basic local alignment search tool Camp Cyclic adenosine monophosphate CDNA Complimentary deoxyribo nucleic acid
CFTR Cystic fibrosis transmembrane conductance regulator CmR Chloramphenicol resistance
CSA Carbon spacer arm Ct Treshold cycle CV Column volumes
DART-PCR Data analysis for real time PCR DCTP Deoxycytidine triphosphate DEPC Diethylpyrocarbonate DNA Deoxyribonucleic acid
DNTP Deoxyribonucleotide triphosphate DTT Dithiothreitol
DUTP Deoxyuridine triphosphate
E Efficiency
EAE Epithelial anion echanger EDTA Ethylenediaminetetraacetic acid EEO Electroendosmosistype
ERK Extracellular signal regulated kinase EST Expressed sequence tag
FW Fresh water
GAPDH Glyceraldehyde-3-phosphate dehydrogenase HPLC High pressure liquid chromatography
HSP Heat shock protein IHF Host integration factor IQD Interquartale distance KanR Kanamycin resistance gene LB Luria broth
MIAME Minimum information about a microarray experiments MOPS 3-(N-Morpholino)-propanesulfonic acid
MRNA Messenger RNA MW Molecular weight
NABs NeutrAvidin™ biotin-binding protein agarose beads NEB New England biolabs
NERC Natural environment research council NHE Sodium/hydrogen exchanger NKCC Na+,K+,2Cl- cotransporter
P Phosphate group
PCR Polymerase chain reaction PKC Protein kinase C
PMCA Plasmamembrane Ca2+-ATPase
PMT Photomultiplier tube
QPCR Real time quantitative polymerase chain reaction REST Relative Expression Software Tool
RNA RiboNucleic acid
RPL-P0 Acidic ribosomal phosphoprotein P0 Rpm Revolutions per minute
RRNA Ribosomal RiboNucleic acid RT Reverse transcriptase
SA-PMPs Streptavidin Magnesphere® Paramagnetic Particles SDS Sodium dodecyl sulfate
SERCA Sarco/endoplasmic reticulum Ca2+ ATPase SMART Switching mechanism at the 5’ end of RNA SSH Suppressive subtraction hybridisation SSH Suppression subtractive hybridisation SW Salt water
TAE Tris-Acetate-EDTA TIFF Tag image file format Tm Annealing temperature UV Ultra Violet
2.0 Introduction
‘‘Eels are derived from the so-called 'earth's guts' that grow
spontaneously in mud and in humid ground; in fact, eels have at times been seen to emerge out of such earthworms, and on other occasions have been rendered visible when the earthworms were laid open by either scraping or cutting” (Aristotle, 350 B.C.). The reproductive habits of the eel have
perplexed researchers since ancient times and still to this day eel spawning in the wild has yet to be observed.
The European eel (Anguilla anguilla) is a euryhaline, facultative
catadromous teleost (Tsukamoto and Arai, 2001; Tsukamoto, 1998), which spends the majority of its adult life in fresh or brackish water (Tzeng, 2000). It returns to the sea in order to spawn (Moriarty, 1978) and once hatched, the eel larvae drift back to European coastal waters whereupon the young eels migrate into river systems and develop into adults. This life-cycle
necessitates the ability to adapt physiologically to fresh, brackish and marine environments at distinct life stages. As an osmoregulator, A. anguilla
maintains a relatively stable blood plasma osmolality whether in brackish water, freshwater or seawater. Each aquatic habitat poses a different
osmoregulatory challenge to the eel due to the markedly different salinities of the water; subsequently, different strategies have evolved to maintain osmotic homeostasis. The transitions between environments of different salinities are associated with the developmental and morphological stages of the eel. The elopomorphs, which encompass A. anguilla, are some of the most ancient
teleosts, having diverged ~350 million years ago (Lauder and Liem, 1983). As such, they may exhibit conserved characteristics which are less evolutionarily derived than other teleosts (Weltzien et al., 2006). The eel therefore provides an excellent study organism to examine both development and
century (Stone, 2003). The decline in eel numbers has been estimated at 99% since 1980 (Dekker, 2003) and in 2005 the Swedish Species Information Centre was the first organisation to classify the eel as critically endangered.
Eels are also of worldwide economic interest, with the global market approaching an estimated £1.5 billion (Heinsbroek, 1991). Global aquaculture production of eels increased exponentially in the latter half of the 20th century but now appears to have reached a plateau (Figure 2.0.a). Due to the
complexity of the eel life-cycle, captive breeding of the eel has remained elusive. Fertilised eggs from the Japanese eel, A. japonica, were obtained following hormone treatments as far back as 1974 (Yamamoto and Yamauchi, 1974) but similar experiments with A. anguilla have had limited success (Palstra et al., 2005). In 2005, the one remaining segment of the Japanese eel life-cycle in captivity was achieved; development of glass eels from larvae (Kagawa et al., 2005), however, this has still to be replicated in the European eel. Eel aquaculture, without a viable alternative, has therefore always relied solely on wild caught, post-larval eels as seed stock. Since 1950, however, eel capture rates have plummeted which is reflected in the worldwide crash in eel populations (Figure 2.0.b), leading to unsustainable aquaculture practices (EU-Communication:IP/03/1332, 2005). The exact reasons for the population decline are not understood but it has been associated with over fishing
Q ua nt ity ( to ns x 1 00 0)
Year 1980 1990 2000
[image:13.612.113.536.72.312.2]19 70 19 60 19 50
[image:13.612.122.525.431.673.2]2.1 The eel life-cycle
From egg to elver: Spawning of A. anguilla is believed to occur
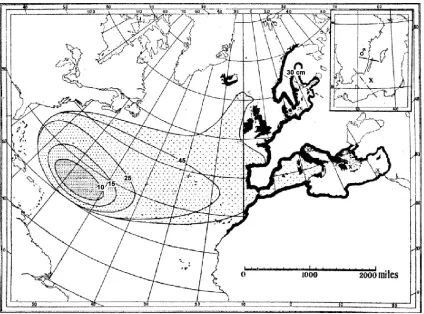
[image:14.612.112.536.329.643.2]between November and July (Wang and Tzeng, 2000) in the Sargasso Sea, which is a floating lens of warm water in the south east Atlantic (Schmidt, 1922). The location of European eel spawning has never been observed first hand but it is implied from the results of a study carried out by Johannes Schmidt using tow nets to study the spatial distribution of eels of varying sizes in the Atlantic (Schmidt, 1922). He showed that there is an increase in eel length which directly correlates to increasing distance from the Sargasso Sea (Figure 2.1.a).
Upon reaching the continental shelf the leptocephali undergo a metamorphosis into glass eels. During this development the eels become more cylindrical in shape and both buoyancy and drifting ability diminish. Subsequently they swim proactively to estuaries where they become pigmented elvers. This journey from the continental shelf to the estuaries takes an average of 98 days (Wang and Tzeng, 2000). The majority of elvers migrate up into river systems where they become fresh water-adapted yellow eels (Moriarty, 1978). Some eels, however, remain in marine environments for the entirety of their life-cycle or move down rivers as immature adult yellow eels to inhabit the brackish waters of estuaries (Tsukamoto and Arai, 2001).
Yellow eels are sexually immature and may reside in rivers for up to 50 years (Poole and Reynolds, 1998) with the average age at maturity being 12-20 years in northern Europe but only 6-8 in southern Europe and North Africa (Tesch and Greenwood, 1977). Some eels remain in marine or brackish water around estuaries throughout their lives, as shown by Tsukamoto (2001). He examined the strontium:calcium ratio in the layers of otoliths (the calcium carbonate deposits found in the inner ear of all fish, which can be used to show temporal use of freshwater or seawater habitats) and concluded that some eels never enter freshwater.
The development from yellow to the final silver life stage (silvering) occurs prior to migration but the cue for its onset is not well characterised. It is not directly linked to age or size (Svedäng 1996; Vøllestad, 1992) but it has been postulated to be associated with the accumulation of mesenteric fat (Larsson, 1990). This corresponds with the link shown between mesenteric fat levels and hormone regulation during the sexual maturation of Atlantic salmon (Rowe, 1991). Energy reserves are required for the return migration (~6000 km) to the Sargasso Sea, as it is reported that eels do not eat during their trans-oceanic crossing (Tucker, 1959).
Traditionally, eels undergoing sexually development have been
silvering process is currently being redefined by various authors although agreed nomenclature is still to agreed.
During silvering the eel pre-acclimates physiologically to seawater in preparation for the migration to the spawning grounds of the Sargasso Sea (Cutler and Cramb, 2001; Kirsch et al., 1975; Tesch and Greenwood, 1977). As eels reach maturity the undersides of the skin turn silver or bronze due to differentiation of pigment cells (Pankhurst, 1982). There is some proliferation of the gonads (Pankhurst, 1982), their eyes become bigger and the head takes on a more hydrodynamic form. A very recent study, profiling the level of circulating developmental hormones of silvering eels, has indicated that this process is associated with hormonal surges of testosterone and estradiol, whilst growth hormone and thyroid hormone do not appear to change between the two stages (van Ginneken, 2006).
It is postulated that in the late summer and autumn following silvering there is an environmental trigger which induces the migration back to the spawning grounds (Vøllestad et al., 1986). This process is not fully understood but has been attributed to many environmental cues in eel
species including temperature (Boubée et al., 2000), atmospheric depressions (Okamura, 2002), lunar phase and river water levels (Cullen and McCarthy, 2003). Most likely there is a combination of factors involved which trigger downstream migration. The timing of migration appears to be sex dependent, with males departing up to two months prior to females (Tesch, 2003). This segregation between the sexes is thought to be based on body size, which is directly proportional to swim speed (Usui, 1991). Males start to mature at ~40 cm whilst the females grow to >60 cm before silvering (Svedäng 1996). Based on the average open ocean swim speed of 0.48 body lengths/s for migrating Anguilla japonica (Aoyama et al., 1999), a male eel 50 cm long
be reasonably accurate, providing the eels take a direct route. The temporal coincidence of male and female sexually mature eels at the Sargasso Sea is implicit from the sex-dependent timing of migration and the difference in swimming speeds. Interestingly, the very action of performing this migration, and the change in body composition it causes, has been suggested as the trigger for the final sexual development of the eel (van Ginneken, 2006).
There has never been a study of the naturally occurring endogenous hormonal changes during the final sexual maturation because captive silver eels do not finally mature and there are only two published reports of
migrating silver eels being caught at sea (Bast and Klinkhardt, 1988; Ernst, 1977). In teleosts, sexual development is under the control of the brain-hypophyseal-gonadal endocrine axis (Yaron and Sivan, 2006). Induced “natural” maturation by the administration of sexual steroids has been shown to promote luteinising hormone (LH) synthesis in the pituitary but this was not associated with a subsequent systemic release of LH and thus sexual
maturation did not occur (Dufour et al., 1983). Treatment of silver eels with exogenous gonadotrophin has, however, been used to induce gonadal development (Fontaine, 1936) which indicates that there is inhibition of gonadotropin release or actions in captive silver eels. It has recently been suggested that dopamine prevents final sexual maturation of the eel by
inhibiting release of LH (Vidal et al., 2004). This model involves a decrease in dopamine inhibition of gonadotrophin releasing hormone expression, which in turn stimulates LH synthesis and secretion to bring about ovarian
2.2 Introduction to osmoregulation
In freshwater, the epithelia of the eel are constantly challenged by the osmotic gradient created between the external medium (high osmotic
potential/ low osmolality) and the internal plasma (low osmotic potential/ high osmolality). The physiological challenge is reversed in seawater as the external salinity induces water loss across epithelial surfaces as well as ion gain. To combat oedematous or dehydrating conditions, and maintain osmotic homeostasis, eels possess an arsenal of ion and water transport pathways. These are used in concert across the three main osmoregulatory tissues; kidney, intestine and gill, with the latter being responsible for the majority of ion movements to balance diffusional gains or losses (Evans, 1999; Petr, 1968).
The salt and water transporting systems are highly labile and rapidly upregulate or downregulate when the animal changes environmental salinity. In addition to regulation of expression, the distribution of ion transporters in key regulatory tissues can also be salinity dependent. The cystic fibrosis transmembrane conductance regulator, for example, will redistribute from the apical surface to the basolateral surface of epithelial tissues in the gill, kidney and gut when the eel adapts to freshwater from seawater (Marshall and Singer, 2002).
In freshwater, volaemic homoestasis is achieved principally by the excretion of large volumes of urine (Gaitskell and Jones, 1971). Even though the urine is very dilute, salts are lost in this process and the eel must actively absorb ions via branchial epithelial mitochondria-rich cells in the gill (Ando, 1981; Baldisserotto and Mimura, 1994) which supplements those obtained from ingested food and water. In the marine environment, the eel maintains a relatively stable blood plasma osmolality level by increasing drinking,
2.3 Osmoregulatory adaptations: Gill
The primary role of the gills in fish is one of gas exchange, for which there is a large epithelial surface area arranged over a complex series of branchial arches subdivided into multiple filaments which are then partitioned further into lamellae. With such a large surface area specifically adapted for rapid diffusion of gases, the gills are susceptible to water uptake and ion loss in freshwater whilst the converse is true in seawater. The eel gill physiology adapts physiologically, however, in order to absorb or secrete ions in
freshwater and saltwater respectively. Differences in both osmotic membrane permeability and blood perfusion of the gill epithelia are also exhibited
between the two environmental salinities.
The epithelia of the gill are made of three main cell types; pavement cells, which make up approximately 90% of the gill surface area;
mitochondria-rich cells (also know as chloride cells) and accessory cells. The pavement cells are joined to each other and to mitochondria-rich cells by deep-tight junctions consisting of several multi-strand protein connections (e.g. claudins, occludins and junctional adhesion molecules), whilst links with accessory cells consist of fewer strands and are therefore deemed thin-tight junctions (Karnarky, 1992). The mitochondria-rich cells mediate the net loss or gain of ions via a suite of membrane ion transport mechanisms (Evans et al., 1999) but pavement cells have also been indicated to play a role in Cl- uptake (Wood et al., 1998).
Trans-epithelial ion transport, cell volume and integrity are maintained by the chloride-cation-cotransporter family which is important during salinity adaptation (Cutler and Cramb, 2002b; Haas and Forbush III, 2000). This family includes NKCC1 which is found primarily on the basolateral
Freshwater adapted gill: During freshwater acclimation of the eel there is a net influx of chloride ions from the external medium across the gill epithelium. The dilute nature of freshwater and the inherent electrochemical gradients necessitate an active transport mechanism to facilitate Na+ and Cl -uptake. The basolateral membrane of the gill mitochondria-rich cell has extensive infoldings which produce a high surface area and extensive tubular system. Associated with this membrane are high numbers of mitochondria and the transport enzyme Na+/K+-ATPase (Karnaky et al., 1976), which uses ATP to drive 3Na+ from the mitochondria-rich cell into the extracellular
compartment in exchange for 2K+. This process in addition to the action of K+ channels sets up an electrochemical gradient from the extracellular fluid to the cytosol of the mitochondria-rich cell. When acclimated to seawater, Na+ coupled to K+ and Cl- travel down the electrochemical gradient into the cell via a common basolateral transport protein, the NKCC1 isoform of the Na+/K+/Cl -cotransporter family (Degnan, 1985; Evans et al., 1999). Chloride ions then cross the apical membrane via anion channels such as the cystic fibrosis transmembrane conductance regulator (CFTR), whilst Na+ exits via
paracellular pathways through the thin-tight junctions between chloride and accessory cells.
Chloride uptake in freshwater acclimated yellow eels is thought to occur via Cl-/HCO3- exchange, which also plays a role in acid-base regulation (Cutler and Cramb, 2001). This view is supported by the circumstantial
evidence that acetazolamide and thiocyanate, Cl-/HCO3- exchange inhibitors (Nguyen et al., 2004), cause a lowering of the Cl- concentration in cultured
Salmo trutta mitochondria-rich cells, as measured by X-ray microanalysis of
frozen tissues (Morgan, 1994). The Cl-/HCO3- exchanger has been localised to mitochondria-rich cells in gill epithelia of teleosts by localisation of the mRNA in the rainbow trout (Oncorhynchus mykiss) (Sullivan, 1996) and of the
protein in freshwater tilapia (Oreochromis mossambicus) and mudskipper
chloride uptake at the apical surface and associated passive Na+ transport (Wood et al., 1998). In separate experiments, however, acetazolamide and thiocyanate had no effect on intracellular Cl- concentrations of brown trout
(Salmo trutta) pavement cells (Morgan and Potts, 1995; Morgan, 1994).
Greg Goss and co workers illustrated that, in freshwater, the gill
epithelium of rainbow trout (at least) exhibit two functioning sub-populations of mitochondria-rich cells (Goss, 2001). The morphologically identical
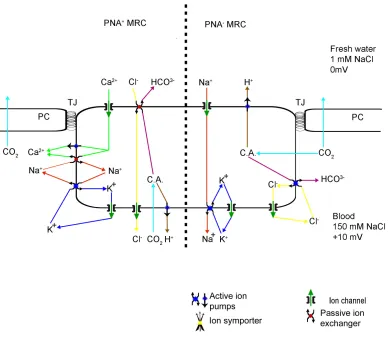
Figure 2.3.a. Freshwater adapted gill epithelial model. The
morphologically identical mitochondria-rich cell subgroups, identified by their ability to bind peanut lectin, have distinct functions. PNA -mitochondria-rich cells have a chloride uptake/base secretion function which is driven by apical H+-ATPase activity. PNA+ mitochondria-rich cells, however, have a sodium uptake/ acid secretion function driven by a basolateral proton pump. PNA: peanut agglutinin, MRC: mitochondria rich cell, TJ: tight junction, PC: pavement cell, C.A.: carbonic anhydrase.
Seawater adapted gill: The gill is the major site for salt secretion in the seawater-adapted eel. A typical mitochondria rich cell in seawater has an apical crypt and a basolateral tubular system. The tubular system is made of invaginations into the cell, toward the apical surface, which effectively brings the two membranes to within 2-5 µm of each other. This allows the
membrane to function, essentially, as a thin NaCl pump. Salt secretion is driven by Na+,K+-ATPase which keeps intracellular Na+ levels low (figure 2.3.b). This enzyme was localised to the basolateral membrane using the specific binding of tritiated ouabain (Karnaky et al., 1976), and more recently, TEM and immunogold studies have also shown it to be located specifically in the tubular system (Dang, 2004). Chloride ions can then enter across the basolateral membrane (via the Na+,K+,2Clco-transporter) and they leave through apical CFTR type anion channels. This creates a membrane
Figure 2.3.b. Ion transport across the seawater adapted gill epithelium. The basolateral membrane of the MRC is potentiated by Na+,K+-ATPase which drives Cl- entry by Na+,K+,2Cl--ion symporter. Cl- crosses the apical membrane through CFTR-like ion channels and Na+ follows
2.4 Osmoregulatory adaptations: Renal system
The kidney of the eel is fully glomerular but it lacks the loop of Henlé found in mammals (Cleveland and Trump, 1969; Hentschel and Elger, 1989). The apical surface of the renal tubules is lined by an apical brush border which affords a large surface area for ion transport and fluid
secretion/absorption depending on the salinity of the external habitat (Martinez et al., 2005).
Freshwater adapted renal system: In freshwater adapted eels, the glomerular filtration rate is high and nearly all filtered solutes are reabsorbed across the epithelia of the renal tubules; furthermore, ions are also reclaimed across the epithelia of the urinary bladder (Cutler and Cramb, 2000). In vertebrates the vast majority of these resorptive processes occur in the distal tubule but in teleosts (bar the lampreys) they occur in the proximal tubule (Dantzler, 2003). In the early distal tubule (figure 2.4.a) salt uptake is driven by basolateral Na+,K+-ATPase and facilitated by the apically located sodium, potassium, chloride co-transporter (NKCC2 isoform) (Dantzler, 2003). The latter mechanism is dependent on K+ cycling through apical potassium channels and allows cellular Cl- to accumulate and then exit passively down the concentration gradient via basolateral chloride channels and K+:Cl
-cotransporters (Braun and Dantzler, 1997). Na+:H+ exchange and paracelluar routes may also contribute significantly to Na+ transport. The transport
Figure 2.4.a. Ion transport mechanisms in the water impermeable epithelium of the early distal tubule of the freshwater eel. Basolateral Na+,K+-ATPase drives the process of salt reabsorption by creating gradients to allow apical import of Na+, K+ and Cl-. K+ is recycled
apically through K+ channels whilst Cl- exits basolaterally through K+:Cl -cotansporters. Na+ also crosses the membrane via paracellular routes and Na+:H+ exchange.
1998). The urine of seawater adapted eels has a tonicity similar to the extracellular fluid but with Mg2+, SO42- and Cl- replacing Na+ and Cl- as the major electrolytes. Tubular secretion, which may exceed glomerular filtration by as much as four fold, occurs in the early proximal tubule (Beyenbach, 2004). Here, Cl- is secreted by a secondary active process driven by
basolateral Na+,K+ ATPase. Chloride ions enters basally through the NKCC1 Na+/K+/2Cl- cotransporter before exiting apically through CFTR-like anion channels (Figure 2.4.b). There is net secretion of Mg2+, SO42-, Na+ and Cl- in the early proximal tubule with the latter two ion types being largely reabsorbed in the late proximal tubule. Here, again, the driving force is basolateral Na+, K+ ATPase which creates a diffusion gradient allowing apical Na+-glucose and Na+-amino acid coupled transport.
Even before reaching seawater, freshwater adapted silver eels migrating downstream are thought to prepare physiologically for the impending change in salinity. The expression levels of the 1a isoform of Na+/K+/2Cl- cotransporter (NKCC1a) in the kidney increases during the silvering process but remains constant during seawater-acclimation of silver eels (Cutler and Cramb, 2002b). This suggests a pre-acclimation to
Figure 2.4.b. Ion transport mechanisms in the early proximal tubule of the seawater adapted eel kidney. There is net secretion of Mg2+ (via H+ and Na+ exchange), SO42- (dependent on C.A.), Cl- (driven by basolateral Na+,K+-ATPase) and Na+ (by electrically coupled paracellular pathways). K+ enters the cell basally via Na+,K+-ATPase and Na+/K+/2Cl
2.5 Osmoregulatory adaptations: Intestine
The freshwater adapted eel drinks little, other than what is imbibed during feeding (Martinez et al., 2005). The ingested food provides the eel with a valuable source of salts, but otherwise the role of the intestine in freshwater osmoregulation is limited. Following seawater adaptation, however, drinking rates of the eel are markedly increased (> 10 fold) and the intestine takes on a key osmoregulatory role (Gaitskell and Jones, 1971). Ingested seawater is desalinated as it passes through the gut, largely by active transport of monovalent ions across the epithelia which starts in the oesophagus and continues throughout the intestine and rectum. The subsequent reduction in salinity of the luminal fluid allows water to be absorbed by passive osmosis (Skadhauge, 1969); a process facilitated by the large surface area of the brush border membranes of the luminal epithelial cells. The mechanism of Na+ absorption from luminal fluids is powered by basolateral Na+,K+-ATPase which creates a diffusion gradient to drive apical Na+ influx via Na+/Cl- and Na+/K+/Cl- co-transporters (Loretz, 1995). Cl- uptake also occurs via bicarbonate transporters which secrete HCO3- in exchange for Cl- (Ando, 1990). Thus far, cDNAs representing three chloride-bicarbonate exchanger isoforms have been found in the eel intestine (Cutler and Cramb, 2001). The bicarbonate is then rendered electrochemically inert by precipitation. A schematic summary of ion transport across this membrane is shown in figure 2.5.a. Upon initial examination this process could not drive water uptake but if the bicarbonate was derived from the osmotically inert cellular CO2 then there would be a net influx of ions into the epithelial cells, thus aiding water uptake (Wilson et al., 2002).
three bicarbonate ions from the extracellular fluid into the epithelial cell is electrogenic (Romero and Boron, 1999). This would hyperpolarize the cell membrane potential, thereby providing a driving force for basolateral Cl- efflux via chloride channels (Cutler and Cramb, 2001).
2.6 Introduction to brain function in osmoregulation and development.
Co-ordination of responses involves the reception of stimuli and subsequent reaction. Exogenous signals include day length, lunar phases, tides, water levels in rivers as well as external salinity. Endogenous signals include levels of energy stores (adiposity) and plasma osmolality and pH. Responses are mediated by the neuroendocrine and endocrine signalling pathways which invoke the appropriate responses from specific cells and tissues.
In the case of salinity adaptation there are various local and circulatory signalling systems and agents which modulate the expression and function of ion and water transporters in eel tissues (Evans, 2002).
When teleosts are faced with an osmoregulatory challenge there are two hormonal response types; the first is fast and short-acting whilst the second is slow and long-acting. The first type offer an immediate response to the osmoregulatory stress but are often cleared from the system within
minutes (Takei and Hirose, 2002). They include oligopeptide hormones such as angiotensin II, arginine vasotocin, natriuretic peptides and urotensins which target specific epithelia where they modulate existing ion channels or
transporters by phosphorylation or dephosphorylation of key residues. The long-acting response hormones show gradual increases to elevated levels for prolonged periods of several hours or longer. This group incorporates
cortisol, growth hormone (GH), insulin-like growth factors (IGFs) and prolactin (PRL) and stimulate the synthesis of ion channels and transporters and induce structural reorganisation so that the animal can cope, long term, with its new environmental salinity.
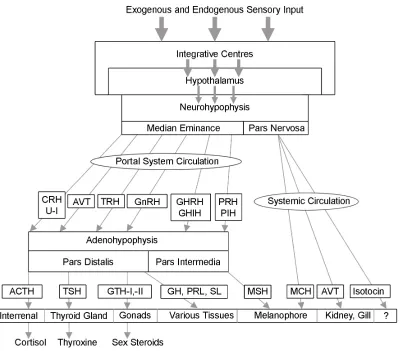
adenylate cyclase activating polypeptide, corticotropin-releasing hormone, somatolactin release-inhibiting hormones and thyrotropin releasing hormone. The tiered organisation of these systems is shown in context with their secretion sites, pathway induction and site of action (Figure 2.6.a).
One of the principal sites of hormone secretion is the pituitary gland, which is subdivided into two functionally and anatomically distinct sections: the anterior pituitary and the posterior pituitary (neurohypophysis) (Figure 2.6.b.). The anterior pituitary (adenohypophysis) originates from the
nasopharangeal epithelium and is subdivided into the rostral pars distalis and proximal pars distalis. It is responsible for the secretion of gonadotropin-I and –II (orthologous to follicle stimulating hormone and luteinising hormone
respectively), thyroid stimulation hormone, growth hormone, prolactin, adrenocorticotropic hormone and somatolactin. The posterior pituitary is derived from neural tissue and comprises the pars intermedia and pars nervosa and secretes the neuroendocrine hormones; melanin concentrating hormone, arginine vasotocin and isotocin.
responsible for urotensin-I and –II secretion, reviewed in Kobayashi et al (1986). Additionally, atrial natriuretic peptide, a seawater adapting hormone (Takei and Balment, 1993), is secreted by the heart whose release is
stimulated by increases in plasma osmolality in teleosts (Kaiya and Takei, 1996) and by cardiac stretch in mammals (Farrell, 1999). Upon exposure to seawater the blood volume in the eel decreases (Kaiya, 1996b), which would normally inhibit ANP secretion in mammals. In teleosts, however, the
increase in plasma osmolality has an overriding effect and ANP secretion increases. This in turn causes a dose dependent decrease in angiotensin II levels which inhibits both drinking (Tsuchida, 1998) and Na+/Cl- absorption by the intestine (Loretz, 1997). This appears, at first, to be counter intuitive as the eel in seawater must drink copiously to ensure adequate water uptake. Indeed, upon initial transfer to seawater the eel elevates its drinking rate substantially, a response which is initiated by external chloride receptors as it occurs prior to increases in plasma osmolality (Takei et al., 1998). Drinking rapidly abates, however, as the influence the plasma osmolality-stimulated increase in ANP secretion overrides these mechanisms. Increased ANP secretion and the associated anti-dipsogenic effects are transient, however, decreasing after 1-2 hours post seawater transfer (Kaiya and Takei, 1996b), at which point drinking rates become elevated once again. Therefore this system allows the eel a period of respite, during which, alimentary ion transport systems can adapt to seawater.
Following the work by Utida et al the traditional view was that, amongst teleosts, cortisol was the seawater adapting hormone and prolactin was the
freshwater hormone (Utida et al., 1972). In the freshwater adapted killifish for example, Fundulus heteroclitus, plasma cortisol levels peak 1 hour post
transfer to seawater, which coincides with the highest plasma Na+ level (Marshall, 1999). More recent studies have now shown that cortisol may actually have a dual role as it is also implicated in ion uptake, whilst seawater acclimation also involves the growth hormone (GH)/ insulin like growth factor I (IGF-I) axis (McCormick, 2001). Salmonids treated long term with GH
larger fish will have an inherently greater salinity tolerance, the same effect has been noted just 48 hours following growth hormone injection, before any size effects could be implicated (Bolton et al., 1987). Several salinity related physiological changes induced by GH and IGF-I have been noted. Prunet et al (1994) found GH treated Atlantic salmon exhibited increased numbers of secretory mitochondria rich and accessory cells in the gill. In vivo Na+,K+
-ATPase expression and activity are also raised in the gill mitochondria rich cells (Mancera and McCormick, 1998; Sakamoto et al., 1997), as is the Na+ -K+-2Cl- cotransporter (Pelis and McCormick, 2001). Examining the system from the other side, elevated levels of GH and IGF-I have been shown in salmonids following salinity challenge (Sakamoto et al., 1993). Pertinent to the current study, however, is the lack of evidence which relates GH and IGF-I to osmoregulation within the anguillid eels. In cultured pituitary cells, an osmotic challenge had no effect on GH secretion levels (Suzuki et al., 1991; Suzuki et al., 1990). Additionally, eels have also been shown to survive in seawater without a pituitary, and therefore without growth hormone (Takei and Hirose, 2002).
In addition endocrine and neuroendocrine systems discussed, there must be also be pathway for sensing and coordinating environmental cues with endogenous factors to bring about eel silvering at a time to maximise reproductive success. Furthermore the eel must be able to react to additional environmental signals which dictate the timing of migration in a way that synchronises their arrival at the spawning grounds. One such mechanism for co-ordinating these responses in the eel could involve leptin (Zhang et al., 1994), which has been characterised as a signal peptide relating somatic energetic status to the reproductive system. Early leptin research focussed on the function of this adipocyte secreted peptide in relation to appetite
signal peptide (Chehab et al., 1996). The first reported mechanism of interaction with reproductive pathways in mice was shown by direct injection of leptin which induced an increase in levels of circulating LH (Barash et al., 1996). Likewise, leptin has since been shown to influence follicle stimulating hormone in a similar way (Yu et al., 1997).
Leptin has recently been cloned in a number of teleost fish (Huising et al., 2006; Kurokawa et al., 2005) but the process of understanding its role is in its infancy. Some of the functions of teleost leptin appear to be conserved with other chordates, but the mechanisms involved remain unclear. In mammalian systems leptin appears to be antagonistic to neuropeptide Y, but this relationship is not immediately discernable in teleosts. Ammar et al
(2000) showed that leptin is an appetite suppressant and stimulant of reproductive behaviour whilst neuropeptide Y stimulates eating and suppresses reproductive behaviour. The opposing roles of these two peptides is further highlighted by the direct inhibitory action of leptin upon neuropeptide Y synthesis in the hypothalamic arcuate nuclei (Baskin et al., 1999). As mentioned previously, leptin has been shown to cause an increase in LH secretion in mice but in teleosts, neuropeptide Y has also been shown to stimulate LH release. Two parallel studies, one on goldfish (Kah et al., 1989) and the other on rainbow trout (Bernard et al., 1989) both showed that porcine neuropeptide Y treatment of in vitro pituitary cell cultures induced a
dose dependent increase in LH release. These findings are in agreement with a more recent in vivo study of seabass (Dicentrarchus labrax), which also
showed that neuropeptide Y causes an increase in LH secretion (Cerda-Reverter et al., 1999). The effects of neuropeptide Y in this case, however, were dependent on nutritional state; stimulation of LH secretion was only seen in chronically fasted animals whilst the effects were suppressed in fed
animals. One of the first leptin studies in teleosts treated cultured pituitary cells from carp (Cyprinus carpio) with purified mouse leptin and demonstrated
2.7 Introduction to Microarray Technology
There are many experimental approaches available which can be used to investigate biological systems. A hypothesis can be derived from known data of a model species and similar techniques can be reused to examine an unrelated organism. This approach has the advantage that tried and tested experimental techniques can be easily transferred to the system in question. It is, however, limited in the answers that it can provide and is unlikely to elucidate new and unexplored avenues of research. A different approach is to use screening tools which allow a wide range of potential targets to be studied simultaneously.
“Microarray Technology” describes a set of screening tools used to study the research fields which fall under the broad term “Genomics”. These fields of research examine, in almost their entirety, a form of the genetic material or its derivatives of an organism. This ever broadening field now encompasses; genomics (study of all/most DNA), transcriptomics (study of all/most transcribed genes i.e. mRNA), proteomics (study of all/most proteins), metabolomics (study of metabolically relevant proteins), epigenomics
(integrates disease modelling and genomics) and ecotoxicogenomics (integrates genomics and environmental toxicology). The present study will use transcriptomics by isolating and examining the mRNA. This has the advantage that mRNA lacks introns, promoters and non-transcribed DNA and a particular tissue will only express a subset of genes.
are coordinated in a complicated and highly interlinked manner (Phimister, 1999). By clustering groups of seemingly co-regulated genes/proteins, previously unknown pathways can be highlighted and new lines of enquiry can be followed. Compared with traditional molecular biology experiments which examine genes or proteins in isolation, the use of microarray screening methods expedites the process of identifying possible relationships and finding novel genes.
The first published article to specifically use “microarrays” was Shena et al (1989) but the way in which a DNA microarray works has stemmed from the principles developed in Southern blotting techniques (Southern, 1975). These techniques use labelled nucleic acid molecules to interrogate nucleic acids attached to a solid medium via adenine-thymine and guanine-cytosine base hybridisation (Watson and Crick, 1953).
A cDNA microarray has the form of a regular microscope slide. The glass is of a higher quality, with fewer imperfections and a more uniform surface topology. The glass is coated so that the surface will bind cDNA strongly. Often a positively charged substance (e.g. poly-aminosilane) is used, which forms many interactions with the negatively charged cDNA to hold it in place. Amplicons are spotted onto the slide, traditionally using a pin spotter, so that each individual spot (~150 nm in diameter) comprises cDNA corresponding to a single gene transcript. This process is repeated so that up to ~ 20,000 features can be printed on a single slide to make the final microarray.
which genes are being up-/down-regulated. To imply a functional endpoint for a level of transcription for a particular gene requires the assumption that transcript copy number directly influences protein activity. This assumption ignores several biological processes (e.g. protein folding and
post-translational modifications) which occur after transcription and before resultant performs its role. Despite this caveat the revealed data can be enlightening, to say the least.
Microarray techniques and genomic studies have traditionally been associated with model organism such as H. Sapiens, D. melanogaster,
C.elegans, M.musculus, A. thaliana etc, but increasingly, non-model
organisms are being investigated in this way (Cossins and Crawford, 2005). The European eel is one such non-model organism but as a fish it stands well placed to be of significant importance. Whilst most developmental and
biological systems are common to all vertebrates, fish are by far the most specious, numbering over 28,000 extant species, which far outnumbers the mammals (~4600) or birds (~10,000) (Wilson and Reeder, 1993). Fish have managed to inhabit almost every piscine environment on the planet;
hypersaline lakes, anoxic waters, highly pressured waters (<1000 Atm), the Arctic where ice fish rely on “anti-freeze” proteins to survive sub-zero
temperatures and thermal springs where the temperatures can exceed 45 ºC. It has been suggested that the sheer diversity of fishes and their ability to adapt to niche habitats will, in conjunction with genomic studies, reveal some of natures most intriguing secrets (Oleksiak and Crawford, 2006). In addition, fish are unique in that their habitat is a medium in which they are immersed and effectively their environment is in direct contact with all bodily fluid
compartments and tissues via the gills and gastrointestinal system (Randall et al., 2002). This has specific implications in the present study, as changes in environmental salinity will allow us to elucidate some of the important
pathways involved in teleost osmoregulation.
There are already many fish genomic studies, the most advanced being the model oragnaisms zebrafish (Danio rerio), medaka (Oryzias latipes)
well-characterised developmental model species due in part to the
transparent eggs and short reproduction cycle and has recently become the species of choice for gene knockdown studies for some of Sir David Lane’s research groups. The pufferfish have some of the smallest known genomes and are thus a very attractive species for genomic studies. Non-model fish species are also increasingly under the genomic gaze. They include the the flounder (Platichthys flesus), killifish (Fundulus heteroclitus), rainbow trout
(Oncorhynchus mykiss), several salmon species and the subject of the first
genomic study of a non-model fish species which examined the hypoxic abilities of the goby (Gillichthys mirabilis, Gracey et al., 2001). Whilst model
2.8 Hypothesis and aims.
The hypothesis to be investigated;
The brain is the central organ for the co-ordination of environmental cues (photoperiod, lunar cycle, temperature and environmental salinity) with the anatomical and physiological adaptations which accompany
pre-migrational morphogenesis and the osmoregulatory plasticity seen in post-migrational, salinity-adapted fish.
The aims of the project;
Develop cDNA libraries for the brain, kidney, intestine and gill taken from eels adapted to both fresh and marine environments. Use these cDNA libraries to create microarrays.
Determine gene expression profiles for yellow and silver eels adapted to freshwater and seawater.
Determine the cDNA sequence of potential genes of interest. Validate the gene expression profiles using complementary
3.0 Materials and methods
The materials and methods chapter is presented in 27 sections.
Sections 3.1-3.4 detail the collection of eel tissues, RNA extraction and the preparation of messenger RNA.
Section 3.5 covers some commonly used techniques as well as buffer and oligonucleotide details.
Sections 3.6 – 3.23 detail the techniques used to create the cDNA libraries created during the project, the discursive timeline for this can be found in Results Sections 4.3 – 4.13.
3.1 Animal treatment and tissue collection
Adult, sexually immature yellow and migrating, sexually maturing silver eels were captured in fresh water in the rivers and tributaries of the River Tay catchment area by a local supplier in Blairgowrie, Scotland. The occurrence of eels at the silver developmental stage is season dependent (Han et al. 2003) and as such the silver eels were caught in the autumn/winter during their downstream migration whilst yellow eels were caught all year round. Yellow eels were distinguished from silver eels on the basis of skin colour and head morphology and the independence between animal size and sexual maturation (Svedäng 1996; Vøllestad, 1992) was exhibited by a large weight range in both eel types (yellow=252
-540 g, silver=237-570 g). Eels were assumed to be all females as male eels tend to stop growing at ~150 g (Degani et al., 2003). Eels were kept in holding tanks (40 eels per 700 L tank) in the Gatty Marine Laboratory (St Andrews, Scotland) maintained on a 12h:12h light-dark cycle in fresh water (FW) at ambient temperature before experimentation until the
experiments. Eels naturally undergo long periods of fasting as part of their natural life-cycle and as such, were not fed during the holding or acclimation periods.
Groups of eels (n=6) were transferred to experimental tanks (6 eels per 100 L tank) containing FW 2-3 days before experimentation. Salinity transfer was achieved by decreasing the water level to approx 5 % then re-filling back to initial levels over a 1 hour period with SW (salinity stressed) or FW
Table 3.1.a. Eel acclimation groups.
Eel type Condition Acclimation time Number of Fish
Silver SW 6 Hours 6
Silver FW 6 Hours 6
Silver SW 2 Days 6
Silver FW 2 Days 6
Silver SW 7 Days 6
Silver FW 7 Days 6
Silver SW 5 Months (Longterm) 6 Silver FW 5 Months (Longterm) 6
Yellow SW 7 Days 6
3.2 Metadata
Physiological data and biological observations, collectively known as metadata, were recorded for each fish used in the experiment; whole fish weight; tissue weight; presence of parasites and signs of disease (e.g., lesions on skin or internal organs); disturbance and kill times.
3.3 Total RNA Extraction
The RNA extraction protocol was adapted from Chomczynski and Sacchi (1987). In brief, tissues were homogenised in 10 times volume:weight of Solution D (4 M guanadinium thiocynate, 10 % v/v β-mercapthoethanol, 1 mM EDTA, 10 mM Tris-HCl, pH 7.5) using a Polytron System PT3100 Homogeniser (Kinematica, Luzern, Switzerland) or using a syringe and 16 gauge needle. Following homogenisation the following solutions were added sequentially and votexed after each addition; 0.1 volume 2 M sodium acetate, pH 4; 0.5 volume phenol and 0.2 volume 1bromo-2chloropropane (BCP). Samples were centrifuged at 5020 g for 35 min at 0 °C, (Beckman J6-M6, Rotor 4.2). The supernatant was transferred to a new tube and 0.2 volume BCP added, the mixture was then vortexed and centrifuged as before. The supernatant was mixed with 0.2 volume isopropan-2-ol and 0.2 volume High Salt Buffer (1.2 M NaCl, 0.8 M sodium citrate), vortexed and incubated at room temperature for 10 min before being centrifuged for 20 min at 5020 g at room temperature. The second BCP step was omitted to maximise the RNA yield from brain samples. The supernatant was removed and the remaining pellet was washed twice in 70 % ethanol and air dried before being
resuspended in H2O (all water was distilled and purified >18mΩ (Milli-Q, Millipore, Waterford, UK)). The RNA concentration was calculated using spectrophotometric absorbance at 260 nm.
The quality of RNA was determined by visualising the 18 Svedberg unit (S) and 28S bands on a denaturing agarose gel (see Results 4.2). The
formamide (62.5 % v:v), formaldehyde (9.25 % v:v), 1.25 x MOPS buffer, bromophenol blue (50 µg/ml)} and heated to 65 ºC for 15 min to denature the secondary structure of the RNA. The samples were cooled to room
temperature and loaded into the wells and a current of 10 mV/cm applied until the bromophenol dye front had traveled ~2/3 of the length of the gel. The gel was washed for 30 min in H2O to remove formaldehyde followed by RNA staining by immersing the gel in a solution of ethidium bromide 10 µg/ml for 30 mins. Excess stain was removed by washing the gel three times in H2O for 30 min each.
Ratios of relative intensity of 18S:28S rRNA bands were determined by densitometric analysis using GeneSnap and GeneTools (Syngene, UK) and used to highlight degraded RNA samples; intact RNA should have an 18S:28S ratio of 1:2.
3.4 Messenger RNA Isolation
Messenger RNA (mRNA) for each tissue was isolated from total RNA pooled from each fish within a group. Each tissue pool contained 1.2 mg total RNA comprising 20 µg taken from each fish in each experimental (FW/ SW) and control (FW/ FW) group. mRNA was extracted from the total RNA by oligo (dT)-cellulose affinity column chromatography using an adaptation of a standard method (Berger and Kimmel, 1987). In brief, 0.25 g oligo (dT)-cellulose was resuspended in H2O to remove fine particles and then stacked in a 3 ml clear syringe blocked with ashless cotton wool. Three column
volumes (CV) of binding buffer (Tris-HCl 0.01 M, pH 7.5), NaCl (0.5 M), EDTA (1 mM, pH 8), 0.5 % SDS) were passed through the column. A peristaltic pump assisted the flow of liquid through the column and the final binding buffer was drawn through until level with the top of the cellulose. Total RNA (1.2 ml of 1 mg/ ml) was mixed with an equal volume of 2 x binding buffer and heated to 65 °C for 5 minutes, cooled on ice for 2 minutes, applied to the column and drawn through until level with the cellulose surface. The sample was left for 2 mins at room temperature and then the column was washed with 3 CV binding buffer. The entire eluate was collected, reheated to 65°C for 5 minutes, cooled on ice and reapplied to the column at room temperature. This was followed by a further 5 CV binding buffer and then 3 CV wash buffer (0.01 M Tris-HCl, 0.5 M NaCl, 1 mM EDTA, pH 7.5). The effluent was
3.5 Commonly used techniques, buffers and oligonucleotides
The following techniques were used frequently during the development of the cDNA libraries (Sections 3.6 to 3.16). To minimise repetition the reader will be referred back to this section when standard protocols were used. Commonly used buffers and oligonucleotides are presented in Tables 3.5.a and 3.5.b respectively.
General PCR conditions: Reactions were carried out in a final volume of 25 µl containing 1 µl template DNA, 1 µl forward primer (10 mM), 1 µl reverse primer (10 mM), 5 µl betaine (5 M), 2.5 µl 10 x PCR buffer, 1 µl dNTPs (10 mM each), 3 µl magnesium acetate (25 mM), 0.5 U Accurase™ (Biogene, UK) and H2O to 25 µl. Cycling parameters were 95 ºC for 2 min, followed by 40 cycles of 95 ºC for 10 s, X ºC (specific for each primer set) for 10 s, 68 ºC for 5 min (plus 20 s added incrementally per cycle), with final extension for 10 min.
DNA agarose gel electrophoresis: Agarose (1 g, high-pure low EEO, BioGene, Cambridge, UK) was suspended in 100 ml 1 x TAE buffer (4 mM Tris-acetate, 0.1 mM EDTA) and dissolved by boiling for several minutes. The solution was cooled to 40 ºC and ethidium bromide added to a final concentration of 1 µg/ ml before pouring into a mould and inserting a Teflon coated comb with the appropriate number of wells, and allowed to set at room temperature for 30 min. DNA samples were mixed 6:1 with 6 x DNA loading buffer {1 x TAE, bromophenol blue (1.2 %, w:v), glycerol (25 %, v:v)}. Gels were submersed in 1 x TAE buffer, DNA samples loaded and a current of 10 mV/cm applied until the bromophenol dye front had traveled ~2/3 of the length of the gel.
DNA samples to be quantified were serially diluted and 1 µl of each dilution applied to the gel surface alongside serially diluted DNA solution of the plasmid pEXP7-tet (50 ng/µl, Invitrogen, Paisley, UK). DNA was visualised under UV light and comparatively quantified by eye.
DNA precipitation: Unless otherwise stated all DNA precipitation was performed by adding glycogen (1 µl, 20 µg/µl) to the DNA solution followed by 0.1 volume 7.5 M ammonium acetate and 2.5 volumes ice cold 100 % ethanol and incubated for at least 10 min at –20 ºC. DNA was pelleted by
Table 3.5.a. Chemical details of commonly used buffers
1 x TE Tris-HCl (10 mM), EDTA (1 mM) 1 x TAE Tris-acetate (4 mM), EDTA (0.1 mM)
TEN buffer 10 mM Tris-HCl, pH 7.5; 0.1 mM EDTA; 25 mM NaCl) 1 x SSPE 180 mM NaCl, 1 mM EDTA, 10 mM NaH2PO4, pH 7.4) 10 x Black Buffer
(Biogene, Cambridge, UK)
Tris-HCl (750 mM, pH 8.8), ammonium sulphate (200 mM) and Tween 20 (0.1%)
10 x Tris PCR Buffer Tricine (150 mM), potassium acetate (200 mM), Tween 20 (0.1% v:v) LB agar Bacto-tryptone (10 g), bacto-yeast extract (5 g), NaCl (10 g), dissolved in
950 ml, pH adjusted to 7.0 with NaOH (~0.2 ml, 5 M), volume made up to 1 l with H20 and autoclaved.
Terrific Broth Bacto-tryptone (12 g), bacto-yeast extract (24 g), glycerol (4 ml), dissolved in 900 ml, autoclaved, and added to a 100 ml sterile solution of KH2PO4
(0.17 M), K2HPO4 (0.72 M)
1 x SSPE buffer 150mM Sodium Chloride, 10mM Sodium Phosphate, 1mM EDTA
1 x SSC buffer Sodium chloride (0.15 M), sodium citrate (0.015 M)
SOC Bacto-tryptone (20 g), bacto-yeast extract (5 g), NaCl (0.5 g), dissolved in 950 ml,autoclaved and supplemeted with a sterile solution of KCl (10 ml. 250 mM, pH 7.0), a solution of MgCl2 (5 ml, 2M) and a sterile solution of
glucose (20 ml, 1 M)
mRNA isolation 1 x Binding Buffer
Tris-HCl (0.01 M, pH 7.5), NaCl (0.5 M), EDTA (1 mM), SDS (0.5% w:v)
mRNA isolation 1 x Wash Buffer
Tris-HCl (0.01 M, pH 7.5), NaCl (1 M), EDTA (1 mM)
mRNA isolation 1 x Elution Buffer
Tris-HCl (0.01 M, pH 7.5), EDTA (1 mM)
10 x MOPS buffer 10 ml, 0.5 M 3-(N-Morpholino)-propanesulfonic acid, pH 7.0; 50 mM sodium acetate; 5 mM EDTA
Table 3.5.b. Oligonucleotides and primers for PCR, QPCR, cDNA synthesis and RNA amplification. All sequences are 5’ – 3’ orientation. 14CSA = 14 carbon long spacer arm, P = phosphate group.
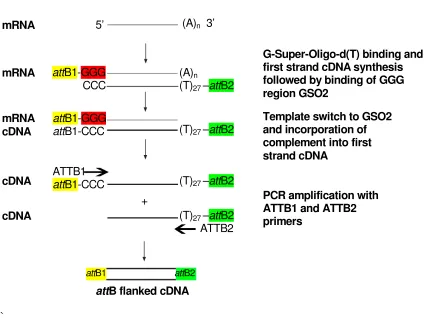
SMART™ cDNA PCR amplified library primers
G-Super-Oligo-d(T) 5′-GGGGACCCACTTTGTACAAGAAAGCTGGGTAGGCGGCGCCACTCCTGGAGCCCGT(T)26-3′
GSO2 5′-GGGGACAAGTTTGTACAAAAAAGCAGGCTAUGGCAGTGGTAACAACGCAGAGTACGCGGG-3′
SMART-attB1 5′-GGGGACAAGTTTGTACAAAAAAGCAGGCTAUGGCAGTGG-3′
SMART-attB2 5′-GGGGACCCACTTTGTACAAGAAAGCTGGGTAGG-3′
EnvGenIntOligo 5′-AGGCGGCGCCACTCCTGGAGCCCGT-3′
G-MCS2 5′-UGGCAGTGGTAACAACGCAGAGTACGCGG-3′
M13 Forward 5′-GTAAAACGACGGCCAG-3′
M13 Reverse: 5′-CAGGAAACAGCTATGAC-3'
CloneMiner Library Orignal primers Biotinylated Oligo d(T)
attB2 Primer 5′-Biotin.GGCGGCCGCACAACTTTGTACAAGAAAGTTGGGT(T)19-3′ attB1 adapter 5′-TCGTCGGGGACAACTTTGTACAAAAAAGTTGG-3′
3′-CCCCTGTTGAAACATGTTTTTTCAACC-P-5′
Biotinylated Random attB2
primer 5′-Biotin.GGCGGCCGCACAACTTTGTACAAGAAAGTTGGGT(N)6TGCCTG-3’
2G CloneMiner Primers Biotinylated 2G Oligo d(T) attb2 Primer
5′ -Biotin-GGCGGCCGCACAACTTTGTACAAGAAAGTTGGGTGGAACCGTCACGTAC(T)20-3′
Biotinylated 2G Random attB2 primer
5′
-Biotin-GGCGGCCGCACAACTTTGTACAAGAAAGTTGGGTGGAACCGTCACGTAC(N)6TGCCTG-3’ 2G attb1 adapter 5′-TCGTCGGGGACAACTTTGTACAAAAAAGTTGGGTGCATCAGCTGGACTAG-3′
3′-CCCCTGTTGAAACATGTTTTTTCAACCCACGTAGTCGACCTGATC-P-5′
NintpDONR222anti 5′-GTTGGGTGGAACCGTCACGTAC-3’
NpDONR222sense 5′-GTTGGGTGGAACCGTCACGTAC-3’
3G CloneMiner Primers
Biotinylated 3G Oligo d(T)
attB2 Primer
5′
Biotin-14CSA.GGCGGCCGCACAACTTTGTACAAGAAAGTTGGGTGGAACCGTCACTAGT(T)19-3′ Biotinylated 3G Random
attB2 primer
5′
Biotin-14CSA.GGCGGCCGCACAACTTTGTACAAGAAAGTTGGGTGGAACCGTCACTAGT(N)6TGCCT-3’ 3G attB1 adapter 5′-TCGTCGGGGACAACTTTGTACAAAAAAGTTGGGTGCATCAGCTGGACTAGT-3′
3′-CCCCTGTTGAAACATGTTTTTTCAACCCACGTAGTCGACCTGATCA-P-5′
3G Bi-directional Colony PCR primer
5′- GACTGATAGTGACCTGTTCGTTGCAACAAATTG-3′
Suppression Subtractive Hybridisation Primers
Oligo d(T) cDNA synthesis
primer 5’-TTTTGTACAAGCTT30N1N-3’
Adaptor 1 5’-CTAATACGACTCACTATAGGGCTCGAGCGGCCGCCCGGGCAGGT-3’ 3’-GGCCCGTCCA-5’
Adaptor 2R 5’-CTAATACGACTCACTATAGGGCAGCGTGGTCGCGGCCGAGGT-3’ 3’-GCCGGCTCCA-5’
Bi-directional PCR primer 5’-CTAATACGACTCACTATAGGGC-3’
SSH Nested PCR primer 1 5’-TCGAGCGGCCGCCCGGGCAGGT-3’
3.6 SMART cDNA PCR Amplified Library
SMART cDNA Synthesis. mRNA (1 µg) was combined in a 200 µl PCR tube with 1 µl G-Super-Oligo-dT (10 µM) and 1 µl GSO2 (10 µM), final volume 4 µl, and incubated at 65 ºC for 5 min to denature the nucleic acid and then cooled to 48 ºC. The temperature was maintained at 48 ºC during the addition of 2 µl 5x First Strand Buffer, 1 µl DTT (0.1 M) and 1 µl dNTPs (10 mM each). The solution was mixed by gentle pipetting before the addition of 1 µl RNAseOUT (40 U/µl, Invitrogen, Paisley, UK) and 1 µl Superscript III (200 U/µl, Invitrogen, Paisley, UK). The solution was mixed again and incubated at 48 ºC for 2 hours, cooled to 37 ºC and1 µl RNAse H (2 U/µl, Invitrogen, Paisley, UK) added and incubated at 37 ºC for 30 min.
SMART cDNA amplification. cDNA was amplified in 3 x 25 µl PCR reactions as detailed in Section 3.5 using SMART-ATTB1 (GGG GAC AAG TTT GTA CAA AAA AGC AGG CTA AGG CAG TGG ) and SMART-ATTB2 (GGG GAC CCA CTT TGT ACA AGA AAG CTG GGT AGG) primers with an annealing temperature of 58 ºC. These primers bind to the nested sites in the
attB adapters shown in Figure 3.7.a.
SMART cDNA Size selection. Following amplification, cDNA above 400 bp was size selected using SizeSep 400 Sepharose Columns (Amersham International, Little Chalfont, U.K). Columns were washed three times with 3 ml TAE buffer, pH 7.6 and centrifuged at 400 g for 2 min supported in 15 ml centrifuge tubes. The columns were transferred to fresh 15 ml centrifuge tubes and the cDNA samples were applied to the column. Following