Energy Systems Maintenance
Oyelami Opeyemi, Falah Al Hassan
Department of Electrical and Electronics Engineering, Eastern Mediterranean University, Famagusta, Northern Cyprus
Email: [email protected]
Received October 12, 2011; revised November 10, 2011; accepted November 24, 2011
ABSTRACT
The subject of maintenance is of much importance in the implementation of projects in today’s industries. Maintenance is carried on energy systems to keep their performance within acceptable standards and to maintain their average life expectancy. The cost associated with maintenance work is largely dependent on how often maintenance routines are carried out and the extent the work are done. Current maintenance work are usually carried out in accordance with the equipment manufacturer’s guide line and modified by experts as maintenance experience is gained. This paper dis-cusses the various maintenance schemes and the impact of maintenance on the life cycle costs of a system.
Keywords: Preventive Maintenance; Life Cost Analysis; LCC; HVAC; CMMS; ROI
1. Introduction
Maintenance has been more popular in principle than in practice over the years.
Maintenance is of much importance in today’s world. The idea of keeping equipment well maintained to extend its expected life and to avoid future repair cost is often misunderstood.
Life cycle costs (LCC) of both dynamic and static (as-sets) of energy systems are greatly influenced by the maintenance activities performed on them during their life cycle [1].
The relationship between the cost of maintenance and returns such projects can be expected to deliver is some-times unclear.
The HVAC (small unit for home use) was the test bed for this study. The study included the cost of:
1) Maintenance deemed necessary as suggested by the manufacturer.
2) The cost of installation/cost of maintenance. 3) The cost associated with systems breakup or system failure.
We investigate these relationships by describing the process of assessing the value of maintenance programs and activities, by analyzing them in key financial ratio. The results of the analysis of maintenance practices al-lowed us to evaluate the importance of maintenance in feasibility studies.
2. Maintenance
Maintenance is defined as the combination of all
techni-cal and administrative actions including supervision ac-tions intended to retain an item, or restore it, in a state in which it can perform a required function (British Stan-dards 3811, 1993).
Its objectives includes the following
Reducing breakdown and emergency shutdowns.
Reduction of down time.
Minimizing the energy usage.
Optimizing Resources utilization.
Maintenance of energy systems can be divided into the two maintenance actions.
Scheduled maintenance.
Unscheduled maintenance.
2.1. Scheduled Maintenance
The energy system manufacturer determines the initial maintenance requirements through the Operation and Maintenance Handbook. The requirements are initially treated as mandatory. However there comes a variation to the tasks or task scheduled as experience is developed within the operational environment.
The costs of performing the tasks, manpower material costs, as well as the costs of any extra work arising from the scheduled task are also considered [1]. The Figure 1
below, shows the major task performed under scheduled maintenance.
Scheduled Maintenance can be divided into:
Preventive Maintenance;
Corrective Maintenance;
Improvement Maintenance;
Schedule Maintenance
Scheduled Task
[image:2.595.73.267.81.262.2]Extra Work
Figure 1. Major components of scheduled tasks [1].
2.1.1. Preventive Maintenance
This is the type of maintenance carried out before fail-ures occur. This can be subdivided into scheduled and condition based preventive maintenance.
Scheduled preventive maintenance in energy systems includes replacements, adjustments, major overhauls, inspections and lubrications, adjustment or calibrations, cleaning and replacement of certain components [2].
Preventive Maintenance can also be subdivided into
Routine maintenance;
Running maintenance;
Opportunity maintenance;
Window maintenance;
Shutdown preventive maintenance.
All these depend on the manufacturer guideline, avail- ability of the machine as not to halt the process of pro-duction (machine is working or not) and cost of main-taining the system/machine at that particular period [1].
2.1.2. Corrective Maintenance
Corrective maintenance is subdivided into.
2.1.2.1. Remedial Maintenance
These are activities performed to eliminate the source of system failure without altering the continuity of the pro-duction process.
2.1.2.2. Deferral Maintenance
These are corrective maintenance activities that are not immediately initiated after the occurrence of a failure, but delayed in such a way that will not affect the process of production line [2].
Corrective maintenance includes the following steps
Fault detection.
Fault isolation.
Fault elimination and verification of fault elimination In fault elimination, however, several steps are taken
in order that fault eliminations can be carried out effec-tively. This includes
Identification of incipient problems;
Proper repair procedures;
Effective planning (depends on the skills of planner, availability of well developed maintenance database about standard time to repair, complete repair proce-dures, required labour skills, specific tools, parts and equipments.
Verification of repair;
Adequate time to repair.
2.1.3. Improvement Maintenance
This is always used in reducing the need or to completely eliminate the need for maintenance.
Improvement maintenance could be in the form of:
2.1.3.1. Design-Out Maintenance
These are set of improved maintenance activities used to eliminate the cause of maintenances, reduce maintenance tasks and to increase the performances of machines/sys- tems by redesigning those parts of the machine vulnerable to frequent occurrence of failures.
2.1.3.2. Engineering Services
This includes construction modifications, installations and rearrangement of facilities.
2.1.3.3. Shutdown Improvement Maintenance
Here, the production processes are put on hold, to per-form some improvement maintenance activities on the system.
2.1.4. Predictive Maintenance
Predictive maintenances are set of activities performed on a system to detect the physical condition of the equipment in order to carry out the appropriate maintenance works to maximizing the life span of the equipment without increasing the risk of failure [2].
Predictive maintenance is subdivided into two catego-ries:
Condition-based predictive maintenance.
This type of maintenance schedule specifies maintenance tasks as they are required by the system involved. It de- pends on the continuous and periodic condition monitor-ing of the equipment to detect any sign of failure.
Statistical-based predictive maintenance.
This depends on the information and statistical data gathered as a result of the careful and cautious recording of the stoppages of parts of the system and its components, in order to develop models for predicting failures.
However, its main setback is that it depends solely on the information gathered over a period of time, and the correct interpretation of this information.
It is sometimes classified as a form of preventive maintenance.
2.2. Unscheduled Maintenance
The unscheduled maintenance has to do with unplanned maintenance works, carried out on energy systems in the case of emergency or breakdowns. The cost of a system failure includes cost of repair, deferral cost of that repair (if applicable) and cost of operational disruption as a result of the failure. Figure 2 shows the major compo- nents of the unscheduled maintenance.
2.2.1. Repair Cost
Repair costs include manpower required to remove the associated components as well as shipping, administration and shop repair costs [1]. Repairs may be performed on energy systems in which case, the manpower and materi- als will contribute to the costs.
2.2.2. Deferral Cost
Sometimes it will be acceptable with some of the system inoperative. Details of these systems are usually given in the manufacturer handbook. Costs of deferral accounts for the resources required to take the action detailed, and must also account for operational restrictions due to in-operative systems.
2.2.3. Operational Disruption Cost
Operational disruption cost can vary significantly in the type of system involved, production process involved and the location where the system is situated.
3. CMMS (Controlled Maintenance)
With the advent of new technologies, the CMMS is in-troduced to enhance maintenance of energy systems.
A computerized maintenance management system (CMMS) is a type of management software that performs functions in support of management and tracking of O & M activities [3].
It involves some software in tracking the energy sys-
Unscheduled Maintenance
Repair Deferral Operational
[image:3.595.58.286.626.717.2]Disruption
Figure 2. Major components of unscheduled tasks [1].
tem installed in a company or building. It is usually managed by experts from maintenance companies.
3.1. How CMMS Works
A CMMS system automates most of the logistical func- tions performed by maintenance staff and management [3]. Some of its many functions include the following:
Production of work orders, prioritization, and tracking of equipments/systems.
Historical tracking of all work orders generated which become sortable by equipment, date, person responding, etc. [3].
The tracking of scheduled and unscheduled main- tenance activities.
CMMS programs are in such a way that they have in-terface with the existing energy management and control systems (EMCS).
3.2. Benefits and Shortcomings of CMMS
The benefits of the CMMS include the following:
Earlier detection of impending problems before a failure.
Allow a higher level of planned maintenance acti- vities that lead to a more efficient use of staff re-sources.
Affects inventory control, enabling a better spare parts forecasting to minimize existing inventory and reduce shortage.
CMMS has its own shortcomings. These include the following:
Having an improper selection of a CMMS vendor.
Inadequate O & M and administrative staff training on proper use of the CMMS.
4. Preparing a Maintenance Plan of an
Energy System
The steps and format of preparing a maintenance plan will vary depending on the application and design of maintenance systems [4]. The key steps in preparing a typical maintenance plan will include the following:
Prepare an asset inventory;
Identify maintenance activity and tasks;
Identify the frequency of the task;
Develop an annual work schedule;
Prepare and issue a work order.
4.1. Case Study: The Maintenance of HVAC Systems
quality, the HVAC system must respond to a variety of conditions inside and outside the building (including weather, time of day, different types of spaces within a building and building occupancy), while simultaneously optimizing its operations and related energy usage.
The reasons to properly maintain a HVAC system, in-clude the following;
Lower utility costs;
Increase the service life of the HVAC equipment (re-duces replacement cost);
To create a greater comfort for the building’s occu- pants.
HVAC systems can be very complex, consisting of many components. The major components include boi- lers, chillers, air-handling units (AHUs), air terminal units (ATUs), and variable air volume equipment (VAV).
Hence these are some of the needed maintenance works on HVAC.
4.1.1. Steady State Test
At each servicing, a steady state efficiency test should be performed with proper efficiency testing equipment. The testing performances are always within the range reco- mmended by the manufacturer [5].
4.1.2. Filters
1) It is important to ensure that the correct filter size is installed. If this is not done, the air will escape around and without it being filtered (air bypass).
2) The filter media should be checked for damages regularly.
3) The filter compartments should be kept air tight fit-ted.
The use of differential pressure drop meter provides the reading on the meter [5] and helps to know when there is a need to change the filter.
4.1.3. Air-Handler Blow Vane
Dirt building up on the blower vanes will greatly reduce the air flow. They need to be cleaned as necessary.
4.1.4. Controls
It is important to verify the operation of all controls, in-cluding thermostat anticipators and furnace blower fan and limit control.
4.1.5. Burner Orifices
There is a need for the burner orifice to be properly sized for the gas type and burner input.
4.2. Effect of Maintenance on the Life Cycle Cost of a System
The HVAC system used as a case study consists of a
17-yr old chiller whose estimated expectancy is 20 years. Both preventive and corrective maintenances were carried out on the system.
We investigated the effect of these maintenance works on the system. Three scenarios were considered:
Full recommended maintenance (as from the Manu- facturer’s handbook);
Half of the recommended maintenance work;
No maintenance work carried out.
[image:4.595.307.536.387.729.2]The energy analysis was carried out by taking note of all expenses spent on the installation, energy consumed, and the cost of carrying out maintenance works on the HVAC.
Table 1 shows the purchase cost, installation cost and the initial investments (in terms of the energy and main- tenance cost) on the HVAC.
To make the analyses simpler, we only considered the purchase cost, installation cost and operation and mainte-nance cost of the Chiller, Cooling tower, chilled-water pump and pipes. All other system components are as-sumed to be the same for the Chiller.
The operational cost is comprised of the energy costs and maintenance costs.
Table 1. Cost data for HVAC Installation [6].
Costs of Components HVAC
Purchase costs:
1) Chiller $67,950
2) Cooling Tower $15,320
3) CW Pump & Piping $6410
4) Cond. Water pump & piping $5675
Installation costs
Chiller $26,730
Cooling Tower $3340
CW Pump and Piping $4520
Cond. Water Pump & Piping $2100
Total Initial Investment $130,155
Energy Costs:
Annual Energy costs $80,310
Maintenance Costs:
Chiller $3000
Cooling tower $1200
Pump & water Treatment $2005
Maintenance cost/Yr $6205
The energy cost was calculated from the energy simu-lations run with the Carrier HAP (Hourly Analysis Pro-gram)with an assumption of 0.60 kW/ton (0.17 kW/kW) [6].
Discount Rate = 10% Analysis years = 20 yr Assuming,
Old re-investment costs = $35,000 (every 4 yr) Old annual energy cost = $140,000/yr
(Previous energy Audit)
Old Operation and Maintenance = $3000 From Table 1,
New Investment = $130,155 New Re-investment (replacement)
= $32,539 (25% of Investment) New Annual Energy cost
= $80,310/yr (From Table 1) New Operation and Maintenance cost
= $6205/yr
Residual Value = 10% of purchase price = $9535.5 gain inve ROI investm stment 100 ent
Scenerio 1: No maintenance work in Place Annual energy = (old Energy cost – New energy cost)
+ (old O/M – New O/M) = (140,000 – 80,310) + (3000 – 0) = 62,690
Using the life cycle analysis tool Table 2 above shows the analysis of the investments on the HVAC for a period of 20 yr.
[image:5.595.308.536.98.433.2]The result obtained from the available data, given in
Table 3 for Scenario 1, is given below: The Net Present Value, NPV = $427,812 Internal Rate of return = 53%
Savings to Investment ratio = 5.0 Payback years = 2.1 yr
Return on Investment (ROI) = 403.96%
Scenario 2: Half of the recommended maintenance work
New Investment O/M = $4000
Annual energy = (old Energy cost – New energy cost) + (old O/M – New O/M)
= (140,000 – 80,310) + (3000 – 4000) = 58,690
The life cycle investment schedule from Table 2 is still in use.
[image:5.595.309.538.459.522.2]The result obtained from the available data, given in
Table 4 for Scenario 2, is given below; Net Present Value, NPV = $393,758 Internal Rate of return = 49% Savings to Investment ratio = 4.7 Payback years = 2.2 yr
Table 2. Life cycle investment schedule.
Year New Old Net Amount
0 $130,155 $130,155
1 $0
2 $35,000 –$35,000
3 $0
4 $32,539 $32,539
5 $0
6 $35,000 –$35,000
7 $0
8 $32,539 $32,539
9 $0
10 $35,000 –$35,000
11 $0
12 $32,539 $32,539
13 $0
14 $35,000 –$35,000
15 $0
16 $32,539 $32,539
17 $0
18 $35,000 –$35,000
19 $0
Table 3. Available data for life cycle analysis for scenario 1.
Annual Savings $62,690
Discount Rate 10%
Analysis period (years) s20
[image:5.595.307.539.550.613.2]Residual value $9536
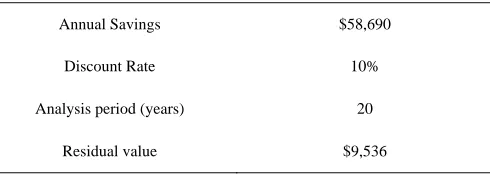
Table 4. Available data for life cycle analysis for scenerio 2.
Annual Savings $58,690
Discount Rate 10%
Analysis period (years) 20
Residual value $9536
Return on Investment (ROI) = 372%
Scenario 3: Full recommended maintenance
New Investment on O/M = $6205
Annual energy = (old Energy cost – New energy cost) + (old O/M – New O/M)
= (140,000 – 80,310) + (3000 – 6205) = $56,485
The result obtained from the available data, given in
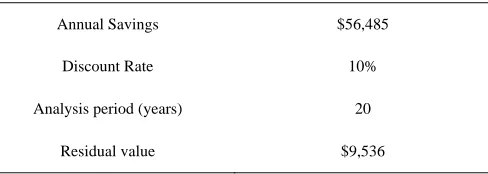
Table 5. Available data for life cycle analysis for scenario 3.
Annual Savings $56,485
Discount Rate 10%
Analysis period (years) 20
Residual value $9536
Net Present Value, NPV = $374,985 Internal Rate of return = 48% Savings to Investment ratio = 4.5 Payback years = 2.3 yr
Return on Investment (ROI) = 354.0%
The detailed life cycle analysis calculation is given in the Appendix.
From the analysis above, the expected (ROI) when weak or no maintenances were put in place seems high. This could look good but the explanation is given in the next section.
4.2.1. Scenario 1: No Maintenance in Place
Scenario 1 assumes that nothing is spent on maintenance. Therefore the cost of preventive maintenance will be zero in this case. The cost of repairs, the cost of energy, and the frequency of equipment replacement will in-crease, because the equipment is assumed not to be maintained [7]. The frequency of repairs increases in an amount similar to the expected-life degradation [7]. For example, even with proper maintenance, a compressor would need to undergo minor repair every four years [7]. This scenario assumes that the repair frequency will in-crease by 20 percent. A 403.96% ROI seems like a huge return, and it is.
Consider, however, the cost of just one piece of equip-ment: A chiller. The chillers would cost an average of $67,950 to replace. Maintaining the chiller costs $3000 per year, and proper maintenance adds years to the equipment’s life, avoiding the extremely expensive capi-tal outlay needed to replace it [7].
4.2.2. Scenario 2: Half of the Recommended Maintenance
In Scenario 2, a lesser value of PM was being invested on the HVAC against the recommendations from the manufacturer. For example, if the expected life of a Chiller will decrease by 20 percent if not maintained and proper maintenance will cost $3000 per year. Therefore if $1500 (half the recommended amount) is spent on chiller maintenance, the expected life would decrease by 10 percent instead of 20 percent.
4.2.3. Scenario 3: Recommended PM (From Manufacturer)
In Scenario 3, the manufacturer’s recommended amount
of preventive maintenance was considered. The equip-ment is assumed to last its expected life and that energy performance will not degrade over the life of the equip-ment [7].
If the average age of the chiller is 17 years, the ex-pected useful life of the chiller is 20 years, so in years 3 and 23 of the Scenario 3 analysis (from the manufac-turer), the chiller needed to be replaced. In Scenario 1, the expected useful life of the chiller would be 16 years, and it needs to be replaced in years 1 and 17 of the analysis.
This analysis indicates that the expense spent or to be spent can be pushed out over time by properly maintain-ing the equipment.
5. Conclusions
The effect of maintenance on energy systems cannot be underestimated. It has valuable effects on the life cycle cost of a system and as well as on the energy utilization with improvement on the life span of the system.
The results obtained from this research has shown that maintenance has a way of improving the ROI of the amount invested in installing and building of a system, especially the HVAC system used in homes. It is ideal that more preventive maintenance should be carried out on the HVAC as compared to the corrective mainte-nances.
Finally, following a strict and comprehensive mainte-nance schedule will prolong a building’s HVAC systems, save cost of replacements, reduce the loss of energy and increase the comforts of the building occupants.
6. Acknowledgements
The authors are grateful to Prof. Dr. Osman Kukrer who took his time to go through the manuscript and offered many advices.
REFERENCES
[1] A. Yabsley and Y. Ibrahim, “Study on Maintenance Con-tribution to Life Cycle Costs: Aircraft Auxiliary Power Unit Example,” School of Applied Sciences and Engi-neering, Monash University, Churchill, 2008.
[2] Anonymous, “General Maintenance,” 2009.
http://www.slideshare.net/pradhyot05/general-maintenanc e
[3] G. Sullivan, R. Pugh, A. P. Melendez and W. D. Hunt, “O & M Best Practices Guide, Release 3.0,” Federal Energy Management Program, US Department of Energy, Pacific Northwest National Laboratory, August 2010. [4] R. Suttell, “Preventive HVAC Maintenance is a Good
Investment,” The Source for Facility Decision Makers Buildings, 2006. www.buildings.com
Installation and Maintenance Practices for Residential HVAC Systems,” Consortium for Energy Efficiency, Bos-ton, 2000.
[6] C. J. Gann, “Computer Applications in HVAC System Life Cycle Costing,” Communication White Carrier
Cor-poration, Syracuse.
Appendix
The tables below show the life cost analysis of the HVAC considered in this paper.
Scenario 1. No Maintenance Work Carried Out
In this case,
Annual energy = (old Energy cost – New energy cost) + (old O/M – New O/M) = (140,000 – 80,310) + (3000 – 0)
= 62,690
Available data for life cycle analysis for Scenario 1.
Annual Savings $62,690
Discount Rate 10%
Analysis period (years) 20
Residual value $9536
Life cycle investment schedule.
Year New Old Net Amount
0 $130,155 $130,155
1 $0
2 $35,000 –$35,000
3 $0
4 $32,539 $32,539
5 $0
6 $35,000 –$35,000
7 $0
8 $32,539 $32,539
9 $0
10 $35,000 –$35,000
11 $0
12 $32,539 $32,539
13 $0
14 $35,000 –$35,000
15 $0
16 $32,539 $32,539
17 $0
18 $35,000 –$35,000
Life cycle cost analysis calculation for Scenario 1.
TABLE 3: Savings Calculations Formula: PV Annual Savings = Annual Savings/(1 + Discount Rate)year
Year 0 1 2 3 4 5
Annual Savings $0 $62,690 $62,690 $62,690 $62,690 $62,690
PV Annual Savings $0 $56,991 $51,810 $47,100 $42,818 $38,926
S PV Annual Savings $533,715
TABLE 4: Investments Formula: PV Life Cycle Investment = Life Cycle Investment/(1 + Discount Rate)year
Year 0 1 2 3 4 5 6
Net Life Cycle Investments $130,155 $0 –$35,000 $0 $32,539 $0 –$35,000
PV Life Cycle Investments $130,155 $0 –$28,926 $0 $22,225 $0 –$19,757
S PV Life Cycle Investments $105,903
Net Cash Flows
(for IRR calculation) ($130,155) $62,690 $97,690 $62,690 $30,151 $62,690 $97,690
TABLE 5: Results OUTPUTS
Net Present Value (NPV) $427,812
Savings-to-Investment Ratio 5.0
Internal Rate of Return (IRR) 53%
Simple Payback (years) 2.1
gain inve
ROI
investm
stment
100 ent
Therefore ROI = $533, 715 $
$105, 903
105, 903
100
= 403.96%
Scenerio 2. Half of the Recommended Maintenance
Annual energy = (old Energy cost – New energy cost) + (old O/M – New O/M) = (140,000 – 80,310) + (3000 – 4000)
= 58,690
Available data for life cycle analysis for Scenario 2.
Annual Savings $58,690
Discount Rate 10%
Analysis period (years) 20
[image:9.595.179.424.641.728.2]Life cycle cost analysis calculation for Scenario 2.
TABLE 3: Savings Calculations Formula: PV Annual Savings = Annual Savings/(1 + Discount Rate)year (from Step 7)
Year 0 1 2 3 4 5 6
Annual Savings $0 $58,690 $58,690 $58,690 $58,690 $58,690 $58,690
PV Annual Savings $0 $53,355 $48,504 $44,095 $40,086 $36,442 $33,129
S PV Annual Savings $499,661
TABLE 4: Investments Formula: PV Life Cycle Investment = Life Cycle Investment/(1 + Discount Rate)year
Year 0 1 2 3 4 5 6
Net Life Cyle Investments $130,155 $0 –$35,000 $0 $32,539 $0 –$35,000
PV Life Cycle Investments $130,155 $0 –$28,926 $0 $22,225 $0 –$19,757
S PV Life Cycle Investments $105,903
Net Cash Flows
(for IRR calculation) ($130,155) $58,690 $93,690 $58,690 $26,151 $58,690 $93,690
TABLE 5: Results OUTPUTS
Net Present Value (NPV) $393,758
Savings-to-Investment Ratio 4.7
Internal Rate of Return (IRR) 49%
Simple Payback (years) 2.2
gain inve
ROI
investm
stment
100 ent
Therefore ROI = $499, 661 $
$105, 90
105, 903
100
3 = 372%
Scenario 3. Recommended Maintenance
Annual energy = (old Energy cost – New energy cost) + (old O/M – New O/M) = (140,000 – 80,310) + (3000 – 6205)
= $56,485
Life cycle investment schedule for Scenario 3.
Annual Savings $56,485
Discount Rate 10%
Analysis period (years) 20
[image:10.595.180.424.641.728.2]Life cycle cost analysis calculation for Scenario 3.
TABLE 3: Savings Calculations Formula: PV Annual Savings = Annual Savings/(1 + Discount Rate)year (from Step 7)
Year 0 1 2 3 4 5 6
Annual Savings $0 $56,485 $56,485 $56,485 $56,485 $56,485 $56,485
PV Annual Savings $0 $51,350 $46,682 $42,438 $38,580 $35,073 $31,884
S PV Annual Savings $480,889
TABLE 4: Investments Formula: PV Life Cycle Investment = Life Cycle Investment/(1 + Discount Rate)year
Year 0 1 2 3 4 5 6
Net Life Cyle Investments $130,155 $0 –$35,000 $0 $32,539 $0 –$35,000
PV Life Cycle Investments $130,155 $0 –$28,926 $0 $22,225 $0 –$19,757
S PV Life Cycle Investments $105,903
Net Cash Flows
(for IRR calculation) ($130,155) $56,485 $91,485 $56,485 $23,946 $56,485 $91,485
TABLE 5: Results OUTPUTS
Net Present Value (NPV) $374,985
Savings-to-Investment Ratio 4.5
Internal Rate of Return (IRR) 48%
gain inve
ROI
investm
stment
100 ent
Therefore ROI = $480,889 $10
$105, 90
5, 903
100
![Figure 1. Major components of scheduled tasks [1].](https://thumb-us.123doks.com/thumbv2/123dok_us/9252544.413783/2.595.73.267.81.262/figure-major-components-scheduled-tasks.webp)
![Figure 2. Major components of unscheduled tasks [1].](https://thumb-us.123doks.com/thumbv2/123dok_us/9252544.413783/3.595.58.286.626.717/figure-major-components-unscheduled-tasks.webp)
![Table 1. Cost data for HVAC Installation [6].](https://thumb-us.123doks.com/thumbv2/123dok_us/9252544.413783/4.595.307.536.387.729/table-cost-data-hvac-installation.webp)