0 Bachelor assignment report
Critical current degradation under transverse compressive stress in
YBCO-coated superconductive tapes
Simon Otten & Rudy Lagraauw
Rutger Pompe van Meerdervoort (tutor) Arend Nijhuis (teacher)
1
Summary
Before magnets can be produced from high-Tc superconductors, understanding of the electrical
2
Contents
1. Introduction 3
2. Theoretical aspects 4
2.1. Superconductive YBCO tapes 4
2.2. The effect of transverse stress on the critical current density 5
2.3. Current transfer from metal to superconductor 7
3. Experimental aspects 12
3.1. Setup 12
3.2. Bennie ten Haken’s press 12
3.3. Pushing heads 14
3.4. Electronic equipment 15
3.5. Force measurement using a strain gauge and calibration 16
3.6. Measuring procedure 19
3.7. Analysis of the YBCO layer 21
4. Results 22
4.1. Pushing head type 1 22
4.2. Pushing head type 2 and type 3 24
4.3. Damage observations using microscope 27
5. Discussion 30
6. Conclusion 32
7. Appendix 33
7.1. Etching pictures 33
3
Chapter 1: Introduction
ITER (International Thermonuclear Experimental Reactor) is an international project which aims to demonstrate the scientific and technical feasibility of nuclear fusion as a clean, safe and
inexhaustible way of power generation. To achieve this, a large fusion reactor is currently being built in southern France in which the following nuclear reaction will be investigated:
A deuterium nucleus and a tritium nucleus, both hydrogen isotopes, come together to form a helium nucleus and a neutron. Because helium has lower binding energy per nucleus than hydrogen, this reaction releases energy. However, this reaction occurs only at extremely high temperatures (104-105 K) because of the high activation energy. Such high temperatures can only be reached in a confined plasma. ITER builds a tokamak that confines the plasma using a 12 T magnetic field. This magnetic field is created by low temperature superconductive coils which need to be cooled using liquid helium. ITER’s successor, DEMO (DEMOnstration Power Plant), plans to use high temperature superconductors instead. These materials are cooled using liquid nitrogen instead of helium and this has some important advantages:
Nitrogen is abundant and liquid nitrogen is much cheaper to produce than liquid helium.
Because the magnets are held at a 77 K instead of 4.2 K, the temperature gradient to the environment is lower and therefore less energy is needed for cooling. This increases the potential efficiency of the reactor.
The wires in the tokamak are exposed to enormous Lorentz forces caused by the high currents (order 104 A) and strong magnetic fields, so it is important to develop understanding of the mechanical properties of superconductive wires. For low temperature superconductors this job is finished and wires have been designed for ITER which can withstand the forces. High
temperature superconductors need more research before reliable magnets for DEMO can be produced. This assignment focuses on the degradation of the critical current under mechanical stress. The critical current is elaborated on in section 2.1.
The wires inside magnets are exposed to several types of forces and these include tensile stress, compressive stress and bending. For this assignment we use a press that can only apply
transverse compressive stress, so the rest of this report will focus on this type of stress.
4
Chapter 2: Theoretical aspects
2.1 Superconductive YBCO tapes
2.2 The effect of transverse stress on the critical current density 2.3 Current transfer from metal to superconductor
2.1 Superconductive YBCO tapes
YBCO, which stands for Yttrium-Barium-Copper-Oxide, belongs to the high temperature
superconductors. This means that YBCO shows superconducting properties even at temperatures above the boiling point of nitrogen at atmospheric pressure (77K). The critical temperature at which it enters the resistive state is 92K1. Like other superconductors, YBCO can only super conduct currents lower than its critical current density. For our experiments, the critical current density is defined as the current density at which the electric field inside the superconductor is 100μV/m. The critical current density is dependent on temperature, magnetic field and
mechanical stress.
[image:5.612.76.529.419.618.2]Superconductive wires based on YBCO do not consist of pure YBCO but they have several other layers. These are needed for protection of the YBCO crystal and to provide current transfer to the superconductor. The YBCO tape used in our experiment is the SuperPower SCS4050 tape of which a cross section can be seen in figure 2.1.
Figure 2.1: Cross section of the SuperPower SCS4050 superconductive tape2
5
and for protection against mechanical stress. They also provide additional conductive layers which can carry the current in case of a breakdown of the superconductor. This prevents the formation of high voltages that would otherwise destroy the wire. The width of the tape is 4 mm so the total superconductive cross section is 0.004 mm2. The minimum critical current for this wire is 80 ampere according to the specification.2 From these values, it follows that the critical current density amounts .
2.2 The effect of transverse stress on the critical current density
Some research has already been done on the effect of transverse stress on different kinds of YBCO tape. These studies provide useful experimental techniques and interesting results that can be reproduced or lead to other experiments.
In a study by Tomoaki Takao, uniform transverse stress was applied to different lengths of the tape using pushing heads with different widths (0.5 mm, 1 mm and 2 mm). Next, the critical current was measured as a function of the stress. An interesting result was that the effect of the stress is different for both sides of the tape. When the pushing head is pressed on the non-coated side of the substrate (lower side in Figure 2.1), the critical current degrades at much lower pressures than when pressing on the YBCO-coated side. This effect is clearly visible on the next page in figure 2.4.The difference was explained as follows: “When we push the tape from the silver face, the YBCO layer is above the Hastelloy in the tape structure; the Hastelloy is bent in convex shape underneath and hence the YBCO layer is compressed. On the contrary, when the tape is compressed from the Hastelloy face, the YBCO layer is tensile along the tape direction, because the YBCO layer is below the Hastelloy and the Hastelloy is bent in convex shape
underneath. According to the bending test to the YBCO tape, degradation due to the compression to the YBCO layer hardly occurred3. Hence in case of the compression from the silver surface, Ic
6 Figure 2.2:Takao’s results, 0.5 mm pushing head
Figure 2.3:Takao’s results, 1 mm pushing head
2.4: Takao’s results, 2 mm pushing head
This experiment was done for YBCO tape which had only a silver overlay but no copper
7
Another study by Cheggour et al. investigates the effects of transverse stress on YBCO tapes with different substrates of nickel and nickel alloys. Transverse stress was applied in two different modes:
In monotonic loading mode, stress was applied to the sample and gradually increased without releasing the load between the measurement steps.
The load-unload mode consisted of applying stress of a certain value to the sample, the releasing it before reapplying it at a higher value.
The load-unload mode caused much more degradation of critical current than the monotonic loading mode. This difference was explained as follows: “In the monotonic-loading mode, the sample has a strong frictional support from the pressing anvils. We believe this support prevents the sample from expanding laterally. In contrast, the frictional support is significantly reduced when operating in the load-unload mode. In-plane expansion becomes possible, which may lead to cracking of the buffer and YBCO layers.”5 Because of these differences, it is critical to investigate the effect of both loading modes.
2.3 Current transfer from metal to superconductor
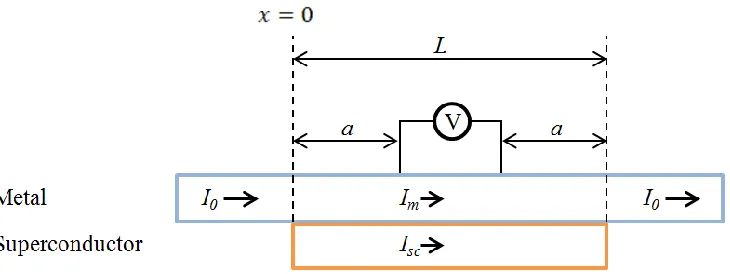
The YBCO tape consists of a coated substrate in a metal casing. This metal casing is needed for protection and current transfer to the superconductor. The metal casing is connected to a current source which provides a current I0. As soon as the metal comes into contact with the
superconductor, current starts to transfer to the superconductor because of the lower resistivity. In order to calculate the electric field inside the superconductor, a second pair of wires is
connected to the metal at a distance a from the current leads. These wires are used to measure the voltage over the part of the tape in between.
To make reliable measurements of the critical current, the current through the metal (Im) must be
negligible compared to the current through the superconductor (Isc). To achieve this, the distance
a must be large enough to allow most of the current to flow into the superconductor. In this section the potential difference between the voltage wires caused by Im will be calculated
8
Figure 2.5: Current flows through metal and is transferred to the
superconductor. Voltage across the sample is measured using a separate pair of wires.
At a junction between metal and a superconductor, the current in the metal decays on a length scale , called the current transfer length which is given by6:
[1]
In this equation R is the surface resistance at the metal-superconductor interface, t is the thickness of the metal layer and is the resistivity of the metal layer.
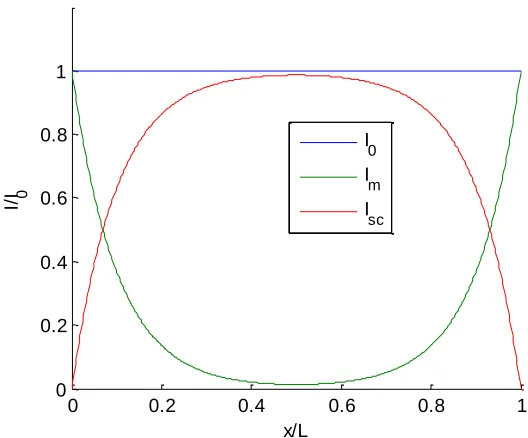
For a tape of length L, the current through the metal decays exponentially from both sides. This can be approximated by the following equation:
At both ends of the tape the entire current I0 flows through the metal, so
Thus
9
The voltage across the metal can be calculated using Ohm’s law:
In this equation A is the cross section of the metal casing. For an infinitesimal slice of metal:
[image:10.612.163.427.80.299.2]
The potential difference between the voltage connectors caused by the resistance of the metal is computed by integrating over the tape from to :
Figure 2.6: This graph shows the current through the metal Im and the current through the superconductor Isc as a
function of x
0 0.2 0.4 0.6 0.8 1
0 0.2 0.4 0.6 0.8 1
x/L
I/I 0
I 0 I
m I
10
The final equation relates U to the distance a between the current leads and voltage wires.
Applying the equations to the SuperPower® SCS4050 YBCO tape
The surface resistance at the silver-YBCO interface has experimental values between
and .7
For this calculation the worst-case scenario is assumed (longest current transfer length), so the largest value is used. The silver layer directly on top of the YBCO-coating has a thickness of only μ , but there are several other conducting layers in the tape. Again assuming the worst-case t is taken as the total thickness of metal layers in the tape μ . The specific electric resistivity of silver is
.8
Substituting these values in equation [1] yields a current transfer length
.
11
Figure 2.7: Current through the metal casing of the tape causes a potential difference between the two voltage contacts. This voltage is shown as a function of the distance a between current lead and voltage contact for different values of the total current I0.
For a distance the electric field U/L is negligible to the electric field criterion for critical current which is 100 mV/m. From these calculations we do not expect that current through the metal casing will cause problems during the experiments.
The calculations may however be too much of a simplification. The actual tape contains multiple layers of metal but the model only takes one layer into account. These layers have different resistivity and the surfaces between these layers also have resistance. Therefore the actual current distribution may differ from these calculations. More accurate calculations can be achieved using a more complicated multi-layer model.
0 0.2 0.4 0.6 0.8 1
0 1 2 3 4 5 6
Potential difference between voltage contacts for a tape with length L = 40mm
a [mm]
U
[
m
V
]
I0 = 50A
I0 = 100A
I0 = 150A
12
Chapter 3: Experimental aspects
3.1 Setup
3.2 Bennie ten Haken’s press 3.3 Pushing heads
3.4 Electronic equipment
3.5 Force measurement using a strain gauge and calibration 3.6 Measuring procedure
3.7 Analysis of the YBCO layer
3.1 Setup
The press is attached to the far end of a tube; this tube is the housing of the current leads and other wires. The combination of the tube and press is called the insert. As its name reveals, the insert is inserted into the cryostat. The cryostat is filled with liquid nitrogen, cooling the insert down a temperature of 77 Kelvin. The sample holder is attached to the press and connected to the current leads. The sample is soldered to the sample holder.
Furthermore, there is electronic equipment of which most is connected to a PC which collects the data.
Several aspects of the setup will be elaborated on in this chapter.
3.2 Bennie ten Haken’s press
The equipment used during this Bachelor thesis was developed by Bennie ten Hake about 20 years ago. In 1994, Bennie achieved his PhD with his thesis “Strain effects on the critical properties of high-field superconductors”. The thesis is focused on the properties of two types of low temperature superconducting materials: Nb3Sn and the copper-oxide conductors
Bi-2212 and Bi-2223. The critical current of these materials is very sensitive to mechanical deformations. One of the goals was to study the influence of different strain components on the critical properties. The press was used to exert one the of the stress components, compressive stress.9 It can exert forces op to 6 kN.
13
[image:14.612.77.521.102.390.2]A schematic representation of Bennie ten Haken’s press can be seen in the figure below.
Figure 3.1: Bennie ten Haken’s press9
A transverse compressive stress needs to be exerted on the tape while it is submerged in liquid nitrogen. Therefore, the press is designed to control the force on the tape externally.
Rotating a rod on the end of the insert causes the pull axle to move in the upward (-z) direction (arrow direction in figure 3.1), the coupling part has to move along and takes the wedge with it. The wedge is obliquely cut, the same way the lever is cut. Thus by moving upwards, the wedge will push the lever in the sideward (y) direction, which will push the pushing head towards the stainless steel made anvil. As can be seen in figure 3.1, the tape lays between the pushing head and the anvil, thus rotating the rod results in a force being exerted on the tape. The strain gauge is used to measure this force. A calibration is needed in order to calculate the force, there will be elaborated on the calibration in chapter 3.5.
It is important that a pushing head presses perpendicular to the tape. If the pushing head is under a small angle, it could cut into the tape instead of pressing on it. Each pushing head is circularly curved in the inside; so when under a small angle, the pushing head will rotate until the pressing surface is perpendicular to the tape. We tested the perpendicularity of the pushing head by putting strips of lead foil at several positions between the anvil and the original pushing head, and measuring the thickness of each strip after exerting a force on them. No difference in thickness was measured, in both the horizontal and the vertical direction, therefore the pressure
14
was exerted uniformly. However, this test does not guarantee that pressure is also uniformly distributed when it is applied with a smaller surface. See the discussion for more information about this.
3.3 Pushing heads
Initially, there was only one pushing head that had a 19 by14 mm flat surface. This pushing head exerts a pressure of only 79 MPa at the maximum force of the press. According to earlier
research (see section 2.2), this pressure is too low to cause degradation of the critical current. Five pushing heads with smaller areas were designed in order to reach higher pressures; they can be seen in the figures below.
The tape lays parallel to the axis which goes through the two holes of a pushing head. The
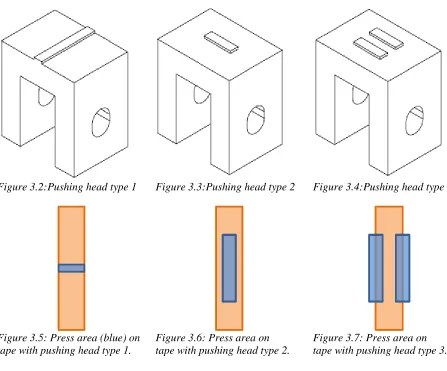
pushing heads are attached to the lever by this axis. All pushing heads have strips on top of them. The different types can push on the tape in different ways. Type 1 can push over the entire width and type 2 and 3 can push over a part of the width of the tape, as can be seen in figures 3.5, 3.6 and 3.7.
Figure 3.2:Pushing head type 1 Figure 3.3:Pushing head type 2 Figure 3.4:Pushing head type 3
Figure 3.5: Press area (blue) on tape with pushing head type 1.
Figure 3.6: Press area on tape with pushing head type 2.
[image:15.612.75.522.239.610.2]15
The first concept of design was type 1, inspired by the work of Tomoaki Takao (section 2.2). Three different versions of type 1 are made. The width of the strip varies among the three versions: 1, 2 and 4 mm. Thus, the pressing area can be varied with these three different pushing heads. A local homogeneous pressure as wide as the strips can be exerted by these pushing heads.
There is only one version made of pushing head type 2. The strip has a width of 2 mm and a length of 6.3 mm, thus less wide than the width of the tape. The press pushes exactly in the middle of the tape, leaving the sides free from pressure.
Type 3 has only one version and does exactly the opposite of type 2. The two strips are 2 mm wide and 6.3 mm long, with a gap of 2 mm in between them. It pushes on the sides of the tape and leaves the space where type 2 pushes free. Pushing heads type 2 and 3 press with equally large areas on the tape.
With all the pushing head types, the change of the IV characteristic of the tape can be examined by varying the pressure on the tape. By comparing the IV characteristics of type 2 and 3, it can be examined if the sides are more or less sensitive to pressure than the rest of the tape.
3.4 Electronic equipment
Besides the press the setup contains some electronic equipment which applies the current and performs measurements. A schematic overview can be seen in figure 3.8 on the next page. The current is produced by two parallel currents sources. Each of the sources can produce a current of 200A, thus the maximum current for this setup is 400A. The current sources are controlled by a Keithley 2700 multimeter which is connected to a computer. The current through the sample is measured using a zero flux current transformer, which is also connected to the Keithley 2700.
For measuring the electric field in the sample, a four-point measurement is used. In this type of measurements the voltage is measured using a pair of wires separate from the current leads. In this way no current flows through the voltage wires and any voltage drop over these wires can be ruled out. This method is more accurate, especially for high currents. The two voltage wires are soldered to the tape with a distance L in between. The voltage is measured by another multimeter which is connected to the computer. Assuming a homogenous resistivity in the tape, the electric field can be calculating by dividing the voltage by the distance L.
16
and in the worst case destroy it. To avoid this, a quench detector is installed that shuts down the current sources if the voltage across the sample exceeds a threshold (1.5 mV).
[image:17.612.79.526.166.359.2]A third multimeter, also a Keithley 2700, measures the resistance of the strain gauge. This is also done using a four point measurement.
Figure 3.8: Electronic equipment used in the setup. Control of the current is shown in brown, measurement of current in orange, measurement of the electric field in green, red lines display the quench protection.
All three Keithley multimeters are connected to a computer program called VI. This program controls the current and collects the measurement data. It is also possible to perform series of measurements automatically.
3.5 Force measurement using a strain gauge and calibration
17
Calibration using weights
[image:18.612.136.464.208.472.2]The easiest way to calibrate the strain gauge is by suspending different weights on the lever and measuring the resistance of the strain gauge. The force on the anvil is calculated using the principle of moments. The results of these measurements can be seen as the red dots in figure 3.9. The slope of the curve comes close to the old calibration (green dots), but the resistance at zero force has markedly changed. A possible explanation for this is that the calibrations were not done at exactly the same room temperatures.
Figure 3.9: Calibration of the press at room temperature. Green and red dots represent measurements done by hanging weights on the lever, blue measurements were performed using a cable tensioner and a suitcase weigher (see next page). In the legend, a stands for the slope of the linear fit.
Unfortunately, it is not possible to use this calibration method in liquid nitrogen, so another method is needed.
350 350.05 350.1 350.15 350.2 350.25 350.3 350.35 350.4 0
500 1000 1500 2000 2500 3000
Resistance []
Fo
rc
e
[
N
]
Press calibration at room temperature
18
Calibration using a cable tensioner and a suitcase weigher
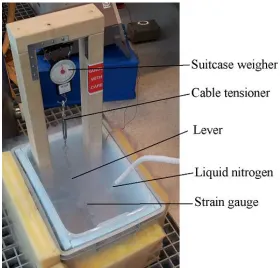
The setup for calibration in liquid nitrogen can be seen in figure 3.10. A force is applied to the lever by a cable tensioner. The magnitude of this force is measured by a suitcase weigher which was also calibrated for extra accuracy. Again, the force on the anvil is calculated using the principle of moments. The whole can be submerged in liquid nitrogen in a plastic bin. At first, this setup was used to calibrate the strain gauge again at room
temperature. The results can be seen in figure 3.9 (blue dots). The slope agrees with the older
calibrations, but the resistance at zero force has again changed for some reason. It seems to be a good idea to determine the force at zero
force right before each experiment, and then use the slope of the calibration to determine the forces.
[image:19.612.257.537.95.363.2]The results for the calibration in liquid nitrogen are shown in figure 3.11. The resistance at zero force and the slope of the curve have changed from room temperature, but there is still a useful relation between resistance and force.
19
Figure 3.11: Calibration of the strain gauge in liquid nitrogen (77K). In the legend, a stands for the slope of the linear fit.
During the experiments, the strain gauge was replaced because the original one was destroyed by accident. Calibration for this new strain gauge was performed in the same way and the new calibration factor is equal to -13272 .
3.6 Measuring procedure
The objective is to identify the pressure dependence of the critical current of YBCO tape. Such a measurement is performed as follows.
Step 1: Applying pressure
Prior to each IV-measurement, a specific pressure is applied to the tape. This is done by rotating the rod till the strain gauge has reached a certain resistance.
Step 2: IV-measurement
Five zero measurements are done to determine the offset of the voltage meter. Then, the current I through the tape is increased stepwise. The potential V between the two voltage taps is measured after each increase in current. It takes some time for the voltmeter to reach equilibrium, it is therefore necessary to set a delay of at least 10 seconds before each measurement. The current
350.36 350.38 350.4 350.42 350.44 350.46 350.48 350.5 350.52 350.54 -200 0 200 400 600 800 1000 1200 1400 1600 1800
Strain gauge resistance []
A n v il fo rc e [ N ]
Press calibration at 77K
20
[image:21.612.155.436.152.382.2]will be increased until the electric field in the tape is beyond the critical electric field, which is 10-4 V/m. Thereafter 10 measurements close to the critical field are performed using a smaller step size. The collected voltage and current data form an IV characteristic from which the critical current can be obtained.
Figure 3.12: Typical IV measurement, critical electric field is defined as Ec = 10-4 V/m.
Although the resistance R of the strain gauge should be constant, it is measured simultaneously to the voltage and averaged for highest accuracy. This step is automated using the computer program VI.
Step 3: Determining critical current
Linear interpolation is used to find the critical current from the collected data. The pressure is calculated from the strain gauge resistance and press surface using calibration data. Eventually, the relative critical current (critical current divided by initial critical current) is plotted against the pressure exerted on the tape. These graphs are called PIc graphs. This step is automated using
a Matlab script.
Measurement program
The series of measurements shown above are performed for all five pushing heads. As
mentioned in section 2.2, transverse stress has different effects when applied to the YBCO-side or the Hastelloy-side. Therefore all measurements are done for both sides of the tape. As in Takao’s experiment (2.2), pressure is increased after each IV measurement and only decreased after the maximum pressure has been reached. This type of measurement, called monotonic loading-mode, does not provide information about reversibility of the critical current. To
101 102
10-7 10-6 10-5 10-4 10-3 Current [A] E le c tr ic f ie ld [ V /m ]
A typical IV curve for an YBCO coated tape
EC = 10-4 V/m
21
investigate reversibility, the pressure should be reduced to zero after each IV measurement (load-unload mode). Unfortunately time did not allow repeating the experiment in load-(load-unload mode.
3.7 Analysis of the YBCO layer
In order to explain the results of the transverse stress experiments, it would be useful to observe the damage done to the YBCO layer. The YBCO layer is however not directly visible because it is covered by layers of silver and copper. This section discusses three methods for the removal of the metal layers and visualizing the YBCO.
Etching
The silver casing can be removed by etching using a solution of 25% hydrogen peroxide, 25% ammonia and 50% water. This solution dissolves the silver but does not damage the YBCO layer. Afterwards the YBCO layer can be examined by optical microscopy or electron microscopy. 10 It is unsure if this method also works for wires that have an additional copper layer. Normally copper is etched using nitric acid, but this method is not useful because it also destroys the YBCO layer. A similar hydrogen peroxide-ammonia solution was already present in the EMS lab so an attempt was made to reveal the YBCO layer. About 1 cm of YBCO tape was submerged in 50 ml of the solution for 10 hours and every 30 minutes a picture was made. Successful etching would result in the appearance of a shiny black YBCO layer. Unfortunately, this was not observed. The pictures of the etching process can be seen in Appendix 7.1.
Casting in epoxy
Another method is embedding the tape in epoxy, a hard plastic, and then creating a cross-section of the sample by carefully sanding. The advantage of this method is that cross-sections can be made in different planes and the YBCO layer can be viewed from different directions. This method however requires a lot of time and expertise and has therefore not been used.
Delamination
22
Chapter 4: Results
4.1 Pushing head type 1 4.2 Pushing head type 2 and 3
4.3 Damage observations using microscope
4.1 Pushing head type 1
The first set of measurements was done with the three versions of pushing head type 1, starting with the 4 mm, then the 2 mm and at last the 1mm version. PIc graphs are shown in the figures
[image:23.612.165.442.256.479.2]below.
Figure 4.1: Pressure dependence of the critical current, 4 mm pushing head type 1.
0 50 100 150 200 250
0 0.2 0.4 0.6 0.8 1
Pressure on the tape [MPa] IC
/I0
Pressure dependence of I
C, 4mm pushing head
YBCO side up Hastelloy side up
23
Figure 4.2: Pressure dependence of the critical current, 2 mm pushing head type 1.
Figure 4.3: Pressure dependence of the critical current, 1 mm pushing head type 1.
Each PIc graph shows three series of measurements, a series for the YBCO-side and two series
for the Hastelloy-side.
Initially, only a single series of measurements was carried out on each side (blue and red). As can be seen, all the red graphs of the Hastelloy-side remain below that of the YBCO-side except
0 100 200 300 400 500
0 0.2 0.4 0.6 0.8 1
Pressure on the tape [MPa] IC
/I0
Pressure dependence of IC, 2mm pushing head
YBCO side up Hastelloy side up
Hastelloy side up (repeated)
0 200 400 600 800 1000
0 0.2 0.4 0.6 0.8 1
Pressure on the tape [MPa] IC
/I0
Pressure dependence of IC, 1mm pushing head
YBCO side up Hastelloy side up
[image:24.612.164.436.357.581.2]24
for the one with the 1 mm pushing head. This strange series of measurements was a reason to repeat the measurement for the Hastelloy-side. A second reason for repeating these
measurements was to test the reproducibility of the measurements. This repetition resulted in the green graphs.
Unfortunately, the repetition on the Hastelloy-side differs from the earlier measurements, which means that the experiment did not reproduce entirely (see chapter 5 for discussion). However, the graphs provide sufficient information to draw a few conclusions.
For the 2 mm and 1 mm pushing heads, our results agree with Takao’s results up to the
maximum pressures his setup was capable of (see figures 2.3 and 2.4). It is not possible to make a comparison for higher pressures.
The point at which the first damage has been done is defined as the pressure that decreases the current by 5%. Approximate values of these criterion pressures are shown in the table below. Pushing head 1 mm (Area: 4 mm2) 2 mm (Area: 8 mm2) 4 mm (Area: 16 mm2)
YBCO-side 341 MPa > 518 MPa > 241 MPa
Hastelloy-side 113 MPa 320 MPa 179 MPa
[image:25.612.67.555.328.396.2]Hastelloy-side (repeated) 147 MPa 251 MPa 159 MPa
Table 4.4: Pressure criterion at which the critical current is decreased by 5%.
It shows that this criterion point is for each pushing head much higher for the YBCO-side than for the Hastelloy-side. So, it can be concluded that the YBCO-side can withstand higher pressures than the Hastelloy-side. This confirms the earlier findings by Tomoaki Takao and others.
A criterion pressure for the YBCO-side can only be found using the 1 mm pushing head. The strips of the other two pushing heads have a too large area to reach a pressure high enough to degrade the critical current. So, the area dependence of the pressure criterion for the YBCO-side cannot be found from this data.
For the Hastelloy-side, a pressure criterion is found with each pushing head. It seems that with increasing strip area, the pressure criterion first increases and then decreases again. This applies for both the first series of measurements and the repetition. An explanation could be that with the smallest area there is a bigger chance of damaging because it cuts more like knife than the other strips, and with the largest area the chance of damaging is bigger due to the larger area.
25
4.2 Pushing head types 2 and 3
[image:26.612.142.419.156.384.2]The second set of measurements was done with pushing heads type 2 and 3. The resulting PIc graphs can be seen in the figures below.
Figure 4.5: Pressure dependence of critical current with pushing heads types 2 and 3, pushing on the Hastelloy-side.
Figure 4.6: Pressure dependence of critical current with pushing heads type 2 and 3, pushing on the YBCO-side.
0 50 100 150 200 250 300 350 400 450 0
0.2 0.4 0.6 0.8 1
Pressure on the tape [MPa] IC
/I0
Pressure dependence of IC, both sides and center, Hastelloy side
Sides Center
0 50 100 150 200 250 300 350 400
0 0.2 0.4 0.6 0.8 1
Pressure on the tape [MPa] IC
/I0
Pressure dependence of IC, both sides and center, YBCO side
[image:26.612.142.413.446.666.2]26
The graph in figure 4.5 shows the result from experiments 1 and 2. It shows that for pressures up to 450 MPa the critical current only degrades when pressing on the center of the tape. So, it can be concluded that the tape is more easily damaged when applying a pressure on the center of the Hastelloy-side. This can be explained using Takao’s argumentation (section 2.2): Stretching of the YBCO layer causes more degradation than compression. Pressing in the center on the Hastelloy-side bends the YBCO layer in a convex shape, stretching it. Because the sides of the tape are free to move, there is nothing to prevent this deformation. This causes the critical current to degrade at even lower pressures than in experiments using pushing head type 1. On the other hand, pressure applied on the sides prevents this deformation of the tape. Therefore degradation is lower in this case.
Figure 4.6 shows the results of experiments 3 and 4. Both PIc graphs show only little
degradation. This was expected, because the YBCO layer does not stretch much when pressing on the coated side. As these measurements were only done once, there is therefore too little information to draw a solid conclusion on the effect of press location on the YBCO-side.
A comparison can be made between the experiments 2 and 4, both experiments in which pressure is applied only to the center of the tape. It can again be seen that the YBCO-side is stronger than the Hastelloy-side, since the critical current starts to degrade at a much higher pressure. This is again consistent with Takao’s argumentation: pressing the Hastelloy-side causes more
degradation because the YBCO layer is being stretched.
Finally, both experiments for the sides of the tape, experiments 1 and 3, can be compared. These graphs also show little degradation of the critical current. This was to be expected because in these experiments, not much stretching of the YBCO layer occurs as pressure on the sides prevents deformation.
As in the experiments with pushing head 1, all degradation was irreversible.
Experiments conducted Side of the tape Location pressed
1 Hastelloy Sides
2 Hastelloy Center
3 YBCO Sides
[image:27.612.125.486.81.160.2]4 YBCO Center
27
4.3 Damage observations using microscope
[image:28.612.309.517.139.682.2]The samples were delaminated using the method described in section 3.7. Afterwards, several photographs were made. The pictures can be seen in the figures below.
[image:28.612.73.282.149.497.2]Figure 4.8: Left border of stress area (~3.2x zoom)
[image:28.612.314.521.150.312.2]Figure 4.9: Left border of stress area (~32x zoom)
Figure 4.10: Center of stress area (~3.2x zoom)
Figure 4.11: Center of stress area (~32x zoom)
Figure 4.12: Right border of stress area (~3.2x zoom)
[image:28.612.74.280.482.671.2]28
Figure 4.14: Outside stress area (~3.2x zoom) Figure 4.15: Outside stress area (~32x zoom)
The examined sample was damaged by pushing head type 1, with the 1 mm wide strip. All pictures on the right are zoomed versions of the ones on the left. The zoomed area is marked with a red rectangle. The borders of the stress area are marked with the red arrows in figure 4.8.
An image of unused YBCO tape can be seen in figure 4.16. This image is used to make a comparison with the damaged tape.
[image:29.612.72.284.72.228.2] [image:29.612.75.281.323.459.2]29
expected to cause less degradation of the critical current. The results of these experiments can be seen in figure 4.17.
[image:30.612.118.481.127.427.2]The modified pushing head caused slightly more degradation of critical current than the original pushing head. This result does not agree with our expectations. Microscopic images showed the same pattern of damage as the original experiment. The 90 degree corners are therefore not the main cause of critical current degradation.
Figure 4.17: Pressure dependence of critical current for 2 mm pushing head, both the original experiment and repeated experiment with modified pushing head
0 100 200 300 400 500 600
0 0.2 0.4 0.6 0.8 1
Pressure on the tape [MPa]
I C
/I 0
Pressure dependence of IC, 2mm pushing head
30
Chapter 5: Discussion
The conditions of our experiment do not resemble those inside a nuclear fusion reactor:
For instance, the wires in a magnet are exposed to several kinds of stress at the same time (tensile stress, compressive stress, bending, torsion etc.). In our experiment only one type of stress is applied.
Secondly, the measurements were done in zero external magnetic field. Because
superconductive properties are dependent on magnetic field, it would be useful to repeat the measurements in magnetic conditions which come closer to those in a fusion reactor.
For the production of magnets, much higher currents are needed than a single tape can conduct. To achieve this, multiple tapes will be combined into bigger wires such as helical twisted wires, stacked wires or Roebel cables.11 In these wires, the tapes are subjected to a complicated pattern of forces. Doing calculations on these forces is behind the scope of this assignment and moreover the press is not suited for measurements on wires composed of multiple tapes. We think however that results of simple experiments like ours (e.g. stronger YBCO-side under transverse stress) can be useful when designing composed wires.
Our experiments were done on short samples (44 mm), and stress was applied over only a few millimeters of the sample. In practice, wires are much longer. As stress on larger surfaces might cause more degradation of the critical current, it is unsure if results for short samples are applicable to longer wires.
Magnets in fusion reactors must work reliable for many years, so is it critical to apply stress for longer time and conduct cyclic measurements in order to determine the
maximum stress at which no irreversible damage arises. Unfortunately, the press we used can only be operated manually, so cyclic measurements would take too much time. The repeated measurements show that the experiment is not entirely reproducible. There are several possible explanations:
The tape is not homogeneous, different samples have different properties.
31
surface of the sample. If this did not happen due to friction, the force would be distributed unevenly across the surface causing a higher maximum pressure. This problem is even worsened by the fact that the strips have 90 degree corners. The press was originally designed for large 19 mm pushing heads, for which we confirmed the pressure
distribution is homogeneous (see section 3.2). However, this test does not guarantee that pressure is also uniformly distributed when it is applied with a smaller surface.
A possible solution is changing the number of degrees of freedom in which the pushing head can move. For example, a non-rotatable pushing head which is fixed in exactly the right angle could solve this problem. Another solution is to add a second degree of freedom. Such a pushing head could rotate in two different directions, thus it would align with the surface in two dimensions instead of one. We think that adding a second degree of freedom works best for larger areas and removing one for smaller areas. It is however impossible to apply one of these modifications to Bennie ten Haken’s press.
32
Chapter 6: Conclusion
The critical current degrades at lower pressures when the pushing head pushes on the non-coated side of the Hastelloy substrate. This is true for pushing heads type 1 and 2 and it confirms the findings of Tomoaki Takao.
On the non-coated side of the tape, pressing in the center causes more degradation of critical current the pressing on the sides. No such difference was found for the YBCO-coated side.
33
Chapter 7: Appendix
7.1 Etching pictures
A piece of YBCO tape with YBCO-side up was submerged in a mixture of water, ammonia and hydrogen peroxide in concentration ratio 1:1:1. A picture was made every 30 minutes.
Time [h] Time [h]
0.0 5.0
0.5 5.5
1.0 6.0
1.5 6.5
2.0 7.0
2.5 7.5
3.0 8.0
3.5 8.5
4.0 9.0
34 10.0
35
8: References
1
Michel Cyrot and Davor Pavuna, Introduction to superconductivity and High-Tc materials, World
scientific publishing Co. Pte. Ltd., Singapore (1992)
2
SuperPower Inc., SuperPower®2G HTS Wire Specifications
3
T. Takao, T. Iwamura, Y. Fukasawa, S.Minowa, H.Sato, T. Asano, A. Ishiyama, J. Kato T.Machi, K. Nakao, and Y. Shiohara, Influence of bending and torsion strains on critical currents in YBCO-coated
conductors, IEEE Transactions on Applied Superconductivity, Vol. 17 No. 2, June 2007, 3513-3516
4
Tomoaki Takao, Sho Koizuka, Kazuki Oi, Atsushi Ishiyama, Junko Kato, Takato Machi, Koichi Nakao, and Yu Shiohara, Characteristics of Compressive Strain and Superconducting Property in YBCO-coated
Conductor, IEEE transactions on applied superconductivity, Vol. 17, No. 2, June 2007, 3517-3519
5
N. Cheggour, J.W. Ekin, C.C. Clickner, D.T. Verebelyi, C.L.H. Thieme, R. Feenstra, A. Goyal, and M. Paranthaman, Transverse Compressive Stress Effect in Y-Ba-Cu-O Coating on Biaxially Textured Ni and
Ni-W Substrates, IEEE transactions on applied superconductivity, Vol. 13, No. 2, June 2003, 3530-3533
6
T. Holúbek, M. Dhallé and P. Kováč, Current transfer in MgB2 wires with different sheath materials,
Superconductor Science and Technology, 2007, vol. 20, 123-128
7
M. Polak, P.N. Barnes and G.A. Levin, YBCO/Ag boundary resistivity in YBCO tapes with metallic
substrates, Superconductor Science and Technology, 2006, vol. 19, 817-820
8
W.M. Haynes, CRC Handbook of Chemistry and Physics, 92nd edition, CRC Press/Taylor and Francis, Boca Raton, USA (2012)
9
Bennie ten Haken, Strain effects on the critical properties of high-field superconductors, Eerste uitgave, Universiteitsdrukkerij, Enschede (1994)
10
J.W. Ekin, S.L. Bray, N. Cheggour, C.C. Clickner, S.R. Foltyn, P.N. Arendt, A.A. Polyanskii, D.C. Larbalestier and C. N. McCowan, Transverse Stress and Fatigue Effects in Y-Ba-Cu-O Coated IBAD Tapes, IEEE transactions on applied superconductivity, Vol. 11, No. 1, March 2001, 3389-3392
11
Karlsruher Institut für Technologie, EFDA, Evaluation of the Status and Prospects of High