THE TRANSVERSE ~EEMAN EFFECT
IN
A thesis
submitted for the Degree
of
Doctor of Philosophy in Physics
in the
University of Canterbury
by
University of Canterbury
1 312 1 912
the transverse Zeeman s1 e 1n Ca ' t . F 3
+
6 0 1 2:Er , at . tes a and 2 K. The dye laser beam is tuned to thezi
transition at 18555.6 em
I thank
Professors A.G. McLellan
and B.G Wybourne
for
their interest throughout this project, and for making available
a Teaching Fellowship position.
I am particularly grateful to my supervisors Dr Glynn Jones
and Dr Rod Syme for their guidance and encouragement.
I would also like to thank,
- Dr John Campbell
for
his
interest,
and his late
night or early morning visits to the Laboratory during
the long experimental runs.
- Professor L.F. Phillips of the Chemistry Department
for
supplying
the
Rhodamine 6G
dye,
and
for
transferring
the Coumarin 6 dye
additive
(Cyclo-octatetraene) into a syringe.
- Dr W.T. Robinson of the Chemistry Department for
checking the orientation of a CaF 2 :Nd crystal using
X-rays.
My fellow
research students,
Robin Kennedy,
Hau
Kuok,
Stephen Payne, Mike Reid and Chris Tomblin for
many discussions.
I particularly thank Chris Tomblin
for giving his time freely to help with the changing
dyes in the dye laser.
- Graham Freeth and Mrs. M. Naguleswaren of the Computer Science Department for maintaining the Word Processing Program FMT, by which the text of this thesis was produced.
- My wife Thelma, for preparing and editing much of the text for FMT.
- The University Computer Center staff for their co-operation.
- Mrs. Van Der Borch for assistance in the preparation of some of the diagrams.
- Janet Warburton for typing the formulae, Greek symbols, figure and table captions, references, and tables of contents.·
A detailed investigation has been made of the transverse
Zeeman effect for erbium ions at tetragonal
c
4v sites in CaF2crystals. Selective laser excitation of fluorescence from the
transverse Zeeman site using a dye laser beam enabled this site
to be distinguished from two other magnetically nonequivalent
sites in these crystals. Large intensity and energy variations
observed for some transverse Zeeman transitions as the crystal
was rotated in the magnetic field, were accounted for by a
switching of the symmetry labels and by magnetic field mixing
between levels. The
c
4v irrep designations of the crystal-field
levels were identified by studying the intensity variations, and
crystal and magnetic field energy calculations successfully
accounted for the energies of the transverse Zeeman levels. In
certain cases, the transverse Zeeman effect was analysed in the
more complex absorption spectra.
Previous undetected
c
4v crystal-field energy levels in3+
CaF2:Er have been located using selective laser excitation
spectroscopy, and a few assignments of levels to the
c
4v site byearlier workers, were found to be incorrect.
Conventional optical absorption and fluorescence
measurements have been made on . Nd 3+ ions in CaF2 and SrF2
crystals, and infrared and infrared-Zeeman absorption spectra
examined for ce3+ and Nd3+ ions in both types of crystalline
hosts.
Crystal-field analyses have been carried out lor most
CHAPTER 1 INTRODUCTION 1.1 Introduction
1.2 Rare Earths in Crystalline Hosts
1.3 Structure of the Alkaline~Earth Fluorides 1.4 Trivalent Rare-Earth Charge Compensation in
CHAPTER 2 THEORY
2.1 Crystal-Field Theory
2.2 Theory of the Transverse Zeeman Effect
CHAPTER 3 3.1 3.2
EXPERIMENTAL Crystals
3+
Optical Spectroscopy of CaF 2:Er
1
5
5
6
9
14
21 23
3.2.1 Instrumentation 23
3.2.2 Absorption Experiments 24
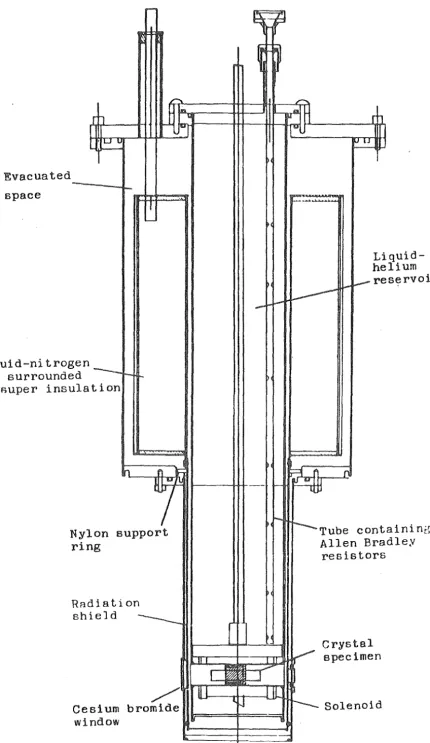
3.2.3 Laser Selected Fluorescence Experiments 26 3.2.4 Superconducting Magnet and Dewar
3.3 Optical Spectroscopy of MeF 2:Nd
3
+
3.3.1 Instrumentation 3.3.2 Optical Spectra
3.3.3 Low Temperature Dewar 3.4 Infrared Measurements
3.4.1 Instrumentation
3.4.2 Superconducting Magnet and Dewar
28
30
30
CHAPTER 4 TRANSVERSE ZEEMAN EFFECT IN CALCIUM FLUORIDE CRYSTALS CONTAINING TRIVALENT ERBIUM
4.1 Introduction
PART I
4.3
PART II
4.4 4.5
POLARISATION AND SELECTION RULES 4.2.1 Tetragonal
c
4V Symmetry
4.2.2 Zeeman Effect for the Magnetic Field Along the Z Axis
4.2.3 Zeeman Effect for the Magnetic Field Perpendicular to the Z Axis
3+
Magnetically Nonequivalent Si·tes in CaF 2: RE
3+
ABSORPTION SPECTRA OF CaF2:Er AND THE TRANSVERSE·ZEEMAN EFFECT
Introduction
4 4
The
z
1(r
1512) ~ L1( G1112) Absorption Spectra 4.5.1 Magnetic Field Parallel to the [100]
Crystal Axis
37
39
41
42
44
51 52
52 4.5.2 Magnetic Field Parallel to the [110] 54
Crystal Axis
4.5.3 Transverse Zeeman Effect for
4 4
Zl( Il5/2 ~ Ll( Gll/2) 58
4.6 The
z
1( I4
4
.
1512> ~ D2( F912> Absorption Spectra 64
4.6.1 Magnetic Field Parallel to the [100]
Axis 64
4.6.2 Magnetic Field Parallel to the [110]
Rotational Zeeman Spectra
PART III FLUORESCENCE SPECTRA OF CaF
2:Er
3+ AND THE
TRANSVERSE ZEEMAN EFFECT
4.8 Introduction
4.9 Laser Selected Fluorescence Spectra for the
'Tetragonal Site in a Calcium Fluoride Crystal
4.10
Containing Trivalent Erbium Ions
4.9.1 Fluorescence from the Tetragonal
4
n
1( F912> Energy Level
4.9.2 Fluorescence from the Tetragonal
4 E1(
s
312) Energy Level
3+ Crystal-Field Analysis of the CaF
2:Er
Tetragonal Site
4.10.1 Introduction
4.10.2 Intermediate Coupling for Er3
+
inCaF 2
4.10.3 Crystal-field Calculations
4.10.4 4
r
Crystal-Field Parameters4.10.5 Higher Energy Multiplets
4.11 Laser Selected Zeeman Fluorescence
4.12
Spectroscopy
3+ Sll Zeeman Site Fluorescence in CaF
2:Er 4.12.1 Energy Level Scheme
4.12.2 Sll Zeeman Site Fluorescence from the
4 F
912
n
1 Level72
83
85
85
89
100
102
106
106
108
111 113 113
4.13
4.12.3 Sll Zeeman Fluorescence from the
4 L
s
312 E1 Level 4.12.4 Summary of thes
11 splitting Values
4
s
1 Zeeman fluorescence from the F9/ 2 D1 Level
4.14
s
3 Site Rotational Zeeman Spectra and the Transverse Zeeman .Effect
4.15 The
s
3 Site with the Magnetic Field along the [110] Axis
4.16 Transverse Zeeman Analysis
4.17 Intensity Variations in the Spectra of the
s
1 ands
3 Sites
4.17.1 Intensity Variations in the Transverse Zeeman Spectra Caused by Magnetic
Field Mixing of Levels
4.17.2 Intensity Dif rences Between Spectra
Recorded When Exciting the
o
1 and
o
2 Leve4.17.3 Intensity Differences in the
s
1 Spectra when Pumping theo
2 Level4.17.4 Summary of Intensity Variations
4.18 Transverse Zeeman Fluorescence for the E
1 7 Z Transitions 4.19 Summary of the
s
1 ands
3[110] Magnetic Splitting Values
4.20 Rotational Zeeman Spectra for the
s
1 and
s
2 Zeeman Sites4.21 Summary
PART I
5.1 5.2 5.3 5.4
OPTICAL SPECTRA OF CALCIUM AND STRONTIUM FLUORIDE CRYSTALS CONTAINING NEODYMIUM Introduction
3+ Optical Spectra of CaF2:Nd
Lifetime Measurements in CaF2:Nd Optical Spectra of SrF2:Nd3+
5.5 Luminescence and Absorption Results of Other
PART II
5.6 5.7 5.8 5.9
PART III 5.10 5.11
CHAPTER 6
Workers
INFRARED SPECTRA OF CALCIUM AND STRONTIUM FLUORIDE CRYSTALS CONTAINING NEODYMIUM Infrared Absorption Experiments
Infrared Zeeman Experiments
Infrared Zeeman Results for CaF2:Nd Infrared Zeeman results for SrF2:Nd 3+
PARMETERISATION OF THE CRYSTAL FIELD Crystal-Field Analysis of CaF 2 :Nd
3+ Crystal-Field Analysis of SrF
2:Nd
INFRARED SPECTRA AND CRYSTAL-FIELD ANALYSIS OF ce3
+
IONS IN CaF2 AND SrF2 CRYSTALS6.1 Introduction
6.2 Infrared Absorption Results 6.3 Crystal-Field Analysis of CaF
6.4 Infrared Zeeman Results
CHAPTER 7 CONCLUSIONS
APPENDIX I INTERMEDIATE COUPLING FOR Nd3+ and Er3+
IONS IN LaF 3
APPENDIX II INTENSITY CALCULATIONS
REFERENCES
249
257
260
264
TABLE PAGE 2.1 Electric dipole selection rules for the
c
2 and Cs point groups
3.1 Resolution of the Jarrell-Ash double monochromator measured at various slitwidths using the 3131
A
Hg doublet4.1 Selection rules for the
c
4v group 4.2 Polarisation selection rules for the
c
4 group 4.3 Polarisation selection rules for the C group
s
· 4.4 A summary of the zero-field polarisation selection rules for the tetragonal
c
4V site, when the magnetic field is in the tranverse plane along a Cs axis of symmetry
4.5 Peak absorption energies, linewidths and absorption coefficients of the
zi
+ L1 Zeeman
transitions measured in the B 1 k spectrum (at 2 K) in CaF
2:Er
3+ crystals at a magnetic field strength
20
23
40
42
43
49
of 6.0 tesla along the [100] axis. 54
4.6 Peak absorption energies, linewidths and
absorption coefficients of the
zi
+ L1 Zeeman transitions measured in the B 1 k spectrum at 2 K in CaF2:Er
3+ crystals at a magnetic field
4.7 Energies of the CaF 2:Er
3+ L
zl + Ll spectral lines
measured in the B
II
-
k spectra at a magnetic field strength of 6.0 tesla in the (001) planeat a temperature of 2 K
4.8 Peak absorption energies, linewidths and
absorption coefficients in the ~ 1 ~ spectrum
(at 2 K) for the z
1 + D2 Zeeman transitions recorded at a magnetic field strength of 6.0
tesla
4.9 Energies (at 2 K) and Zeeman site assignments
3+ L
of the CaF
2:Er
z
1 +o
2 tetragonal absorption lines measured at a magnetic field strength of6.0 tesla in the {001) plane
4.10 Fluorescence energies and linewidths of the
4
tetragonal
o
1 +
r
1512 transitions measuredat 2 K for CaF 2:Er
3+
3+ 4 4
4.11 CaF
2:Er
z
1(r
1512) + F912 tetragonal transition energies obtained by laser excitation spectroscopyat 2 K
4.12 Energies, 1inewidths and relative intensities of
4 3+
the
c
4V E1 + IlS/2 transitions in CaF 2 :Er at 2 K
4.13 Energies, linewidths and relative intensities
4 3+
of the
c
4V E1 +
r
1312 transitions in CaF2:Er at 2 K61
70
76
88
89
94
4.15
field energy levels obtained for the CaF 2:Er
3+
crystal at 2 K
4 3+
F
912 crystal-field energy levels for CaF2:Er ,
99
calculated with and without intermediate coupling 101
4.16 4.17 4.18 4 .19 4.20 3+ Barycentre energies of CaF
2:Er compared with
those for LaF 2:Er
3+
Calculated and experimental 11
free ion11
energies 3+
for the CaF2:Er multiplets
Energies and eigenvectors for the intermediate 3+
coupled states of Er in CaF2
Energy levels and
{c4V) 41 manifold
3+ g-values for the CaF2:Er
3+
Energy levels for the CaF2:Er
c
4V multiplets4.21 Energies, linewidths and relative intensities of
h E 3+ t l ' t L(4 ) 4
t e CaF
2: r te ragona s~ e
o
1 F912 +r
1512 81! Zeeman fluorescence transitions recorded at6.0 tesla and 2 K
4.22 Energies, linewidths and relative intensities of
3+ l . L ( 4 ) 41
the CaF
2:Er tetragona s~te E1
s
312 + 15; 2103 104 105 107 109 116
8ll
Zeeman transitions recorded at 6.0 tesla and 2 K 1264.23 Measured and calculated 8
11 Zeeman site energy
4.24 Energies, linewidths, and relative intensities for the
n
1 ~
z
1,z
2,z
3 transitions of thes
1 site in3+
CaF
2:Er , measured at various magnetic field strengths
4.25 Energies, linewidths, and relative intensities for the
n
1 ~
z
1,z
2,z
3 transitions of thes
3[Il0] site in CaF2:Er 3+,
measured at various magnetic field strengths and high resolution
4.26 Energies, linewidths and relative intensitiGs for the E
1 ~
z
1,z
2,z
3 transverse Zeeman transitions, measured at 6.0 tesla and 2 K from the high resolution (0.5 cm-1) B II k spectra4.27 Summary of the
s
1 ands
3[110] splitting values at 6.0 tesla and 2 K
4.28 Transition energies of the
s
1 ands
2 sites at 2 K and 6.0 tesla
5.1 Peak absorption energies (cm-1) measured at 80 K
1 3+
in the 4000 em- infrared region in CaF 2 :Nd (0.1%)
5.2 Splitting values of the
c
4v r
4 1112 levels in CaF2:Nd at 3.0 tesla.
5.3 Splitting values (at 3.0 tesla) for the 4
r
1i;
2 Y2 and Y3 levels in CaF2:Nd; with and without intermediate coupling
144
160
191
195
200
225
230
5.5
5.6
912
energies (at 15 K) in SrF2:Nd(0.05%) for
B II <111> crystal direction
3+ Energy levels and g-values for the CaF
2:Nd
4
4
(c
4
v>
r
1112 andr
912 multip1ets3+ Energy levels and g-va1ues for the SrF2:Nd (c
4
v>
4
r
41112 and
r
912 multip1ets6.1 Energies, linewidths and relative intensities (at 15 K) of the 2F
512 + 2
F
712 c4V absorption transitions in CaF
2 and SrF2 crystals containing C e 3+ . 1ons
6.2 Energies (cm-1) of infrared absorption transitions 3+
(at 80 K) in CaF2:ce which are not related to the . c 4V site
6.3 Summary of the crystal-field parameters for rare-earth ions in CaF2
6.4 Energies (em -1 ) of the two lower 2 F 2 512 + F712 c
4V absorption transitions (at 15 K) in SrF2:ce 3+ (0.05%) crystals, at various magnetic field strengths
(J;! II <111> crystal direction)
232
234
237
243
243
248
FIGURE PAGE 1.1 Structure of the alkaline-earth fluorides 6
1.2 Model of the
c4v
symmetry site 82.1 A summary of the transverse Zeeman effect for
ions in sites of
c4v
symmetry 193.1 Block diagram of the experimental apparatus for
the laser selected Zeeman fluorescence experiments 27
3.2 Dewar and crystal holder used for optical Zeeman
spectroscopy 29
3.3 Sketch of the rotating drum discriminator 32
3.4 Infrared Zeeman superconducting magnet dewar 35
<'
4.1 Energy level diagram for the tetragonal
z
1 + L1 3+
Zeeman transitions in CaF2:Er 53
4.2 B 1
~
absorption spectra (at 2 K} of thezi
+ L1
3+
transitions in CaF2:Er at 6.0 tesla 55
4.3 B
II
~polarisation absorption spectra (at 2 K} ofL 3+
the
z
1 + L1 transitions in CaF2:Er at a
magnetic field strength of 5.0 tesla along the
[110 1 axis 57
4.4 CaF 3+ L
2:Er tetragonal
z
1 + L1 BII
k rotational1 2
3+
Zeeman transitions in CaF 2:Er
4.6 ~ 1 ~ and ~
II
~ spectra (at 2 K) for thez
L 1 +o
2
3+
Zeeman absorption transitions in CaF2:Er recorded at a magnetic field strength of 6.0 tesla parallel to the [100] and [110] axes
4. 7 Unpolarised and circularly polarised ~
II
~ spectra L(at 2 K) for the
z
1 + D2 Zeeman absorption tran-sitions recorded with a magnetic field (of
6.0 tesla) parallel to the [lOO]axis
4.8 Crystal alignment (in the (001) plane) using the
Z~
+o
2 Zeeman transitions in the B 1 k spectrum at 2 K and 6.0 tesla
4.9 CaF 3+ L
2:Er tetragonal
z
1 + D2 rotational Zeeman65
66
67
71
(B
II
~) spectra, recorded at 6. 0 tesla and 2 K 7 33+ L
4.10 CaF
2 :Er tetragonal
z
1 +o
2 ~ 1 k rotationalZeeman spectra recorded at 6.0 tesla and 2 K 75
4.11 Energy level diagram for the tetragonal
z
1 + El3+
Zeeman transitions in CaF2:Er 78
4.12 Absorption spectra (at 2 K) of the
z
L 1 + E1c
4V transitions in CaF
2:Er
3+ at a magnetic field strength of 6.0 tesla along the [lOO]axis
L 4.13 Tetragonal
z
1 + E1 ~ 1 ~ absorption spectra (at 2 K) recorded at various magnetic field strengths along the [100] axis
79
4.14
4.15
4.16
L
Absorption spectra (at 2 K) of the z
1 + E1
t t e ragona 1 t rans1 1ons 1n ' t ' ' C F a 2: r E 3+ at a magnet1c · field strength of 6.0 tesla along the [110]
crystal axis
4
o
1 +r
1512 fluorescence (at 2 K) for the
c
4V site in CaF2:Er 3+
(a) El + 4 115/2 fluorescence spectrum (at 2 K)
for the
c
4V site in CaF2:Er 3+
recorded when
'
pumping zl + El at 18628.6 em -1 with the dye
laser beam
(b) Fluorescence spectrum (at 2 K) for the C site in CaF
2:Er 3+,
recorded when pumping the transition at 18626.0 cm-l
82
87
91
91
4.17 Absorption spectra recorded at 2 K, showing the
4.18
4.19
overlapping of the
c
4V (z1 + E1 ) and C siteab-3+
sorption lines in CaF 2 : Er 9 2
El + 4 115/2 tetragonal fluorescence spectrum
(at 2 K) for CaF 2:Er
3+ 95
4
El + 113/2 tetragonal fluorescence spectrum
(at 2 K) for CaF2:Er 3+ 97
4.20 Energy level diagram (at 2 K and 6.0 tesla) for the
4.22
1512
and 6. 0 tesla) for the
s
11 site in CaF 2 :Er
3+
L 4 D
1 -+
r
1512 ~ 1 ~ fluorescence spectrum (at 3+2 K and 6.0 tesla) for the
s
11 site in CaF2:Er
4.23 Polarised
oi-+
4r
1512 (Z1
,z
2,z
3) fluores?encespectra recorded at 6.0 tesla and 2 K for the
3+
Sll site in CaF 2 :Er
116
117
120
4.24 B 1 ~fluorescence spectrum (at 2 K and 6.0 tesla)
3+
for the unidentified site in CaF
2:Er 122
4.25 (a) EL 4 B 1 k fluorescence spectrum (at
1
-+
115/22 K and 6.0 tesla) for the
s
11 site
. 3+
1n CaF
2:Er
(b) EL 4 B II k fluoresence spectrum
1
-+
115/2(at 2 K and 6. 0 tesla) for the
s
11 site in
3+
CaF2:Er
4.26 Parallel splitting values of the CaF2:Er3+
4
r
1512
(z
1,z
2,z
3) levels as a function of the4.27
magnetic field strength
Dl
-+
4 115/2 B 1 k fluorescence-at 2 K and 6.0 tesla)
CaF 2:Er
3+
.
Dye laser-1
15 4 2 7 . 7 + 1. 0 em
for the
pumping
spectrum (recorded
s1 site in
ZL
-+
1 DL 2 at
4.28
o
1 -+
4
r
1512 B II ~fluorescence spectra (at 2 K)
for the
s
1 site recorded at 4.0 and 6.0 tesla
124
125
128
131
4.29
4.30
4 D
1 +
r
1512 fluorescence spectra (at 2 K and 6.0 tesla) for thes
1 site in CaF2:Er
3+. Dye
laser pumping
z~
+o
1 at 15406.2 cm-l
4 -1
D1 + 1
1512 high resolution (0.4 em ) B l k
3+ spectrum f. or the S 1 site in CaF
2 : Er , measured at 2 K and 6.0 tesla. Dye laser pumping ·
134
z~
+D~
at 15428 cm-l 1364.31 4.32 4.33 4.34 4 D
1 +
r
1512 polarisation spectra recorded for the3+
s
1 ands
3[110] sites in CaF2:Er at 2 K and
5.0 tesla
4
Magnetic energy variations of the
r
1512
<z
1,z
2,z
3)s
1 site levels in ~aF2
:Er 3+3+ Perpendicular splitting values of the CaF
2:Er
4
r
1512
<z
1,z
2,z
3) levels as a function of the magnetic field strength+ 41 high resolution -1 B l k
Dl 15/2 (0.5 em }
-
-spectra (at 2 K) for the sl (C~ symmetry) and
83[110]
( c"
s symmetry) sites 1n CaF. 3+2:Er at
various magnetic field strengths
4.35 D
1 +
4
r
1512 high resolution (0.5 cm-1
) _!!II
~
spectra (at 2 K) at various magnetic field 3+
strengths, for CaF2:Er
137
138
139
140
4.37
4.38
4.39
4.40
and 8
3[110] sites in CaF2:Er
3+, recorded at various magnetic field strengths and low resolution
("' 2 em -l)
4
D1 +
r
1512 (Z1
,z
2,z
3) ~II ~rotational Zeeman3+ .
spectra for CaF2:Er recorded at 2 K and 6.0 tesla when exciting the
zi
+D~
83 site transition with a a-polarised dye laser
4
D
1 +
r
1512(z
1,z
2,z
3) B 1 k rotational Zeeman 3+spectra for CaF
2:Er , recorded at 2 K and 6.0 tesla (in the (001) plane) when exciting the
L L
z
1 + D2 83 transition 4
D
1 ->-
r
1512 (Z1,z
2,z
3) ~II ~rotational Zeeman 3+speGtra for CaF2:Er recorded at 2 K and 4.0 tesla
. . L DL
(in the (001) plane), when exc1t1ng the
z
1 +2 transition with a a-polarised dye laser beam
4 D
1 +
r
1512(z
1,z
2,z
3) ~II ~rotational Zeeman spectra (at 2 K) recorded for the 83 site in 3+
CaF
2:Er , at 4.5 tesla (in the (001) plane). Dye laser is a-pol. and pumping the
zi
+D~
8
3 transition 4.41 D
1 + 4
r
1512
(z
1,z
2,z
3)~II ~rotational
Zeeman spectra (at 2 K) recorded for thes
3 site in3+ CaF
2:Er at 5.0 tesla. Dye laser is a-pol. and
142
148
149
152
153
[image:24.597.73.542.74.775.2]4.42
o
41 + I1512
<z
1,z
2 ,z 3) .!=!II k rotational Zeeman spectra (at 2 K) for thes
3 site in CaF2:Er
3
+
recorded at 6.0 tesla when pumping
zi
+o
1 with
a a-pol. dye laser beam 155
4.43
o
1 +4
r
1512 (Z1
,z
2,z3) high resolution (0.5 cm-1).!=! II k rotational Zeeman spectra (at 2 K) for the
3+ 8
3 site in CaF2:Er , recorded at 5.0 tesla 157 4.44 Magnetic energy variations of the 4
r
1512 (Z1
,z
2,z3) 83[110] site levels in CaF2:Er
3+
4.45 Splitting values of of the 83[110] site
of the magfietic field strength
4.46 Energy level scheme for the
s
1 s (i.e. BII
c~4.47 Energy level scheme for the
s
3[ 0] site (i.e. B
II
C" axis)s
4.48 Dl + Zl,z2,z3
II
~spectra (at 2 K) for the sl ands
3[110] sites in CaF2:Er 3
+, recorded at 5.0 tesla and a resolution of 0.5 em 1
(a-pol.) pumping
zi
+D~
Dye laser
4.49 Energy level schemes and sketches of intensity patterns for the
c
4V D1 +z
3 transverse Zeeman 3+
transitions in CaF
2:Er crystals
158
159
164
165
166
4 I
1512 (Z1
,z
2,z
3) transverse Zeeman levels in 3+CaF
2:Er , as a function of the magnetic field direction (in the (001) plane)
4.51 Pur of the
c
4v
z~
andz~
transverse Zeeman3+ levels in CaF
2:Er as a function of the magnetic
field strength
4.52 Calculated Zeeman energies of the
zu
1 and ZL 2 transverse Zeeman levels in CaF2 :Er 3+
for B
parallel to the C' and C" axes
s s
4.53 Calculated Zeeman energy positions of the z3
transverse Zeeman levels in CaF2:Er 3+ for B
parallel to the I and II axes
4.54 Purity of the
c
4V irrep labels for the
z
2 and4.55
4.56
. 3+
z
3?
3 transverse Zeeman levels ln CaF2:Er , as a function of the magentic field strength
4
E
1 -+
r
1512 (Z1,z
2, z3) ~II
k rotational Zeeman 3+ spectra (at 2 K) for thes
3 site in CaF2:Er , recorded at 6.0 tesla (in the (001) plane) when
exciting
zt
-+ E1 with a n-po1. dye laser beamComparison of the E1 -+ Zl,Z2,Z3 ~
II
k spectra-(at 2 K and 6.0 tes1a) for the sl and 83 [110]
sites ' ln C F a E J+
2: r , obtained with the dye laser
a
and n-polarised and pumping ZL 1 -+ E1173
176
178
179
181
188
4.57 E 4
1 +
r
1512 (Z1,z
2,z
3) ~ 1 k rotational Zeeman spectra {at 2 K) for the 83 site in CaF2:Er 3+,
recorded at 6.0 tesla and a resolution of 0.5 cm-l 192
4.58 Comparison of the E1 -+
z
1
,z
2,z
3 B 1 ~ spectra {at2 K and 6.0 tesla) for the 81 site, obtained with
the dye laser a and 'IT-polarised and pumping ZL 1 -+ El 193
4.59 D1 -+
z
1
,z
2,z
3 B II ~rotational Zeeman spectra( at 2 K ) f or t e h 81 s1te 1n CaF. . 3+ d d 2:Er , recor e
at 6.0 tesla and a resolution
of~
2 cm-l 1974. 60
o
1 -+
z
1,z
2,z
3 ~II
~ rotational Zeeman spectra( at 2 K ) f or t e h 8 2 s1 e 1n CaF. t . 3
+
d d 2:Er , recor eat 6.0 tesla and a resolution
of~
2 cm-l 1984.61
5.1
5.2
5.3
Dl + Zl,Z2,Z3 ~
II
k spectra (at 2 K) for the 8 2-site in CaF 2:Er
3+
recorded
,
with the dye lasera
and rr-polarised {and pumping the ZL+DL 1 2 82 transition), at a magnetic f ld strength of 6.0 tesla; 70 0
form the [100) axis in the {001) plane of the crystal
Absorption spectrum ( 1 9/2 4 -+ 4 F 3/2) of CaF 2:Nd (0.05%), recorded at 82 K
Energy level scheme of the
c
4V site in CaF2:Nd 3+3+
3+ Optical fluorescence spectra recorded for CaF
2:Nd (0.05%)
199
205
206
[image:27.595.84.544.71.764.2]5.5
5.6
5.7
5.8
912 312 2
{0.05%)
Optical fluorescence spectrum recorded for SrF
2:Nd
3
+(0.05%)
3+ Energy level scheme of the
c
4V site in SrF2:Nd
4
r
4912 +
r
1112 absorption spectrum (at 15 K) for CaF2:Nd
3+(0.05%)
4
Tetragonal 1
1112 energy level diagram for CaF2: Nd3+(0.05%) obtained from infrared absorption experiments (at 15 K)
4 + 41
5.9 1
912 1112 absorption spectrum of SrF2:Nd(0.05%) recorded at 80 K
5.10 Tetragonal energy level diagram for SrF
2:Nd(0.05%); obtained from infrared absorption experiments
5.11 4 1 4
912 (Z) +
r
1312 (X) absorption spectrum SrF2:Nd
3+(0.05%) recorded at 80 K
212 214 216 221 221 222 223 224
5.12
c
4V4 1
912 (Z1) + 4
1
1112 infrared Zeeman transitions 3+
in CaF
2:Nd forB
II
k 2275.13 Calculated 4 1 4
912 (Z1) and 11112
c
4V energy levels 3+for CaF
2:Nd as a function of the parallel and
6.1
6.2
6.3
3+
Infrared absorption spectra of CaF2:ce recorded at 80 K.
3+ Infrared absorption spectra of SrF
2:ce recorded at 80 K.
3+ Energy level diagram for CaF2:ce
6.4 Infrared Zeeman absorption spectrum (~II ~) 3+
(at 15 K) for CaF2:ce (0.1%), recorded at a magnetic f ld of 4.0 tesla parallel to a <111> crystal direction
6.5 Comparison of the theoretical and experimental
6.6
infrared Zeeman absorption en,ergies for CaF
2:ce
3+; with B
II <111> crystal direction
Zeeman energy splittings of the 2191 cm-l 2F
712
3+ level in CaF
2:ce (:§,
II
<111> crystal direction) 6.7 Infrared Zeeman absorption spectra (~II ~) (at 15 K)3+ for SrF
2:ce (0.05%), recorded at a magnetic field of 4.0 tesla parallel to a <111> crystal direction.
241
244
247
250
252
253
CHAPTER 1
INTRODUCTION
1.1
INTRODUCTION
The
main
purpose
of this
thesis
is to report on
experimental investigations of the transverse Zeeman effect for
ions in sites of C
symmetry.
The transverse Zeeman effect has
4v
reqently been analysed for ions in uniaxial crystals by Judd and
( 1)Runciman
They ptedict large variations in the intensity of
the purely a-polarised transitions of ions in sites of D
,
c
4
4v
or
D
symmetry as the crystal is rotated about the c axis in a
2d
transverse magnetic field.
The aim
of this
research was
to
veri
these predictions for ions in C
symmetry, and to obtain
4v
information
on
the
crysta
field
energy
levels
and
wave functions.
Variations in transverse Zeeman patterns were
reported
as
(2)early as 1934 by Lehmann
for ruby.
More recent investigations
(3,4,5)
(6)
have
been made on CoCs Cl
, erbium ethylsulphate
, and
(7)
holmium ethylsulphate
3 5
In a series of papers
(8,9,10,11,12,13)
by the Ames Laboratory group,
theoretical analyses have
been
made
for ions in C
, D and D
crystal-field symmetries.
The
mathematical formulation in these papers was elegantly simplified and extended to other point groups by Judd and
(1) (14) 3+
Runciman Since then, Noor has studied Er ions in
lanthanum ethylsulphate and
u
ions in Zircon using the formalism of Judd and Runciman.In this work, calcium fluoride crystals containing trivalent erbium ions were chosen. for investigation because there are tetragonal (C ) symmetry sites in these crystals.
4v
Trivalent erbium ions were chosen as the rare-earth because: 1) Many of the optical C crystal-field levels have
4v
been identified by earlier workers using either spin-lattice relaxation measurements to relate E.P.R. and
(15) (16)
optical spectra or optical Zeeman measurements
(16)
2) From the optical Zeeman studies, Rector et al. report the parallel and perpendicular magnetic splitting values for some of the tetragonal levels. 3) For the laser selected Zeeman fluorescence experiments (Chapter 4), there are absorption transitions accessible for dye laser excitation and the resulting fluoresce,nce is in the visible reg ion of the electromagnetic spectrum.
different charge compensated erbium ions and their corresponding
5
nonequivalent Zeeman sites in the cubic (0 ) symmetry calcium
h
fluoride crystals, the technique of laser selected Zeeman
fluorescence spectroscopy was developed. A dye laser is tuned
to excite selectively a Zeeman absorption transition. Provided
that for a given polarisation the absorption lines for the
different sites do not overlap, fluorescence is restricted to
that from the particular Zeeman site excited. This technique
was used to determine unambiguously the optical Zeeman spectral
lines of the erbium
c
sites. Similarly, it was also used to4v
locate and identify previously unobserved erbium
c
site4v
crysta field levels.As will be ~hown, a detailed investigation of the
transverse Zeeman spectra for tetragonal C trivalent erbium
4v
ions in calcium fluoride crystals can be satisfactorily
(1) accounted for using the analysis of Judd and Runciman
Another research topic was to measure the C crystal field
4v
energy levels of neodymium and cerium ions in calcium and
strontium fluoride crystals. This topic was motivated by the
4 4
need to redetermine the energy levels of the I and I
9/2 11/2
multiplets of neodymium in calcium fluoride following
(17)
(18)
McMahon and by some anomalous crystal-field
(19) 3+
results reported by Manthey for CaF :Ce 2
analysis
Both fluorescence and infrared absorption techniques were
3+
used for Nd ions and successful crystal-field analyses were achieved for the C site when both intermediate coupling and
4v
crystal-field mixing were included. Fluorescence lifetime measurements were also obtained for several of the neodymium
4 4 4
transitions ( F ->I , I ).
3/2 9/2 11/2
Infrared absorption measurements correct the fluorescence
(19) 3+
results of Manthey for CaF :Ce and the resulting crystal-2
field analysis gives parameters for cerium which are consistent with those obtained for other rare-earth ions in calcium fluoride.
1.2 RARE-EARTHS IN CRYSTALLINE HOSTS
All the investigations have been carried out on trivalent ·rare-earth ions in alkaline-earth fluoride host crystals. The rare-earths belong to the lanthanide series which is characterised by the progressive filling of the 4f-shell. · As a
(20)
result of the lanthanide contraction and the subsequent
2 6
shielding of the f-electrons by the closed (5s) (5p) shells, the 4f-shell behaves as an inner shell. Thus the shell is relatively insensitive to the atomic environment and does not interact strongly with the neighbouring atoms or ions of the crystalline lattice. This accounts for the sharp optical transitions observed in the spectra of crystals containing rare-earth ions. Rare-Earth ions usually enter into chemical combination in the trivalent valence state.
1.3 STRUCTURE OF THE ALKALINE-EARTH FLUORIDES
The alkaline-earth fluorides (CaF ,SrF ,BaF ) form cubic
2 2 2
5
crystals having the space group symmetry 0 • The alkaline-earth h
ions
2+ 2+
(Ca ,Sr
2+
,Ba ) are located at the centre of a cube of fluorine ions and every alternate cube of fluorines is empty
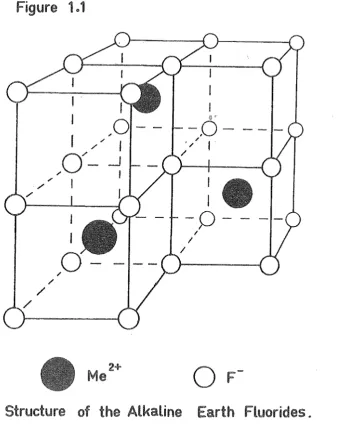
2+
(Figure 1.1) • Both the alkaline-earth ions (Me ) and interstitial (empty cation) sites have cubic 0 point symmetry
Figure 1o1
/ /
/
Me
2+
Structure of
()
-,0-/
, I'
I .
/
I
I
-o
II /
0
Alkaline Earth Fluorides .
whi the fluorines have tetrahedral (T ) point symmetry.
d
1.4 TRIVALENT RARE-EARTH CHARGE COMPENSATION IN MeF
2
3+
When trivalent rare-earth ions (RE } are introduced into the alkaline-earth fluorides, they substitute for the divalent
2+
[image:36.595.137.478.75.515.2]required for the crystal to maintain charge neutrality. Charge
compensation sites have been investigated for most of the
rare-earth ions in alkaline-rare-earth fluoride (MeF ) crystals by means
2
of optical spectroscopy using the concentration series
(21,22,31)
method optical Zeeman
. (16,23,24,25) measurements
{26,27)
E. P.R.
(27)
and Endor Infrared spectroscopy using
hydride ion local mode vibrations has also been used to
investigate charge compensation sites in hydrogenated
3+
MeF :RE 2
{28,29,30) crystals
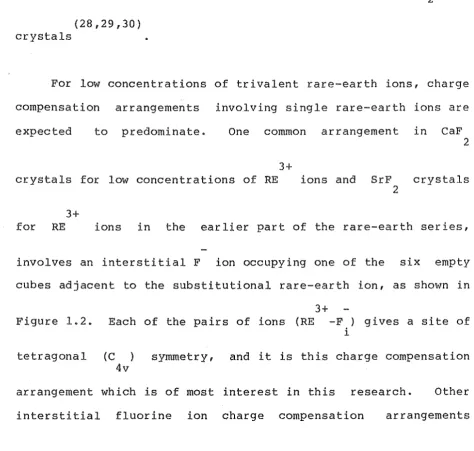
For low concentrations of trivalent rare-earth ions, charge
compensation arrangements involving single rare-earth ions are
expected to predominate. One common arrangement in CaF
2
3+
crystals for low concentrations of RE ions and SrF crystals
2
3+
for RE ions in the earlier part of the rare-earth series,
involves an interstitial F ion occupying one of the six empty
cubes adjacent to the substitutional rare-earth ion, as shown in
3+
Figure 1.2. Each of the pairs of ions {RE -F ) gives a site of
i
tetragonal (C ) symmetry, and it is this charge compensation
4v
arrangement which is of most interest in this research. Other
[image:37.595.55.530.309.760.2]involving cubic (0 ) and trigonal (C ) symmetry have also been
h 3v
(27) reported in the literature. A recent review is by Baker
/ /
/
I
I
~0-RE~H
0
I
--0-
~/
"
/
CHAPTER 2 THEORY
2.1 CRYSTAL-FIELD THEORY
The Hamiltonian for a rare-earth ion in fr crystal field has
(20)
been well documented by Wybourne , and may be written as:
[
h2 N 2 N Ze2 N 2
J
k k'JC
= - -
L
v · -I -
+I
~ +I
~(E) ~i • ~i +I
B (c-) . , (2 .1)2me i=l J. i=l ri i<j rij i k,q,i q q J.
where the symbols have their usual meanings. The free ion terms in the bracket are the .kinetic energies of all the electrons, the electron-nuclear potential energy, the repulsive Coulomb potential energy of the interaction between pairs of electrons, and the electron spin-orbit energy respectively. Basis states frequently used for the eigenfunctions of the Hamiltonian, are those formed by Russell-Saunders (LS) coupling, since the first three terms of the Hamiltonian commute with both the total orbital angular momentum operator L and the total spin angular momentum operator
s.
The spin-orbit interaction commutes with the total angular momentum operator J=L+S, but not with L or S2S+l
individually, and so splits the L terms into levels 2S+l
characterised by different values of J (i.e. L ) •
J
If there
momentum it is often more realistic to use the j - j coupling scheme. For the rare-earth ions, the spin-orbit coupling is of moderate strength and an intermediate coupling scheme is appropriate with the eigenvectors formed from linear
2S+l 2S+l
combinations of the L terms. The dominant L term in
J J
the combination is usually used as a label even though
s
and L are no longer good quantum numbers.The last term of the Hamiltonian, the crystal-field term, can lift the degeneracy of the intermediate coupling free ion levels further, although two-fold Kramers degeneracy must remain for a configuration containing an odd number of equivalent
( 32)
electrons Provided the. crystal field is invariant under the operations of a point group, the eigenfunctions of the crystal-field levels can be labelled according to their transformation properties by the irreducible representations (irreps)
r
of that point group. Although the previous S, L andj
J labels are no longer good quantum numbers they are often included in the labelling scheme as indicators of the parentage of an eigenfunction.
(33)
Bethe developed crystal-field considering purely electrostatic
theory fields
in 1929 perturbing
by the wavefunctions of the ion. The surrounding ligands were replaced by point charges and the potential energy for an
(34)
(20)
Wybourne expanded the crystal field in terms of the Racah (k)
spherical tensors C which are related to the spherical
harmonics Y by:
k,q
c
(k) =q q
( 2k+l 41T ]
~
y k,q ( 2 • 2)The matrix elements of these operators may be calculated using (20)
the detailed formulae given by Wybourne The effects of intermediate coupling can be accounted for in first-order perturbation using the electrostatic and spin-orbital wavefunctions as zero-order wavefunctions by noting that
<o:JIIU(k)llo:'J'>
= L
ijc . c . <
s .
L' Jllu (
k) IIs
'L 'J I > ,1 J 1 1 J J ( 2 • 3)
where the c and c 's are the ISL> eigenvector components of the
i j
(k) intermediate coupling states lo:J>, and U
(k)
reduction of the matrix elements of U in:
q
=
<l u (
k)I
> < Q.II c (
k )II
Q, >q
arises from the
( 2. 4)
The radial information is contained in the crystal-field k
parameters (B ) which are usually treated
q
as adjustable
-configuration, k will be even and not greater than 6, and the values of k and q will be restricted by the point symmetry of
the rare-earth ion site.
The crystal-field Hamiltonian appropriate for
c
symmetry 4vis:
( 2 • 5)
however, it is often more convenient in dealing with the cubic fluorite lattice to express the tetragonal crystal-field as the sum of cubic and axial terms:
4 6
Since the cubic crystal-field parameters B and B are
than, or at least comparable with the axial parameters
,._6
and B , the crystal-field wavefunctions can be labelled
0
( 2 • 6)
larger "2 _._4 B
,
B0 0
by the
cubic 0 and tetragonal C irreps
r
and Y respectively. Forh 4v i j
configurations with an odd number of electrons, J is half integer and the crystal-field energy levels may be characterised
(2) by the
r
, r
6 7
( 2)
and
r
8 ( 4)
by the C irreps into which these decompose, viz y , y and
4v 6 7
y +y • 6 7
The
M
basis states are commonly used to form theJ
eigenfunctions of the y and y irreps of the C group. In the
6 7 4v
( 35)
notation of Hellwege (i.e. M
=
ll (mod q)) the y and yJ 6 7
irreps correspond to the ll = ±1/2 and +3/2 crystal quantum numbers respectively.
Group theory can be used to determine the non-zero matrix elements
J
~;~~idT
a requirement of which is that the triple*
product f X f X f contains the identity irrep f , where f and
f op i 1 i
r
are the irreps of two levels connected by an operatorf
transforming as the
r
opirrep of the point group. This may
equivalently be written in the more convenient form:
r
0Px
ri
:Jrf .
( 2 • 7)Since the Hamiltonian transforms as
r
,
thec
crystal-1 4v
field energy matrix can be reduced to two matrices whose wavefunctions transform as the y andy irreps respectively.
2.2 THEORY OF THE TRANSVERSE ZEEMAN EFFECT
The interaction of the electronic magnetic dipole moment
with ary external magnetic field {~) can be written, in
first-{20) order in the field, as a sum of N electrons
and in the LS coupling scheme this becomes
where g = 2.00232 and
S
=
eh 2m is the Bohr magneton. s{2. 8)
( 2. 9)
The parallel and perpendicular (i.e. transverse) Zeeman
effects are calculable from the magnetic part of the
Hamiltonian, ~~ = SB (L +g S )
z
z
s z
and=
SB {L +gS )
X X S X
respectively, using the tensor operator methods of Racah.
Formulae for the parallel and perpendicular Zeeman matrix
{20)
elements are given by Wybourne However, there are errors
of sign in two of the perpendicular Zeeman formulae (6.34 and
6.39 of reference(20)), and the corrected formulae are:
<fNaSLJJ
I
(L +2S )I
fNaSLJJ ±1> = 92 [ (J+J ) (J±J +1)]
~
Z X X Z Z Z (2.10)
and
<fNaSLJJ z
I
(L +2S ) lfNaSLJ'J ±1> y y za± i<fNaSLJJ
I~
+2S ) lfNaSLJ'J +1>Formulae with the orbital angular momentum reduction factor included (so that k~+g ~ is the Zeeman operator}, are given by
s (68)
M?-cFarlane
The parallel and perpendicular magnetic splitting values,
~I and
s
1 , of the crystal-field energy levels are defined by the llErelationship S =
BB'
where llE is the energy separation between the components of a Kramers doublet in a magnetic field.When a magnetic field is applied perpendicular to the c axis of a unaxial crystal, the point symmetry at the ion site in
the crystalline lattice will be reduced to one of the subgroups of the zero magnetic field point group. In general this reduction will be to
c
I but if the magnetic field is parallel1
to an axis of symmetry in the transverse plane, a higher subgroup may be appropriate. The energy levels of the ion can then be classified according to the irreps of that subgroup point symmetry. As the crystal is rotated about the c axis, the irrep labels for the levels may be compared for the magnetic field along the various axes of symmetry. The irrep labels may be either preserved or switched under the rotation, and the corresponding levels are historically labelled type A or type B
(9)
respectively
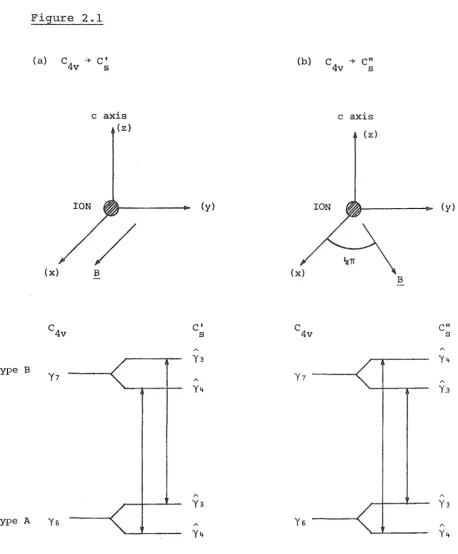
For an ion in tetragonal C symmetry, the two sets of axes
4v
symmetry, make angles of ~/4 with each other. When a magnetic
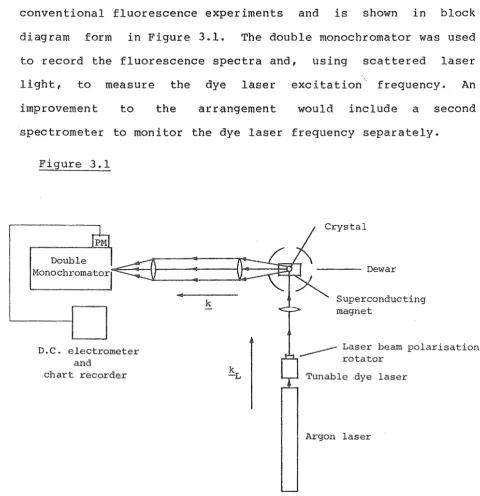
field coincides with either of these sets of axes, that is the x
(or y) axis or an axis midway between the x,y axes, the point
"
symmetry at the ion will be C or C respectively. Here we
s s
adopt the true crystal-field symmetry at the ion rather than the
(1)
method of Judd et al. who started with a higher point
symmetry, D
4h
by omitting the odd-parity terms of the C
4v
crystal-field Hamiltonian. For an ion with an odd number of
electrons, the Kramers components can be labelled by the y and
3
y irreps of the C group. The crystal-field energy levels can
4
s
be classified as types A or B using the method shown in detail
(1)
by Judd and Runciman The only difference in the analysis
when considering the
c
group instead of the C group is thats 2h
the rotation R of TI about y is replaced by a reflection
a
in thexz plane (of the C group). However, since
4v
J+M
a!JM>
=
(-1) IJ,-M>(1)
(2.12)
for an odd-parity configuration , the resulting irrep labels
will be similar.
In summary, the preservation or switching of the labels
depends on the particular M values associated with the Kramers
components. In a rotation of n/4 about the z axis, so that the magnetic field direction goes from one axis of symmetry to another, the signs of some of the M states will change
J
~
(1)d • e 4 z \ a
·I
M>accor 1 ng to l
~ ~
.L. A A
These changes in sign have the effect oj reversing the energies of the y
3
and y 4
levels for the
type B doublets, while for the type A doublets the sign changes are cancelled when the contributing Zeeman matrix is formed and hence the energies do not reverse. It is concluded that the tetragonal C y and y doublets are of type B and type A
4v 7 6
respectively, aqd this result holds irrespective of the parity (1)
of the configuration. Judd et al. summarise the type assignments of levels for a number of point group symmetries.
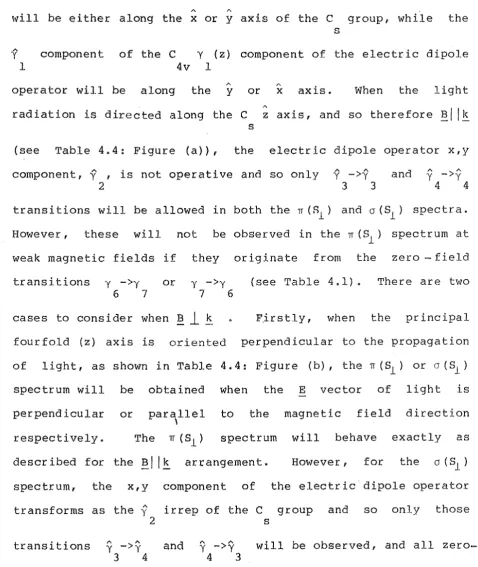
The intensity variations in the transverse Zeeman spectra can be analysed in terms of the electric dipole selection rules
II
for the C and C groups and the direction of the electric
s s
vector, ~' of the incident electromagnetic radiation. From an experimental point of view, it is convenient to consider the direction of propagation of light as paral 1 to the magnetic field direction (i.e. the z axis of the C point group) .
s
Therefore, the electric field vector will be perpendicular to the static field
!r
and the electric dipole operator willA A A
transform as the y (x or y) irrep of the C point group (see
1 s
Section 4.2.3}. Hence, .the allowed transitions for both the C
"
and
c
groups will correspond to those labelled by a ins
" A A A
Table 2.l(b), and these are the y ->Y and y ->Y transitions.
3 3 4 4
This means that A(Y )->B{Y ) and B(Y ) ->A (Y ) are the
6 7 7 6
transitions which show the striking intensity alternations in the
transverse Zeeman patterns for ions in sites of C symmetry.
4v
These results are summarised schematically in Figure 2.1.
The D group may be analysed by precisely the same method.
4
The D point group, however, differs in that the A->A and B->B 2d
transitions show the large intensity variations as the crystal
is rotated in a transverse magnetic field. This can be shown as
follows. When a magnetic field is applied along the y axis, the
reflection symmetry ad is broken leaving only a
c
symmetry2
operation. However, when the field along the axis midway
between the x,y axes, the point symmetry is now
c
.
Thes
"
magnetic energy levels may still be labelled by the y and y
3 4
irreps of the respective
c
andc
point groups, and the2 s
type B
Figure 2.1
(a)
(x)
C + C'
4v s
ION
c axis (z)
/
B
c4v
Y7
type A y6
(y)
C' s
A
Ys
A
Y4
A
Ys
(b)
c4v
Y7
C + C"
4v s
c axis
(z)
B
(y)
C" s
A
Y~t
A
Y.3
The allowed transitions are shown for ~parallel to the direction of light.
A summary of the transverse Zeeman effect for ions in sites
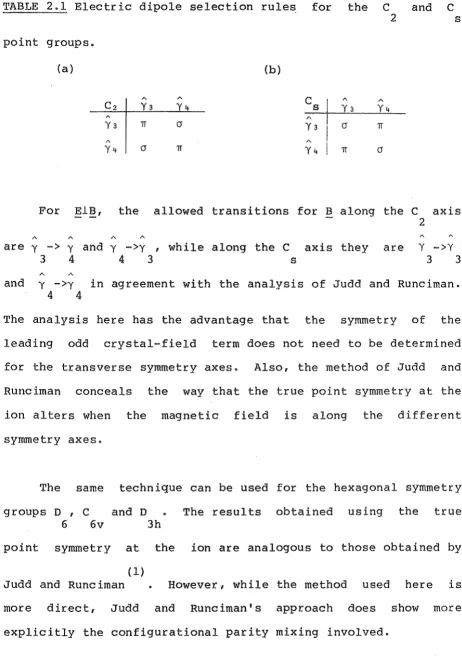
[image:49.597.44.502.70.624.2]TABLE
point
2.1 Electric dipole selection rules for the
c
andc
groups.
(a)
c2
" Ya
A
y'*
For !!:;1!!,
"
2 s
(b)
A A
cs
A"
Ya y'* Ya y'*
A
7T 0 Ya 0 7T
A
0 7T y'* 7T 0
the allowed transitions for B along the C axis 2
are y -> y and y ->y , while along the C axis they are Y ->Y
3 4 4 3 s 3 3
A A
and y ->y in agreement with the analysis of Judd and Runciman.
4
4
The analysis here has the advantage that the symmetry of the
leading odd crysta field term does not need to be determined
for the transverse symmetry axes. Also, the method of Judd and
Runciman conceals the way that the true point symmetry at the
ion alters when the magnetic field is along the different
symmetry axes.
The same technique can be used for the hexagonal symmetry
groups D , C and D The results obtained using the true
6 6v 3h
point symmetry at the ion are analogous to those obtained by
(1)
Judd and Runciman However, while the method used here is
more direct, Judd and Runciman's approach does show more
[image:50.597.66.529.73.730.2]3.1 CRYSTALS
CHAPTER 3
EXPERIMENTAL
The rare-earth doped alkaline-earth fluoride crystals were
either purchased
from Optovac Inc.
(U.S.A.)
or grown in this
department
by Mr
R.A. Ritchie using a
38
kilowatt radio
frequency furnace manufactured by Arthur D. Little Company.
The
locally made unoriented crystals were grown from
alkaline-earth
fluoride
crystal starting material (Optovac Inc.
stock) by the
Bridgeman-Stockbarger method.
The dopant was added in the
rare-earth fluoride form and small amounts (typically 2%
by weight)
of lead fluoride were added as an oxygen scavenger.
Rare-earth
concentrations of 0.05% and 0.1% were used
for
most crystals,
this being a
compromise between having sufficient rare-earth
dopant to give observable spectral line intensities yet
not
so
much
that cluster sites predominate.
The crystals were grown
over a period of 18 hours in a helium atmosphere, by lowering a
graphite crucible containing
the crystal material through a
temperature gradient.
calcium or strontium fluoride melt. The seed could be aligned
0
to within 10 of the required orientation by means of the {111) cleavage planes using the crosshairs of a cathetorneter. The diameter of the crystal was controlled by altering the furnace
(36)
temperature. R.J. Kennedy found the least strained crystals were obtained at pulling rates of between 20-25 mrn/hour, and 5 rev/min rotations of the seed produced more uniform diameter crystals. Crystals up to 8 ern in length were grown and these
0
were annealed at -700 C for half an hour before being cooled to room temperature. A more detailed account of Czochralski crystal growing with the aforesaid radio-frequency furnace has
(36)
been given by Kennedy
Crystals oriented in a <100>, <110> and <111> direction were also purchased from Optovac Inc. The alignment of Optovac crystals has been found by X-ray diffraction photographs in the
0
Laue back reflection mode to be within 2 of the required
{37)
3.2 OPTICAL SPECTROSCOPY OF CaF :Er 2
-3.2.1 INSTRUMENTATION
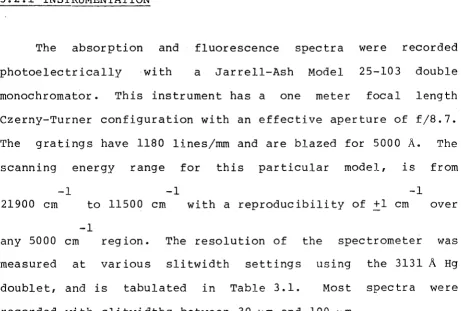
The absorption and fluorescence spectra were recorded photoelectrically with a Jarrell-Ash Model 25-103 double monochromator. This instrument has a one meter focal length Czerny-Turner configuration with an effective aperture of f/8.7. The gratings have 1180 lines/mm and are blazed for 5000
A.
The scanning energy range for this particular model, is from-1 -1 -1
21900 em to 11500 em with a reproducibility of
±1
em over-1
any 5000 em region. The resolution of the spectrometer was measured at various slitwidth settings using the 3131
A
Hg doublet, and is tabulated in Table 3.1. Most spectra wererecorded with slitwidths between 30 ~m and 100 ~m.
Table 3.1 Resolution of the Jarrell-Ash double monochromator measured at various slitwidths using the 3131
A
Hg doublet.
Nominal Slitwidths Resolution entrance/intermediate/exit (em-1
)
(microns)
20/20/12 .1
20/20/20 .2
30/30/30 . 4
40/40/40 . 5
50/50/50 . 7
I
60/60/60 1.0
[image:53.597.67.529.154.465.2] [image:53.597.91.443.591.799.2]Using the accurately known mercury spectral lines, the calibration of the instrument was measured over the whole spectral range. Then during each experimental session, the 3131.55
A
and 3131.83A
Hg lines were recorded in second order, and the appropriate wavenumber corrections made to the recorded spectra. All energies are reported in air wavenumber units.An R.C.A. type 31034 photomultiplier tube,
thermo-0
electrically cooled to 5
c,
was used as a detector. This tube has an extended S-20 spectral response. The photomultiplier's output was amplified using a Jarrell-Ash d.c. electrometer, and the output displayed on a Bristol chart recorder.3.2.2 ABSORPTION EXPERIMENTS
A 100 watt quartz-iodine lamp operated from a voltage regulated power supply was used as a source to obtain the absorption spectra. A series of Corning filters were used to provide a pass band in the wavenumber reg ion to be scanne-d, to eliminate radiation from unwanted orders and to provide minimal heating at the crystal. In particular, the CS 1-69 filter was used to eliminate infrared radiation.
4 4 -1
The Z > F and
z
-> S transitions in the 15400 em1 9/2 1 3/2
-1
and 18550 em regions respectively were measured in
first-4 -1
were measured in second order.
The linear polarisation Zeeman absorption measurements were
made using a polariod sheet as an analyser. For the circular
polarisation absorption measurements, the available analysers of
sufficient aperture were satisfactory only for the green region
of the visible spectrum. For example, the
1/4 A
plate had aretardation value of 140+20 nm.
All spectra were recorded with a quartz wedge polarisation
scrambler at the entrance slit since the reflectance of the
spectrometer grating is a function of polarisation.
The absorption ·coefficients given in the tables in
Chapter 4, were calculated using:
(3.1)
where
AA
is the absorption coe icient for a transition ofwavelength
A,
T is the background transmission of light through0
the crystal, and T is the transmission measured at peak
absorption. The CaF :Er
2
t=(9.5±_0.2) rnm.
3+