Original citation:
Rosli, M. H., Fan, Y. and Edwards, R. S. (Rachel S.) (2012) Analysis of Rayleigh wave interactions for surface crack characterization. In: Review of Progress in QNDE,
Burlington, VT, 17-22 July, 2011. Published in: AIP Conference Proceedings, Vol. 1430 pp. 209-216.
Permanent WRAP url:
http://wrap.warwick.ac.uk/50886
Copyright and reuse:
The Warwick Research Archive Portal (WRAP) makes the work of researchers of the University of Warwick available open access under the following conditions. Copyright © and all moral rights to the version of the paper presented here belong to the individual author(s) and/or other copyright owners. To the extent reasonable and practicable the material made available in WRAP has been checked for eligibility before being made available.
Copies of full items can be used for personal research or study, educational, or not-for-profit purposes without prior permission or charge. Provided that the authors, title and full bibliographic details are credited, a hyperlink and/or URL is given for the original metadata page and the content is not changed in any way.
Publisher’s statement:
Copyright (2011) American Institute of Physics. This article may be downloaded for personal use only. Any other use requires prior permission of the author and the American Institute of Physics.
http://dx.doi.org/10.1063/1.4716232
A note on versions:
The version presented here may differ from the published version or, version of record, if you wish to cite this item you are advised to consult the publisher’s version. Please see the ‘permanent WRAP url’ above for details on accessing the published version and note that access may require a subscription.
Analysis of Rayleigh wave interactions for surface crack characterisation
M. H. Rosli, Y. Fan, and R. S. Edwards
University of Warwick, Coventry, CV4 7AL, United Kingdom
ABSTRACT. Electromagnetic acoustic transducers (EMATs) have been used in pitch-catch mode for a better characterisation of surface cracks in metals. The system, which combines the measurement of Rayleigh wave velocity in the in-plane and out-of-plane directions, has been used to understand the interaction of Rayleigh waves with inclined surface cracks. This shows a stronger and more prominent enhancement pattern when compared to the enhancement caused by cracks which are normal to the surface. In addition, measurements in the far-field are combined with the near-field enhancement measurement, with a view to characterise the cracks. An algorithm for characterising surface cracks is presented. A finite element method model has been computed to simulate the experiment, and the cause of the prominent enhancement in the inclined cracks is explained.
Keywords: Rayleigh wave, Surface crack, EMATs, Ultrasonics PACS: 81.70.Cv
INTRODUCTION
Rayleigh waves are known to be a suitable wave mode for probing surface defects [1]. With most of the energy confined within a wavelength of the sample surface, Rayleigh waves suffer little attenuation during propagation. This property makes them viable for probing some distance along the sample. Recent work has shown that Rayleigh waves transmitted underneath a defect can be used for defect sizing. However, for accurate sizing any depth measurement has to be treated with a caveat. The vertical depth of the defect must be a fraction of the wavelength. Thus, in order to size defects in any structure or sample, the range of possible depths should be known. The interaction of Rayleigh waves with surface cracks has been studied by many authors [1-7]. For characterizing cracks, the reflection and transmission coefficients are the common parameters calculated or measured in relation to crack depth [1, 3]. They can be considered as far-field measurements, where the distance of the transducer to the crack is greater than a few wavelengths. Alternatively, there has been some recent interest in near-field measurements, looking at the enhancement of Rayleigh waves close to the crack [6-9]. In both cases, most authors consider the simple geometry of a surface crack where the crack grows normal to the surface.
straight down the rail and causing it to break. With our proposed system, we have a better characterization of surface defects that includes the ability to assess the type of crack and its severity, without relying on incorrect calibrations. In addition, crack position can also be determined through measuring the signal enhancement close to the crack. We also explain the crack characterization procedure through the use of B-scans, and far- and near-field measurements. The enhancement of signals close to the crack is explained, where we consider mode-conversion of a Rayleigh wave to a Lamb-like wave for small angled inclined cracks. The understanding of this enhancement behaviour is not only beneficial in NDE but it is also important in physics in general.
EXPERIMENTAL DETAILS
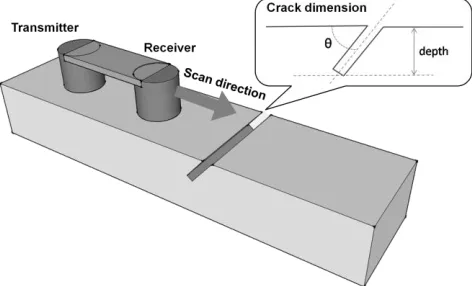
We have used a pair of EMATs generating and detecting Rayleigh waves, with the transmitter and receiver separated by 150 mm and working in “pitch-catch” mode. The EMATs are scanned along the surface of aluminium bar containing a surface crack, as shown in Figure 1. In order to simulate real cracks, slots are machined across the bar width on the surface at different inclination angles, θ, and vertical depths. The cracks used for the experiment have θ varying from 15º to 90º and depths from 1.5 mm to 20 mm. The EMATs used for transmitter and receiver are made by wrapping a coil of wire around the circumference of a cylindrical NdFeB magnet before placing in a brass casing. For the transmitter, wire of diameter 0.315 mm is used for the coil, while wire of diameter 0.08 mm is used for the receiver. Two types of EMAT receiver are used separately with the same transmitter when scanning over cracks. These receivers are set to be primarily sensitive to either the in-plane or out-of-plane particle velocity, with sensitivity dependent upon the arrangement of the magnetic field from the permanent magnet and the coil. The transmitter generates a broadband Rayleigh wave with frequency range 50 – 500 kHz, with centre frequency around 230 kHz. The EMATs operate at a lift-off of 0.1 mm above the aluminium bar.
[image:3.612.182.418.552.695.2]Along with the experimental work, a two-dimensional Finite Element Method model has been computed using a commercial package, PZFlex. The generation source for the model is set from a measurement of the generation current pulse used in experiments. Each element has a dimension of 129 x 129 μ . All boundaries except the top surface have been set as absorbing to minimise reflections from the bottom face and from the bar ends. The position of the generation source is fixed at 200 mm from the crack, while the in-plane and out-of-plane velocities are recorded within a 50 mm region centred on the crack.
RESULTS
Crack characterisation requires several steps; initial image analysis to identify the type of crack, transmission measurement, and near-field enhancements. These are detailed here.
1. Initial crack classification through B-scan analysis
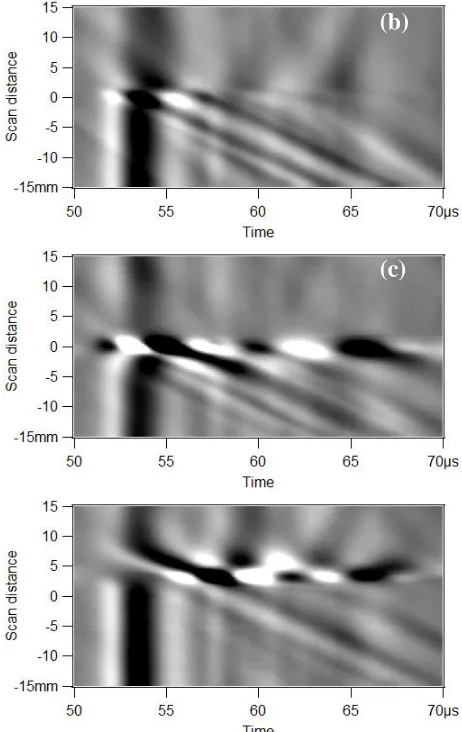
The signals recorded while scanning the EMATs over cracks are plotted as B-scans, where signal amplitudes are represented by the grayscale, with white indicating peaks and black troughs. Figure 2 shows the B-scans with the out-of-plane EMAT receiver scanned over 3 mm deep cracks of θ= 90º, 22.5º, and 157.5º. The y-axes show the distance between receiver and crack, with 0 mm indicating the position of the crack, while the x-axes show the arrival time. The incident Rayleigh wave arrives at about 52 μs due to the fixed 150 mm separation between the transmitter and receiver. Close to the crack, an enhanced signal is observed, but the exact enhancement depends on the crack geometry. For the 90º crack, the Rayleigh wave enhancement occurs due to the interference of the incident wave with its reflection from the crack and the mode-converted surface skimming longitudinal wave generated at the crack tip. The other two B-scans show stronger and more prominent enhancement patterns. These B-scans are from the same crack (22.5º) but from opposing scan directions.
The difference in the B-scans for 22.5º and 157.5º cracks indicates that we can differentiate whether the crack angle is acute or obtuse relative to the incident Rayleigh wave. When the crack angle is obtuse, there is a time delay for the enhancement to occur. The arrival time is delayed as the Rayleigh wave propagates under the crack. From the B-scan analysis, certain information can be extracted for initial crack classification. Firstly, the position of the crack can be located using the enhancement feature at a certain scan distance, with a reasonable error. In our measurement, this error is due to the size of the coil used for the receiver. Secondly, the type of the crack, i.e. whether it is normal (90º or close to 90º) or inclined to the surface can be determined from the enhancement pattern. Thirdly, the crack orientation, i.e. whether the angle is acute or obtuse relative to the incident Rayleigh wave can also be determined. Following this, the depth and the inclination, θ, can be characterised using this information.
2. Far-field measurement
In far-field measurements, the receiver is at least three wavelengths away from the crack. We calculate the transmission coefficient, , of the Rayleigh wave as it propagates underneath a crack and use this to calibrate the depth. This method for calibrating and gauging depth has been explained in detail previously for 90º cracks [2]. The transmission coefficient is calculated by dividing the averaged Rayleigh wave amplitude when a defect is present between the transmission and receive EMAT by a measurement of the amplitude over a defect-free section of the same surface.
FIGURE 2. B-scans from out-of-plane measurements on 3 mm deep cracks of θ = 90⁰ (a), θ = 22.5⁰ (b),and θ = 157.5⁰ (c). Note that (b) and (c) are the same crack but the scans are made from opposite directions.
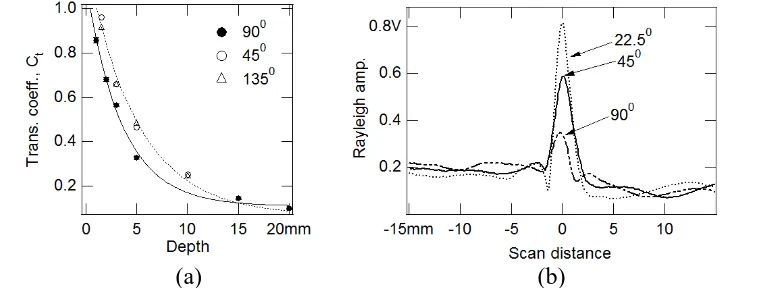
The calculated are plotted as a function of crack depth in figure 3(a) for experimental in-plane measurements of 90º, 45º and 135º cracks. Note that the 45º and 135º data overlap each other. This is expected as the measurements are made on the same crack but from two opposing directions. The plot shown in figure 3(a) is used to calibrate changes in for known crack depths, thus we can estimate the crack depth from a measured . There is a difference between the calibrations for the 90º and 45º curves. Although the difference is small, , if a calibration using 90º slots is used to gauge a 45º crack the percentage error can be very significant, such that it can underestimate the actual crack depth. Therefore, in order to gauge the crack depth, we need to use the correct calibration.
3. Near-field measurements
In near-field measurements, the EMATs are scanned with smaller scan steps (0.1mm) across the crack. A window is set to cover the incident Rayleigh wave pulse, measuring the peak-to-peak amplitude of the Rayleigh wave at each scan point. Figure
(b)
3(b) shows the experimental out-of-plane measurements of the amplitudes as a function of scan distance for 22.5º, 45º and 90º cracks of 3 mm depth. At positions close to the crack, the amplitude is enhanced significantly and theist magnitude is different for different θ. This behaviour is also observed in the in-plane measurements. In order to quantify the enhancement, we define an enhancement factor, which is given by
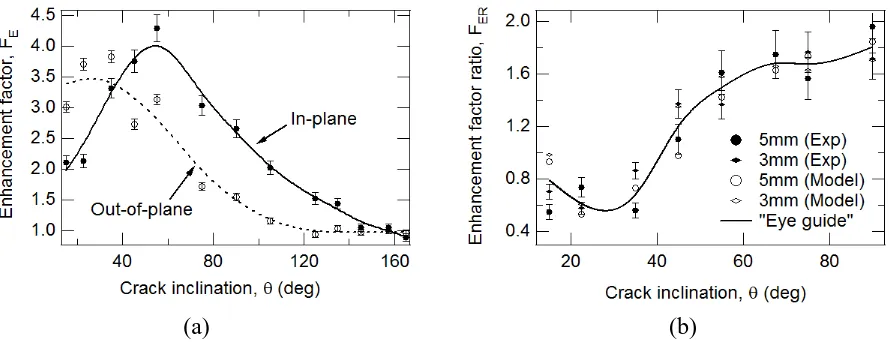
where is the enhanced amplitude and is the reference amplitude measured for clean section of sample. is shown in figure 4(a) for various θ between 15º and 165º for in-plane and out-of-plane data on 3 mm cracks. The solid and dotted lines correspond to in-plane and out-of-plane data and are given as a guide to the eye to highlight the trend shown by the data. The graph shows that the enhancement for each component varies with θ. At small θ, the out-of-plane component is higher than the in-plane component, while for other angles the opposite occurs. The change happens approximately when θ ≈ 40º. This agrees with previous work done for a 90º crack [6].
FIGURE 3. (a)Calibration curves for gauging crack depth. Transmission coefficient is plotted as a function of crack depth for experimental in-plane measurements on 90⁰, 45⁰, and 135⁰ cracks.(b) Rayleigh wave amplitudes for 3 mm deep cracks, showing enhancement close to the crack.
The results for θ > 90º cannot be accepted blindly, because in this region the actual enhancement occurs slightly later than the original Rayleigh wave arrival time, as shown in the B-scan in Figure 2(c). Thus, it does not lie within the window set to measure the peak-peak amplitude. Nonetheless, for a crack with θ > 90⁰, we can turn the transmitter-receiver around and scan from the opposite direction to get the other . As varies between the in-plane and the out-of-plane components, we then calculate the ratio between them, , to get a parameter that varies with θ. is defined as
where and are the in-plane and out-of-plane respectively. We calculate for 3 mm and 5 mm deep cracks using experimental and model data, for the region where θ < 90⁰. The calculated is shown in Figure 4(b). The solid line is again a guide to the eye to show the trend of with θ. Error bars are shown for the experimental data only. There is only a small variation between for 3 mm and 5 mm deep cracks in both the experiment and model data. We can estimate the crack inclination, θ, using the calculated value of . The error in the estimated value is approximately 10º.
[image:6.612.105.490.276.420.2]FIGURE 4. (a) Plot of enhancement factor, , as a function of crack inclination, θ, for the in-plane and out-of-plane components. (b) The ratio between in-plane and out-out-of-plane component, , as a function of θ.
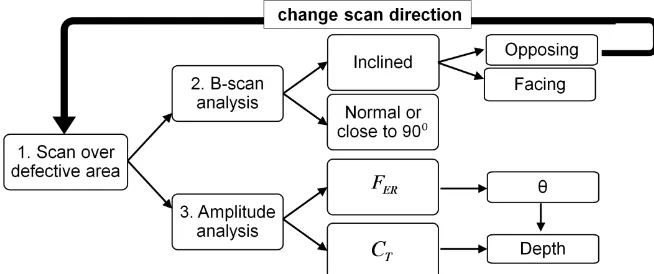
CRACK CHARACTERISATION ALGORITHM
The information extracted from the B-scan analysis and the far- and near- field measurements are used to characterize surface-breaking cracks. With a single scan over a defective area, a B-scan can be generated and through initial classification analysis, the location and type of the crack can be determined. For an inclined crack, if the analysis reveals that it is opposing the incoming Rayleigh wave, another scan is needed with the EMATs scanned from the opposite direction. For an acute angled crack (facing the incoming Rayleigh wave) and for cracks close to 90º, we then look at amplitude analysis in the far- and near-field measurements. For cracks close to 90º, the depth can determined from the calculation of . However, for inclined cracks gives an estimate of θ, which can be used to choose the correct depth calibration curve.
Our calibration is currently limited to 90º and 45º. Thus, we use the 90º calibration for cracks which are close to 90º, and the 45ºcalibration for any inclined cracks. This is certainly not the best assumption for getting accurate depth measurements as a better calibration is needed for small angled cracks, e.g. 10º, 20º etc. Nonetheless, the 45º calibration will give a much more accurate result than that using a 90º calibration. The algorithm shown in figure 6 has been tested on two “unseen” cracks of dimensions 4 mm deep (30⁰) and 7 mm deep (45⁰). It has successfully measured them as 4.5±0.6 mm (34⁰±10⁰) and 7.4±0.9 mm (45⁰±10⁰) respectively. The measured values agree very well with the actual values, within experimental errors. However, more tests of cracks of different depth and angle are required.
[image:7.612.79.524.53.224.2]FIGURE 6. The algorithm for characterizing surface cracks. It consists of B-scan analysis and measurements of the Rayleigh wave in the far- and near-fields.
FIGURE 7. Snapshots of FEM model showing Rayleigh wave interaction with a 22.5⁰, 5mm deep crack.
Top figures show incoming Rayleigh waves approaching the crack. Bottom figures show the interaction taking place.
DISCUSSION
The physics behind the enhancement of Rayleigh waves close to a surface crack has been widely studied [4-6]. The enhancement is caused by the constructive interference of the incident Rayleigh wave with its reflection and a mode-converted surface skimming longitudinal wave generated at the crack opening [5]. Most of these references only consider crack normal to the surface, 90º.
Although the explanation may be extended to the case of inclined cracks, the theory is not sufficient to explain the magnitude of the enhancements for shallow cracks. Figure 7 shows snapshots from a FEM model showing the interaction of the Rayleigh wave with a 22.5º, 5mm deep crack, both in the in-plane and out-of-plane particle velocity components. As a Rayleigh wave approaches the crack, some of the low frequency components are transmitted to the other side of the crack. Higher frequency components and some of the low frequency components are trapped within the wedge formed by the crack. In this tapered section, the changes of the local thickness need to be taken into account when determining the wave-mode present. The wave can no longer be assumed to a Rayleigh wave.
[image:8.612.104.493.222.368.2]where is the phase velocity. Equation (3) implies that the wave group velocity will depend on the product, also known as the frequency-thickness [7,8]. The total propagation time, , for travel in the tapered section can then be calculated using
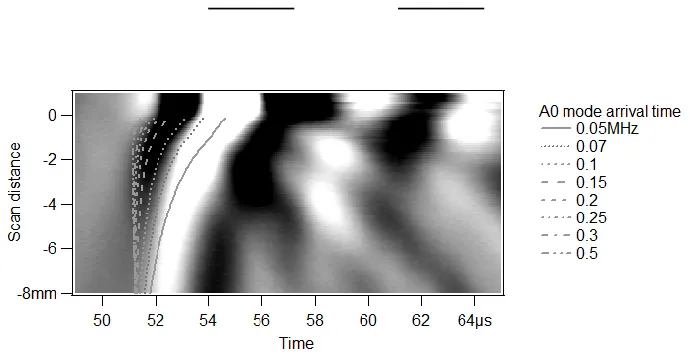
FIGURE 9. The calculated arrival times for different frequencies in an A0 Lamb-wave mode for a 15⁰, 5
mm deep crack are appended on the out-of-plane velocity B-scan.
We have calculated the arrival times of fundamental Lamb wave, A₀ mode at different frequencies for a 15º, 5 mm deep crack, and these are shown on the experimental out-of-plane velocity B-scan in Figure 9. Approaching the crack edge (0 mm), we can see that the lines representing different frequencies start to diverge from each other. The lower frequency components travel slower as they approach the crack edge and hence arrive later than the original Rayleigh wave arrival time. The calculated arrival times show a reasonable agreement with enhancement pattern shown in the B-scan. In the frequency-thickness region close to the crack opening, only fundamental Lamb wave modes exist, S₀ and A₀. In this region, the out-of-plane component of the A₀ modeis more dominant then the in-plane component. For the A₀ mode, the dominance of each component on the surface varies as the frequency-thickness increases [7].
CONCLUSIONS
REFERENCES
1. I. A. Viktorov, Rayleigh Waves and Lamb Waves-Physical Theory and Application,
Plenum, New York (1967).
2. R. S. Edwards, S. Dixon and X. Jian, Ultrasonics, 44, pp 93-98 (2006). 3. V. Kinra and B. Vu, J. Acoust. Soc. America, 79, pp 1688-1692 (1986). 4. S. Boonsang and R. Dewhurst, Ultrasonics, 43, pp 512-523(2005). 5. X. Jian, S. Dixon, N. Guo, and R. S. Edwards, J. App. Phys, 101 (2007). 6. R. S. Edwards, X. Jian, Y. Fan, and S. Dixon, App. Phys. Lett, 87(2005))
7. J. L. Rose, Ultrasonic Waves in Solid Media, Cambridge University Press, Cambridge (1999).