The Effect of Section Thickness on MR Lesion
Detection and Quantification in Multiple
Sclerosis
Paul D. Molyneux, Niall Tubridy, Geoff J. M. Parker, Gareth J. Barker, David G. MacManus, Paul S. Tofts, Ivan F. Moseley, and David H. Miller
BACKGROUND AND PURPOSE: The purpose of our study was to investigate the effect of section thickness on MR detection of brain lesion volume and measurement precision in patients with multiple sclerosis (MS).
METHODS:Eight subjects with known MS were studied on a 1.5-T MR system. We used a 3D fast fluid-attenuated inversion-recovery sequence to obtain contiguous axial brain images at section thicknesses of 5 mm, 3 mm, and 1 mm. Two sets of images were acquired at each section thickness during two sessions, between which the patient was removed from the scanner. Lesion volumes were measured at each section thickness using a semiautomated local thresholding technique.
RESULTS: We found that progressive reduction in section thickness led to detection of smaller lesions, resulting in a significant (8%) increase in lesion volume on MR images as section thickness was reduced from 5 mm to 3 mm. However, despite a further increase in lesion detection at a section thickness of 1 mm, this did not result in an increase in total lesion volume. This finding indicates that the relationship between section thickness and lesion volume on MR images is not linear. Scan-rescan reproducibility was improved by reducing section thickness, at the cost of increased analysis time.
CONCLUSION: This study shows that acquisition of very thin sections increases the sensi-tivity and precision of MS lesion measurement. Serial studies assessing lesion changes over time are needed to define the impact of this increase on sample size requirements for MS treatment trials.
Serial quantification of brain lesion volume in multi-ple sclerosis (MS) can be used to assess disease evo-lution, encouraging its use as an outcome measure in MS treatment trials (1–4). However, it has become clear that a substantial proportion of white matter disease is not detectable on standard 2D conventional spin-echo (CSE) sequences with 5-mm-thick sections (5–8) and that this undetected lesion load might be important in functional terms (9).
One approach to increasing lesion detection is to increase spatial resolution in the section-select
direc-tion by reducing the secdirec-tion thickness (6, 10). Where a lesion occupies only part of a voxel, the contrast relative to background tissue is dependent on both the signal from the lesion and the proportion of the voxel that it occupies (11). With a standard section thickness of 5 mm, small low-contrast lesions occupy-ing only part of a voxel can go undetected. A further effect of this volume averaging is blurring of the apparent border of a lesion, if its surface is not along the section-select direction, even if a biologically sharp boundary exists (6, 12). This loss of edge defi-nition leads to difficulty in defining lesion boundaries in a reproducible manner.
Reducing the section thickness from 5 mm to 3 mm has been shown to increase the MR-visible lesion volume by about 9% with a standard CSE sequence (6), and it may increase the precision of volume mea-surement (13). However, it has not yet been possible to obtain adequate 2D CSE images down to very thin sections, since the necessary scan time becomes pro-hibitive and the poor signal-to-noise ratio (SNR) un-acceptable. Three-dimensional MR sequences allow
Received January 22, 1998; accepted after revision June 17. From the NMR Research Unit, Institute of Neurology, Queen Square, London (P.D.M., N.T., G.J.M.P., G.J.B., D.G.M., P.S.T., D.H.M.); and the Lysholm Radiological Department, National Hospital for Neurology and Neurosurgery, Queen Square, London (I.F.M.).
Address reprint requests to Professor D. H. Miller, NMR Re-search Unit, Institute of Neurology, Queen Square, London WC1N 3BG, United Kingdom.
©American Society of Neuroradiology
acquisition of thinner sections with acceptable acqui-sition times and SNR. When such a sequence was applied to the detection of contrast-enhancing le-sions, detection rates were shown to be 12% higher at a 1-mm section thickness than at a 3-mm thickness (14). An alternative approach to increasing lesion detec-tion is to increase lesion-to-background contrast at a given section thickness. The 2D fast fluid-attenuated inversion recovery (fast-FLAIR) sequence produces higher contrast and therefore greater conspicuity of cortical and subcortical lesions than does a standard CSE sequence (7, 15, 16), albeit with a reduced sen-sitivity to lesions in the posterior fossa (7), and may yield a higher overall brain lesion volume than a standard CSE sequence at the same 5-mm section thickness (7). The reproducibility of lesion volume quantification with fast-FLAIR is as good as (16) or better than (13, 15) with CSE, probably owing to increased lesion-background contrast and better edge definition.
We initially experimented with a 3D fast spin-echo (FSE) sequence but found the results unsatisfactory because of high CSF signal and increased signal at CSF-tissue interfaces. We found that the 2-mm 2D fast-FLAIR sequence enabled us to detect more brain lesions than the 1.5-mm 3D FSE sequence (17). With 2D fast-FLAIR, sections thinner than 2 mm were not possible owing to unacceptable SNR and acquisition time. We therefore developed a 3D fast-FLAIR se-quence for this study, combining the greater lesion conspicuity of the FLAIR sequence with the higher spatial resolution and SNR per unit time possible with 3D imaging (18). This provided an opportunity to study the impact of increasing resolution down to a section thickness of 1 mm on MR-derived lesion vol-umes. We acquired 3D fast-FLAIR images at three section thicknesses (5 mm, 3 mm, and 1 mm). Our aim was to study the impact of decreasing section thickness on both the MR-visible lesion volume and the reproducibility of volume measurement.
Methods
Patients
We studied eight patients (four men and four women) with clinically definite MS (19). Their mean age was 45 years (range, 31 to 56 years), mean disease duration was 16 years (range, 8 to 26 years), and mean Expanded Disability Status Scale (EDSS) score (20) was 4.9 (range, 1.0 to 8.5). Three patients had relapsing-remitting MS and five had secondary-progressive MS. Written informed consent was obtained before entry into the study.
MR Imaging
Patients were imaged during a single visit, in two sessions separated by an interval of 5 minutes. A 1.5-T imager was used to acquire the images with contiguous interleaved slabs/sec-tions in the axial plane. During the first session, an oblique axial dual-echo CSE sequence was used with contiguous 5-mm-thick sections and the following parameters: TR/TE, 2000/ 34,90; matrix, 2563256; and field of view (FOV), 25 cm. The 3D fast-FLAIR images were then obtained with axial sections in order of decreasing section thickness (5 mm, 3 mm, and 1 mm). To allow meaningful comparison between the 3D fast-FLAIR sequences, the following parameters were used at all section thicknesses: TR/TE, 4600/140; inversion time (TI), 1740; echo train length, 24; FOV, 25 cm; and matrix size, 2563 192. For the 5-mm and 3-mm sequences, acquisition time was 12 minutes, and 48 sections were acquired. The 1-mm sequence required 18 minutes and produced 144 sections.
Next, the patient was removed from the imager for 5 min-utes and then, during a second session, a further set of 3D fast-FLAIR images was obtained at each section thickness. Repositioning for the second session was performed according to a standardized protocol developed by this unit (21).
Image Analysis
The images obtained at each section thickness for each patient were first assessed in isolation, in randomized order, and with a delay of at least 1 week between assessing any set of images of the same patient. Lesions were identified and marked on a hard copy using a consensus approach by two of the authors over a 3-month period. Prior to this study, 10 healthy control subjects had been imaged with the 3D fast-FLAIR sequence using a section thickness of 1.5 mm to iden-tify areas of hyperintensity that could be confused with lesions in the patient group. The normal findings (Fig 1) were 1)
increased signal around the occipital poles of the lateral ven-tricles; 2) small areas of increased signal around the temporal horns; 3) a thin rim of high signal around the remainder of the third and lateral ventricles; 4) areas of high signal at the frontal poles of the lateral ventricles; 5) symmetrical areas of increased signal in the posterior limbs of the internal capsules; and 6) slightly increased signal in the posterior centrum semiovale. When identifying lesions on the 3D fast-FLAIR images, such “normal” areas of higher signal were excluded unless they were particularly prominent and asymmetrical. The aim of this con-servative approach in these regions was to minimize the poten-tial for tissue misclassification. Lesion volumes were quantified by a single experienced observer using a semiautomated local thresholding technique incorporating a contour-based algo-rithm (22, 23). The time taken to perform the quantitative analysis at each section thickness was recorded. Only lesions marked on the hard copy were included in the analysis. Lesion volume was calculated automatically as the total lesion area in the imaging plane multiplied by the section thickness.
The 3D fast-FLAIR images of each patient obtained during the first session were then reviewed side by side by the same two observers. The images with 5-mm section thickness were compared with those with 3-mm thickness, and all lesions marked on just one image were identified. The same procedure was adopted for comparison of the 3-mm and 1-mm images. The volume of these “missed” lesions was quantified from measurements previously obtained using the semiautomated segmentation technique.
Finally, 32 lesions more than 1 cm in diameter were ran-domly selected to provide an estimate of both contrast-to-noise ratio (CNR) and contrast ratio (CR) at each section thickness. The CNR was calculated according to the following formula: CNR5(SIlesion2SINAWM)/noise, where SI represents signal intensity and NAWM indicates an area of normal-appearing white matter adjacent to the lesion. Noise was estimated from a region of the FOV not containing tissue and not contami-nated by phase-encoding artifacts. The CR was calculated as a measure of lesion conspicuity according to the following for-mula: CR5(SIlesion2SINAWM)/SINAWM.
Statistical Analysis
The mean of the two lesion volumes at each section thick-ness was used to compare the effects of section thickthick-ness, as this approach should reduce the impact of random measure-ment error. Friedman two-way analysis of variance (ANOVA) was used to assess the significance of differences in lesion volume between the images. Post hoc comparisons were per-formed using the Wilcoxon signed rank test. The same statis-tical approach was used to assess differences in time taken to quantify lesion volumes at each section thickness. Scan-rescan reproducibility was assessed as the percentage of agreement between the lesion volumes obtained from the first and second sessions (13).
Results
The lesion volumes obtained with the different im-ages (Table 1 and Fig 2) were significantly different (P, .001). The mean lesion volumes obtained with the 5-mm 3D fast-FLAIR sequence were 22% greater (range, 10% to 48%) than those identified for the corresponding 5-mm CSE sequence (P 5 .01). Re-ducing the section thickness from 5 mm to 3 mm increased derived lesion volumes for all but one pa-tient by an average of 8.1% (range,22.9% to 19.2%). This difference was statistically significant (P,.05). In contrast, reducing the section thickness further from, 3 mm to 1 mm, did not yield an additional
increase in total lesion volume (P 5 .9). The mean volume obtained with the 1-mm 3D fast-FLAIR se-quence was on average 31% higher (P5.01) and the 3-mm 3D fast-FLAIR sequence 32% higher (P5.01) than with the standard 5-mm CSE sequence.
[image:3.587.306.533.86.147.2]The effects of progressive reduction in section thickness on lesion detection are shown in Table 2. Comparing the 5-mm and 3-mm images side by side, we identified 170 lesions on only the 3-mm images, whereas just 11 lesions were marked exclusively on FIG 2. The effect of sequence/section thickness on total lesion volume. For each patient, the mean volume of the two measure-ments (scan and rescan) is shown for each section thickness of the fast-FLAIR sequence to reduce the impact of random mea-surement error.
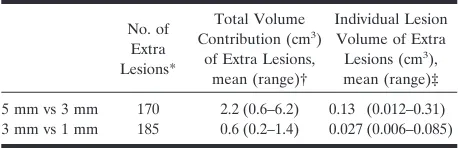
TABLE 2: The effects of progressive reduction in section thickness for the 3D fast-FLAIR sequences
No. of Extra Lesions*
Total Volume Contribution (cm3)
of Extra Lesions, mean (range)†
Individual Lesion Volume of Extra Lesions (cm3),
mean (range)‡
5 mm vs 3 mm 170 2.2 (0.6–6.2) 0.13 (0.012–0.31)
3 mm vs 1 mm 185 0.6 (0.2–1.4) 0.027 (0.006–0.085)
* The number of additional lesions identified by progressive reduc-tion in secreduc-tion thickness. Eleven lesions were marked on the 5-mm sequence and not on the 3-mm sequence, and a further 11 lesions were marked at 3 mm and not at 1 mm.
† The volume contribution of these additional lesions to total lesion volume per patient.
[image:3.587.306.535.203.386.2]‡ The individual lesion volume of these additional lesions.
TABLE 1: Lesion volumes (cm3) obtained with the each sequence/
section thickness
Sequence/Section Thickness Mean Median Range
5-mm CSE 19.2 17.8 5.5–47.3
5-mm fast-FLAIR 23.4 21.7 8.1–52.2
3-mm fast-FLAIR 25.3 22.6 9.7–60.4
1-mm fast-FLAIR 25.1 22.6 10.1–63.6
[image:3.587.306.535.474.548.2]the 5-mm images. When only lesions seen at both 5 mm and 3 mm section thicknesses were included in the lesion volume, thereby excluding the additional contribution of lesions identified only at 3 mm, the mean lesion volumes at 5 mm and 3 mm were 23.0 cm3 and 23.1 cm3, respectively (P 5 .7). A similar
side-by-side comparison of the 3-mm and 1-mm im-ages revealed that 185 lesions were seen on only the 1-mm sequence, whereas just 11 lesions were identi-fied exclusively on the 3-mm sequence. Considering only those lesions identified on both 3-mm and 1-mm sequences, lesion volumes were 25.3 cm3 and 24.7
cm3, respectively; a difference that approached
statis-tical significance (P5.07).
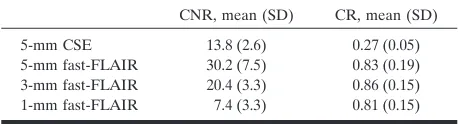
The values for CNR and CR are given in Table 3. The 3D fast-FLAIR sequence showed significantly higher CR than the 2D 5-mm CSE sequence at each section thickness (P,.001). There was no significant difference in CR at different section thicknesses on fast-FLAIR images (P 5 .4). However, the CNR became progressively worse as section thickness was reduced (P , .001), being approximately propor-tional to section thickness, as would be expected.
The mean operator times required to perform the quantification on the 3D fast-FLAIR images at 5 mm, 3 mm, and 1 mm were 31 minutes (SD, 9.9), 58 minutes (SD, 16.2), and 154 minutes (SD, 30.9), re-spectively. These differences were significant overall (P, .001) as well as for each decrement in section thickness (P, .05).
The mean scan-rescan agreement for derived le-sion volumes was 91% (range, 87% to 97%) at the 5-mm section thickness, 95% (range, 92% to 98%) at 3 mm, and 98% (range, 93% to 100%) at 1 mm.
Discussion
Several previous studies have addressed the impact of section thickness on both the sensitivity and preci-sion of MS lepreci-sion volume quantification (6, 10, 13). Progressive reduction in section thickness from 15 mm to 3 mm on T2-weighted images has been shown to increase the number of detected lesions and lesion volume (6). In one study, a gain in derived lesion volume of 9% was produced by reducing the section thickness from 5 mm to 3 mm (6), and the authors of that study postulated a linear relationship between section thickness and MR-visible lesion volume,
esti-mating that a further reduction in section thickness might produce up to a 20% increase in MR-detect-able lesion volume.
Our results are similar, with an increase in detected lesion volume of 8% with a reduction in section thick-ness from 5 mm to 3 mm. We found that this increase was a consequence of the greater sensitivity of the 3-mm sequence to small, generally low-contrast le-sions obscured by volume averaging at a 5-mm section thickness. Comparing the images obtained with 3-mm and 1-mm section thicknesses, we found a further similar increase in the number of detectable lesions. However, the mean individual volume of lesions de-tected by going from 5 mm to 3 mm was more than four times that observed when decreasing from 3 mm to 1 mm (Table 2); thus, the extra contribution of the small lesions detected at 1 mm to total lesion volume was extremely small. It is therefore not surprising that reducing the section thickness from 3 mm to 1 mm did not increase the overall lesion volume. Indeed, further analysis of our data shows that when consid-ering only those lesions identified at both 3 mm and 1 mm section thicknesses, the derived lesion volumes at the 1-mm thickness were generally smaller.
Several possible factors may have contributed to these findings. First, the lower SNR and CNR at the lesser section thickness may have altered the observ-ers’ perception of lesion boundaries. A previous study has suggested that as lesion contrast is reduced, the reported volume decreases (12). Second, differences in volume averaging may be important. For a lesion of similar diameter to the section thickness, volume av-eraging will tend to cause an overestimation of vol-ume (6), while at lesser thicknesses this effect would diminish. The impact of this will depend on the size distribution of lesions for an individual patient, but this averaging may have been more apparent with the 3-mm acquisitions. Third, we found that with the increased spatial resolution at 1 mm, several lesions that appeared as confluent areas of high signal at 3 mm were, at a section thickness of 1 mm, in fact seen to comprise several smaller, discrete lesions (Fig 3). This effect would result in smaller volumes being measured for such regions at very small section thick-nesses. Because such confluent regions can make a substantial contribution to total lesion volume, even if this change in perception of lesion boundaries at a 1-mm section thickness occurred only rarely, it might be sufficient to produce an apparent difference in total measured lesion volume.
It might be concluded from our results that lesion volumes derived at 3 mm and 1 mm are not substan-tially different and that therefore no advantage in terms of sensitivity is conferred by reducing the sec-tion thickness beyond 3 mm. However, although total lesion volumes were not different, several small, low-contrast lesions were identified only on the thinnest section acquisitions. Such small lesions might be im-portant in functional terms: it is conceivable that gradual accumulation of a large number of these small lesions in a strategic pathway could result in a slow progression in disability (9). A particular
advan-TABLE 3: Contrast to noise (CNR) and contrast ratios (CR) for each sequence
CNR, mean (SD) CR, mean (SD)
5-mm CSE 13.8 (2.6) 0.27 (0.05)
5-mm fast-FLAIR 30.2 (7.5) 0.83 (0.19)
3-mm fast-FLAIR 20.4 (3.3) 0.86 (0.15)
1-mm fast-FLAIR 7.4 (3.3) 0.81 (0.15)
[image:4.587.53.282.85.147.2]tage of increased section resolution may be the ability to identify and localize smaller lesions in pathologi-cally eloquent areas, such as the pyramidal tracts. This may yield stronger correlations between MR measures and functional systems scales. Furthermore, it is conceivable, if unlikely, that new treatments may predominantly alter the development of lesions of a particular size or contrast. If a putative drug were to preferentially inhibit the development of small, low-contrast lesions, such a treatment effect might only be seen at high section resolution.
We also found that despite the decreasing CNR as section thickness decreased, the scan-rescan repro-ducibility improved. Several sources of error contrib-ute to scan-rescan variability (4, 24, 25); notably, dif-ferences in the extent of motion and flow artifacts, inconsistent patient positioning that causes variable volume averaging (26–28), and observer inconsis-tency in application of the quantitative technique (measure-remeasure variability) (13, 23, 28, 29). Scan-rescan reproducibility is a more meaningful re-flection of the variability that might be found in a longitudinal study than assessment of measurement error on a single scan alone. As section thickness decreases, the impact of suboptimal patient reposi-tioning on lesion volume measurements should be-come less important, since the reduction in volume averaging should allow more consistent identification of lesion boundaries.
Against the increased detection of small lesions and greater reproducibility achieved by reducing sec-tion thickness must be weighed the increase in both acquisition time and loss of SNR (Fig 3). Further-more, there is a substantial increase in operator time needed to perform the quantification at very thin sections with the semiautomated technique used in this study. The exact relationship between sensitivity, reproducibility, and sample size requirements for treatment trials is not yet known. It may be possible to
reduce the number of patients and examinations nec-essary to show a significant treatment effect with MR imaging by increasing the sensitivity and reproducibil-ity of quantification with very thin sections. There-fore, the increasing analysis time with thin section thickness acquisition could be at least partially offset by the requirement for fewer patients. This issue will only be resolved when the interaction between mea-surement error and sample size is better defined. However, the quantitative technique used in this study required a mean analysis time of more than 150 minutes per data set at a section thickness of 1 mm. For serial studies involving large numbers of patients, this time requirement will almost certainly preclude the routine incorporation of such a protocol. The much more feasible analysis times for 3-mm-thick sections suggest that this section resolution is more appropriate for studies in which a semiautomated segmentation technique such as this is used. However, several automated techniques are now being devel-oped with the potential for minimal operator inter-vention (30–33). Once such methods are validated in the context of treatment trials, they offer the potential for application to images with 1-mm-thick sections, with the benefits of better sensitivity and less suscep-tibility to repositioning errors.
Conclusion
the continuation of 3-mm-thick sections as the stan-dard of reference will be confirmed.
References
1. Miller DH, Barkhof F, Berry I, Kappos L, Scotti G, Thompson AJ.
MRI in monitoring the treatment of MS: concerted action guide-lines.J Neurol Neurosurg Psychiatry1991;54:683–688
2. Miller DH, Barkhof F, Albert PS, et al.Guidelines for the use of magnetic resonance techniques in monitoring the treatment of MS. Ann Neurol1996;39:6–16
3. Paty DW, Li DKB, The UBC MS/MRI Study Group, the IFNB Multiple Sclerosis Study Group.Interferon beta-1b is effective in relapsing-remitting MS: MRI analysis results of a multicenter, randomized, double blind, placebo controlled trial.Neurology1993; 43:662–667
4. Barkhof F, Filippi M, Miller D, Tofts P, Kappos L, Thompson AJ.
Strategies for optimizing MRI techniques aimed at monitoring disease activity in multiple sclerosis treatment trials. J Neurol
1997;244:76–84
5. Barbosa S, Blumhardt LD, Roberts N, Lock T, Edwards RH.
Magnetic resonance relaxation time mapping in multiple sclerosis: Normal appearing white matter and the “invisible” lesion load. Magn Reson Imaging1994;12:33–42
6. Filippi M, Horsfield MA, Campi A, Mammi S, Pereira C, Comi G.
Resolution dependent estimates of lesion volumes in MRI imaging studies of the brain in MS.Ann Neurol1995;38:749–754 7. Filippi M, Yousry T, Baratti C, et al.Quantitative assessment of
MRI lesion load in multiple sclerosis: a comparison of conven-tional spin echo with fast fluid attenuated inversion recovery.Brain
1996;119:1349–1355
8. Filippi M, Campi A, Dousset V, et al.A magnetization transfer imaging study of normal appearing white matter in multiple scle-rosis.Neurology1995;45:478–482
9. Wang L, Lai HM, Thompson AJ, Miller DH. A survey of the distribution of lesion size in multiple sclerosis: Implications for the measurement of total lesion load.J Neurol Neurosurg Psychiatry
1997;63:452–455
10. Hashemi RH, Bradley WG, Chen DY, et al.Suspected multiple sclerosis: MR imaging with a thin-section fast FLAIR pulse se-quence.Neuroradiology1995;196:505–510
11. Bradley WG, Glenn BJ.The effect of variation in slice thickness and interslice gap on MR lesion detection.AJNR Am J Neuroradiol
1987;8:1057–1062
12. Tofts PS, Barker GJ, Filippi M, Gawne-Cain M, Lai M.An oblique cylinder contrast-adjusted (OCCA) phantom to measure the accu-racy of brain lesion estimation schemes in multiple sclerosis.Magn Reson Imaging1997;15:183–192
13. Filippi M, Rovaris M, Baratti C, et al. Intra and inter observer variability in measuring brain MRI lesion volumes in multiple sclerosis: the contribution of 3 mm-thick slices and fast-FLAIR. In: Proceedings of the International Society for Magnetic Resonance in Medicine.1996;1:540
14. Filippi M, Yousry T, Horsfield M, et al.A high-Resolution three-dimensional T1-weighted gradient echo sequence improves the detection of disease activity in multiple sclerosis.Ann Neurol1996; 40:901–907
15. Bastianello S, Bozzao A, Paolillo A, et al.Fast spin-echo and fast fluid-attenuated inversion-recovery versus conventional spin-echo
sequences for MR quantification of multiple sclerosis lesions. AJNR Am J Neuroradiol1997;18:699–704
16. Gawne-Cain ML, O’Riordan JI, Coles A, Newell B, Thompson AJ, Miller DH. MRI Lesion Volume Measurement in MS and its correlation with disability: a comparison of fast FLAIR and spin echo sequences.J Neurol Neurosurg Psychiatry1998;64:197–203 17. Tubridy N, Barker G, MacManus DG, et al.Optimization of
non-enhanced magnetic resonance imaging for the detection of lesions in multiple sclerosis: a pilot study to compare five MRI sequences. In:Proceedings of the International Society for Magnetic Resonance in Medicine.1997;1:656
18. Barker GJ. 3D fast FLAIR: a CSF-nulled fast spin echo pulse sequence.Magn Reson Imaging(in press)
19. Poser CM, Paty DW, Scheinberg L, et al. New diagnostic criteria for multiple sclerosis: guidelines for research protocols.Ann Neurol
1983;13:227–231
20. Kurtzke JF.Rating neurologic impairment in multiple sclerosis: an expanded disability status scale (EDSS).Neurology1983;33:1444– 1452
21. Gallagher HL, MacManus DG, Webb SL, Miller DH.A reproduc-ible repositioning method for serial magnetic resonance imaging studies of the brain in treatment trials for multiple sclerosis.J Magn Reson Imaging1997;7:439–441
22. Plummer DL.Dispimage: a display and analysis tool for medical images.Riv Neuroradiol1992;5:489–495
23. Grimaud J, Lai M, Thorpe J, et al.Quantification of MRI lesion load in MS: a comparison of three computer-assisted techniques. Magn Reson Imaging1996;14:495–505
24. Filippi M, Horsfield MA, Bressi S, et al.Intra- and interobserver reproducibility of brain MRI lesion volume measurements in mul-tiple sclerosis: a comparison of techniques.Brain1995;118:1593– 1600
25. Plante E, Turkstra L.Sources of error in the quantitative analysis of MRI scans.Magn Reson Imaging1991;9:589–595
26. Gawne-Cain ML, Webb S, Tofts P, Miller DH. Lesion volume measurement in MS: how important is accurate repositioning?J Magn Reson Imaging1996;6:705–713
27. Rovaris M, Gawne-Cain ML, Sormani MP, et al. The effect of repositioning errors on brain MRI lesion load measurements in multiple sclerosis.In:Proceedings of the International Society for Magnetic Resonance in Medicine.1997;1:650
28. Simon JH, Scherzinger A, Raff U, Li X.Computerized method of lesion volume quantification in multiple sclerosis: error of serial studies.AJNR Am J Neuroradiol1997;18:580–582
29. Wicks DAG, Tofts PS, Miller DH, et al.Volume measurement of multiple sclerosis lesions with magnetic resonance images: a pre-liminary study.Neuroradiology1992:34;475–479
30. Mitchell JR, Karlik SJ, Lee DH, Fenster A. Computer-assisted identification and quantification of multiple sclerosis lesions in MR imaging volumes in the brain.J Magn Reson Imaging1994;4: 197–208
31. Clarke LP, Velthuizen RP, Camacho MA, et al.MRI segmentation: methods and applications.Magn Reson Imaging1995;13:343–468 32. Gonzalez CF, Vinitski S, Lublin F, et al.Tissue segmentation and
volumetric measurements as a marker of disease activity in MS (abstr).Neurology1995;45(Suppl 4):A232