EEMCS / Electrical Engineering
Control Engineering
Towards a detection and recognition
system for freshwater fish
Jeroen Broersen
MSc report
Supervisors: Prof.Dr.Ir. P.P.L. Regtien M. Wijnberger, Witteveen+Bos Dr. G. Kruitwagen, Witteveen+Bos Dr.Ir. F. van der Heijden
August 2009
Samenvatting
FishFlow Innovations is een bedrijf dat onder andere vispassages ontwerpt en produ-ceert. Om er achter te komen hoeveel en welke soorten vissen gebruik maken van deze vispassages moeten deze geteld en herkend worden. Om de vissen te tellen en te classi-ficeren per soort wordt tegenwoordig meestal gebruik gemaakt van een fuik om vissen te vangen, en later te tellen. Omdat dit erg arbeidsintensief is, zou het nuttig zijn als dit geautomatiseerd kan worden. Dit onderzoek is erop gericht om uit te zoeken wat de mogelijkheden zijn voor een automatisch systeem dat vissen kan tellen en het soort vis kan herkennen.
Om een methode voor het herkennen en tellen van vissen te vinden, is uitgebreid gekeken naar de verschillende mogelijkheden om vissen te detecteren, en te herkennen per soort. Er is gekeken naar vele methoden waaronder sonar, elektrische metingen, optische detectie, straling en temperatuur metingen.
Met name elektrische metingen, en optische meetmethoden kwamen hierbij positief uit de bus, en zijn daarom ook verder onderzocht.
Bij de elektrische methoden zijn resistief en capacitief verder onderzocht. Simula-ties en experimenten toonden aan dat capacitief niet handig is voor in de praktijk. De resistieve methode daarentegen, die werkt door het verschil in geleidbaarheid van wa-ter en vis maakt blijkt wel mogelijkheden te hebben om vissen te tellen.
Soort herkenning op basis van resistieve tomografie is ook onderzocht met simu-laties en experimenten. Hieruit bleek dat het niet haalbaar is om kleine details zoals stekels te herkennen met behulp van tomografie. Daarom is tomografie niet geschikt voor soort herkenning.
Bij de optische methoden is met name gekeken naar het gebruik van camera’s. Hier-voor is in Enschede bij de Universiteit met een camera gekeken hoe goed het mogelijk is om in door water te kijken, en overgangen tussen licht en donker te zien. Verder is er in Roermond bij een bestaande vispassage een opstelling met camera’s geplaatst waarbij gekeken is of het mogelijk is om vissen te detecteren. Uit deze experimenten is gebleken dat het mogelijk is om onder water een silhouet te zien. De opstelling in Roermond heeft helaas weinig resultaten opgeleverd in de vorm van zichtbare vissen. Wel heeft de test in Roermond inzicht opgeleverd in de belichting, en de benodigde framerate.
Voor verder onderzoek wordt geadviseerd om uit te zoeken of andere belichtings-methoden bij cameratesten betere resultaten opleveren. Ook is het verstandig om voor water van verschillende bronnen te kijken hoe goed het mogelijk is met een camera te kijken.
Abstract
FishFlow Innovations is a company that invents and produces among other things fish passages. To determine the effectiveness of such passages, it is necessary to continu-ally count and recognize passing fish. Up to now, counting and classification of fish is mainly done by using a fyke net. Because this process is very labour-intensive, possi-bilities for electronic counting and recognition are investigated.
In this project, various methods for automatically counting and recognising pass-ing fish has been studied, such as sonar, vision, impedance measurements, optical fish detection and temperature measurements. Especially optical and electrical impedance measurement methods appeared to have good prospectives and have, therefore, been investigated in more detail.
Two electrical measurement methods have been studied in detail: capacitive and resistive. Simulations and experiments showed that capacitive measurement are not feasible in practice. The resistive method, which works by using the difference in con-ductivity between fish and water proves to be useful to detect fish.
Fish species recognition using impedance tomography is also studied. An experi-ment and simulations showed that detection of fish species by tomographic measure-ments is not feasible. Small details, such as prickles are almost impossible to detect using these measurements. However, the presence of a fish can be detected using this resistive method.
For optical methods, especially the use of cameras is studied. In order to test these optical methods, an experiment is carried out in Enschede at the University. The goal of this experiment was to find out if it is possible to get enough detail for fish species recognition when looking through a layer of water. Furthermore a test setup is built in a real fish passage from FishFlow Innovations in Roermond. This setup has unfor-tunately produced little results in counted fish. However, this setup has brought some insight in the lighting, and the necessary frame rate.
For further research, it is recommended to investigate different setups of light sources for the camera setup. It is also recommended to research the effects of water for more sources (e.g. other rivers).
Preface
In front of you is the MSc report of Jeroen Broersen. This report is the result of my master’s project about fish counting. The project is carried out in cooperation with Witteveen+Bos, FishFlow Innovations, and the University of Twente.
I would like to thank my supervisors Paul Regtien, Marcel Wijnberger, and Guus Kruitwagen for their support. Also thanks go to Alfred de Vries for help with the setups at the University.
Furthermore thanks to my fellow students at Control Engineering for the nice times and useful discussions. I would also like to thank the people from Witteveen+Bos and Fishflow that I have met for the nice times, and useful conversations.
Jeroen
Contents
1 Introduction 1
1.1 Background 1
1.2 Goals of the assignment 1
1.3 Report outline 1
2 Currently used methods 3
2.1 Introduction 3
2.2 Fyke 3
2.3 Vaki Riverwatcher Fish Counter 3
2.4 Fish counter 3
2.5 Didson 4
3 Possible fish counting methods 5
3.1 Introduction 5
3.2 Ways to detect or recognise fish 5
3.2.1 Acoustical 5
3.2.2 Optical 8
3.2.3 Resistive 12
3.2.4 Capacitance 15
3.2.5 Inductive 17
3.2.6 Radiation 19
3.2.7 Magnetic 21
3.2.8 Thermal 22
3.3 The methods compared 23
3.4 Conclusions about the possible measurement methods. 25
4 Optical methods 27
4.1 Introduction 27
4.2 Background 27
4.3 Camera tests at the University of Twente 29
4.3.1 Introduction 29
4.3.2 The setup 29
4.3.3 Processing the images 30
4.3.4 Analysing the results 31
4.3.5 Conclusions about the camera experiments at the University of
Twente 37
4.4 The camera setup in Roermond 37
4.4.1 Introduction 37
4.4.2 The first setup 37
4.4.3 Results from the first setup 39
4.4.5 Results from the second setup 42 4.4.6 Conclusions about the camera setup in Roermond 45 4.5 Conclusions about optical fish detection 45
5 Electrical methods 47
5.1 Introduction 47
5.2 Capacitive 47
5.2.1 Background 47
5.2.2 Experiments for capacitive measurement 47 5.2.3 Simulations to determine possibility of measuring capacity 49 5.2.4 Conclusions for capacitive measurements 52
5.3 Resistive 52
5.3.1 Background 52
5.3.2 Simulations of a resistive fish counter 52 5.3.3 Conclusions for resistive measurements 56
5.4 Tomography 56
5.4.1 Background 56
5.4.2 Simulation to determine effects of electrode size 57 5.4.3 Simulation to determine effects of fish size 61 5.4.4 Simulation to determine effect of fish position 64 5.4.5 Experiments for electrical fish detection 68
5.4.6 Conclusions for tomography 76
5.5 Conclusions about electrical measurements 77
6 Conclusions and recommendations 79
6.1 Conclusions 79
6.2 Recommendations 80
1 Introduction
1.1
Background
In the Netherlands there are around ten thousand weirs and more than 3000 pumping stations to manage the water level and keep the polders dry. For a fish it is often not possible to pass such an obstacle. A weir can be too high to pass, and a pumping station can cut a fish into pieces. To give the fish the possibility to get to the other side of the pumping station or weir, sometimes alternative routes for a fish are constructed. One of the companies that makes fish passages is FishFlow Innovations, which is a cooperation between Witteveen+Bos and Gerard Manshanden. FishFlow Innovations is a company that invents and build products for bottlenecks in fish migration. For example fish guidance systems to let the fish pass a factory that gets cooling water from a river, or a fish passage to let fish pass a pumping station without getting through the moving parts of the pump that would kill the fish.
Because building such a fish passage is expensive, it is important to know if such alternative route is actually used by fishes. Therefore the number of fish passing a passage should be monitored.
In the Netherlands the most common method for determining how many fish use a fish passage is to place a fyke at the end of the passage. Every day the fykes are lifted and the length and species of the caught fish is determined.
This way of determining the number of passing fish and detecting their species and length is a very labour-intensive way of counting fish.
Therefore a lot of labour could be saved if there was a way to automatically count the number of passing fish, and recognise which fish species it is and what size the fish has.
1.2
Goals of the assignment
The goal of this assignment is to find out which measurement methods can be used to detect a passing fish and recognise the species of the passing fish. Therefore some liter-ature study to currently used and possible other methods should be carried out. This should be followed by some experiments to verify if a chosen measurement method can work in practice.
1.3
Report outline
2 Currently used methods
2.1
Introduction
In order to know how many fish pass a fish passage, it is necessary to count the fish. There are already some methods used for counting the number of passing fish. This chapter describes the methods that are currently in use.
2.2
Fyke
A method that is currently used to count how many fish are passing a passage is to place a fyke at one end of the passage. The net is emptied every day and the number of fish, the fish species, and the length are documented. Using this method it is possible to get information about the number and species of the caught fish, but it is not possible to get information about the exact time a fish was caught in the fyke. It also makes it impossible for fish to pass a passage in two directions, because one of the entries is blocked by the fyke.
2.3
Vaki Riverwatcher Fish Counter
The Vaki fish counter is a fish counter from the Icelandic company Vaki. It can count fish by a light valve. If a fish passes the counter, the light is blocked, which indicates that there is a fish. This way of detecting fish is schematically drawn in figure 2.1. The Vaki fish counter has two rows of sensors next to each other, each row has 96 sensors. This type of fish counter is used in different countries, for example Iceland, Sweden, Denmark, and the USA.
However this method is not used in the Netherlands. This is because in the Netherlands the water is often too turbid to let the counter function correctly. Another problem is that the fish counter is most used for counting salmons, while in the Netherlands the fish are often a little smaller, which makes them more difficult to be detected by the fish counter.
The Vaki fish counter can only count fish, and get a rough silhouette of the fish, however it has no automatically species recognition.
2.4
Fish counter
Figure 2.1: The detection of a fish by the Vaki fish counter works like a light valve. For the Vaki 2 lines of 96 receivers and 2 lines of trans-mitters are placed. In this figure a schematic view of how a light valve works for detecting fish. The fish blocks the light of the center 4 light sources. Therefore it is possible to get a silhouette of the fish shape.
Because the voltages at the two outer electrodes are out of phase, it can be detected between which electrodes the resistance is lowering.
With this fish counter it is not possible to recognise the fish species, but it is possible to count the fishes, and estimate the length.
2.5
Didson
3 Possible fish counting methods
3.1
Introduction
In order to develop a fish counting device, it is necessary that fish can be detected. The fact that there are already fish counting devices, as described in chapter 2, indicates that it is possible to detect fish.
Because not all methods that could possibly be used for fish counting are described in the previous chapter, this chapter describes different methods that could possibly be used for counting fish.
The measurement methods are divided in a number of categories based on the physical properties of the fish that are used. Every category is written in its own section, which is for most of the categories divided in different subsections describing multiple meth-ods for counting fish using the same physical property.
3.2
Ways to detect or recognise fish
3.2.1 Acoustical
When measuring acoustically, a sound pulse is emitted to the water. Sound travels at approximately 1500 m s−1through the water. When the sound wave hits a fish or some other object, it will be partly reflected. A part of the reflected wave will return to the transducer. This part is then recorded and analysed. The time the sound is on its way to the fish and back to the transducer gives information about the distance from the transducer to the fish. When there are multiple receivers close to each other, the phase difference between the received signals gives information about the direction in which the fish is located.
Sonar
Fish detection using sonar is already used in some experiments [2] [37].
With sonar it is possible to find the distance from the fish to the sonar. If multiple re-ceivers are used, it is also possible to find the direction where the fish is positioned. This is done by emitting a pulse and analysing the reflected signal. The phase differ-ence between the different receivers gives information about the direction in which the fish is positioned in comparison to the receiver. It is also possible to estimate the size of the fish by measuring the strength of the returned signal [18].
When the speed of the fish is also important to measure,this can be measured at two different methods. It is possible to detect the speed by measuring the time between two measurements, and the change in fish location at these two measurements, but it is also possible to use the Doppler effect to determine the fish speed.
image of some object[54], [40]. Unfortunately this last method is only possible if the object to detect does not move.
When there are multiple fish close to each other, detecting individual fish can be impos-sible because the echoes will (partly) overlap. Other difficulties can be caused by echos that are not from fish but for example from the bottom, the water surface, or the wall of a pipe .
Figure 3.1: This image shows a fish moving in front of the sonar (the curved path), along with some reflections (horizontal lines)from the side, and bottom of the river. The horizontal axis represents the ping (number of the emitted pulses, and is linear with time). The vertical axis represents the distance from the sonar de-vice. It can be seen that the fish does not follow a straight path. Image taken from [18].
Pros:
- Fish detection possible in turbid water. - Possible in environments without light.
Cons:
- When fish are close to each other the echos can overlap making it difficult to distinguish individual fish.
- Echos from the pipe can interfere with echos from the fish. - When there are a lot of air bubbles, the image will be blurred.
- The noise depends a lot on uncontrollable variables like rain and waves. [2]
Dual-frequency identification sonar (DIDSON)
The Didson is a Dual-frequency identification sonar produced by the company Sound Metrics.
used, or in 48 steps of 0.6◦if the 1.0 MHz wave is used. This means that the total view-ing angle in horizontal direction is 28.8◦, the vertical angle is not divided in different steps and is 14◦. With a Didson it is possible to get high quality images in turbid water. The Didson has also software to count fish, track fish, and estimate the length of a fish [35]. An example of an image taken with a Didson is shown in figure 3.3, in this image the fish are clearly visible. However the shown fish are relatively large with lengths of over 50 cm. For fish detection in the Netherlands also the small fish of 10 centimetre needs to be counted. It is possible to detect objects of 5 cm [1], but the resolution of the image is probably too low for species recognition.
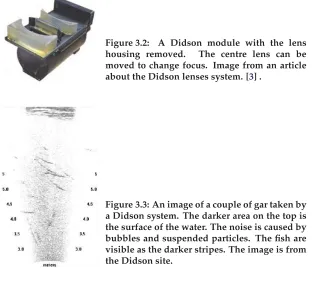
Figure 3.2: A Didson module with the lens
housing removed. The centre lens can be
moved to change focus. Image from an article about the Didson lenses system. [3] .
Figure 3.3: An image of a couple of gar taken by a Didson system. The darker area on the top is the surface of the water. The noise is caused by bubbles and suspended particles. The fish are visible as the darker stripes. The image is from the Didson site.
Pros:
- Good image quality for large fish.
- Information can easily be interpreted by human (nice for testing an auto-matic counter).
- Didson software can already count fish as good as visual observation for salmon-sized fish.[23]
Cons:
- Maybe problems from echos when used inside a metal pipe. [34]. - No color information (color can be useful for species recognition). - Length estimates give very disparate results [11].
3.2.2 Optical
By optical measuring, measurement methods are meant that use some kind of light in order to detect or recognise fish. This can for example be light that is coming from the sun, reflected by a fish, and captured by a camera. This is of course not possible during night, but it is also possible to use a light bulb or other light source. In this case the fish is detected because it reflects light. Another possibility for optically detecting fish is to use an array of LEDs and an array of receivers and check if there is something blocking the path between the LED and the receiver. In this case the fish is detected because it blocks light.
Camera
With a camera it is possible to take a lot of pictures from swimming fish after each other. After the pictures are stored, some computer algorithm can be used to analyse the im-ages, and decide if there are fish in the images or not. The camera can only capture images of the fish if the fish is affecting light. Therefore the area in which the fish is swimming should be illuminated. The light source can for example be the sun, a light bulb or some infra-red light source. If the light is placed on the wall opposite to the camera, the silhouette of a fish can be detected because the fish blocks the light. If the light source is placed on the same side as the camera, the fish can be detected because it reflects light.
Unfortunately the light is not only reflected or blocked by the fish, but may also be affected by the sand grains or other turbid objects in the water. Therefore it is not pos-sible to look very far into the water. So the fish should always be relatively close to the camera.
Cameras are often used for surveillance purposes, for example in stores, streets, for traffic safety etc, or for product inspection in industry. Therefore there is already a lot of research carried out for detecting moving [38] [48] [50], or stationary[46] [47] [55] objects.
Cameras are also used for experiments concerning detecting or recognising fish species. Some systems are more based on the shape of fish [28] [57] [29] [12] [56] where other systems are more interested in patterns of the fish (such as stripes, or spots) [8] [44]. However the experiments are not carried out in riverine water, but only in laboratory setups, or fish farms, where the water quality is more controllable.
Pros:
- Easy to manually check the results (a human is used to look at optical im-ages).
Cons:
- Difficult to estimate the size when distance to the fish is unknown. - Not much color-information because of the water.
- No clear image in turbid water
- No imaging possible without proper lighting.
Stereo camera
[image:17.612.137.236.348.532.2]With two cameras it is possible to get some 3D information about the fish. The biggest problem is that in order to get 3D information, some spots must be recognised on both images. This can be difficult if the water is very turbid. There is already some research carried out about fish detection and size estimation using stereo vision [43] [9] showing that it is often (73% success rate) possible to detect fish in images from both camera’s when the water is clear.
Figure 3.4: The stereo camera setup as used in [43]. With the 2 cameras it is possible (if the water is clear enough) to detect the 3D position of the fish. It is also possible to detect some of the 3D direction of the fish.
Pros:
- 3D information about the fish position - Possible to get the fish size.
Cons:
- Problems when the water is very turbid, because the images will be too dif-ferent to find corresponding spots in the image.
- Not each point is suitable for template matching or cross correlation. In areas with little contrast stereo matching is unreliable or even impossible[13].
TOF camera
A TOF (time of flight) camera is an optical camera which uses the time of flight from the camera to the fish and back to the camera to obtain depth information about an image. In order to get this information there are light sources (mostly infra-red) placed around the camera which transmit light modulated at a high frequency (e.g. 20 MHz). The camera receives the light that is reflected by some object, but because there is some distance between the object and the camera and the light is travelling at approximately 300 000 km s−1, a phase difference exists. This phase difference is used to calculate the distance to the object. In air there are some experiments carried out with good results [16].
However, there is not much information about using these cameras in underwater sit-uations. This is probably caused by the short time 2D optical TOF cameras exists and are used . The first report about the building of an TOF camera found dates from 2001 [27].
Mesa-imaging, the manufacturer of the SR3000 TOF camera, has carried out some ex-periments, and concluded that it is possible to measure in very clear water, but as soon as there are some particles in the water, the measurement of the more distant objects gets drown by the strong reflections of the nearby particles. Because there are almost always some particles between the camera and the fish, it will be almost impossible to get 3D information about the fish.
Figure 3.5: This camera is a SR3000 TOF
cam-era. The LEDs that are visible around the
lens are used to create the light modulated at 20 MHz. The camera compares the phase of the reflected light for every pixel with the phase of the emitted light. Based on the phase difference the distance is calculated. This can be done to a distance of 7.5 metre, further away the mea-sured distance becomes ambiguous.
Pros:
- Easy to obtain 3D information about an object.
- Fast method to obtain 3D information. (up to 54 fps for SR4000 camera) - Low processing power needed for gathering 3D information.
Cons:
- Cameras have low resolution.
- Relativly new technique, therefore not much information available.
Light valve
A light valve can be used to get information about the shape of the fish. This can be done by placing an array of LEDs on one side of the sensor and an array of receivers on the other side of the fish sensor. When there is a fish between the receivers and the transmitters, some receivers can not receive the emitted light. This indicates that there is a fish between the LED and the receiver. In figure 3.6 an example of a fish passing a light valve is showed. The outline of the fish can be detected by using the information about the light blocked by the fish when the fish swims through.
There is already a system available that can detect and count fish using a light valve. This system is called the “Riverwatcher Fish Counter” and is produced by the Icelandic company Vaki. This Fish Counter is used for research [5]. With different fish species recognition algorithms this counter was accurate in fish species recognition in approxi-mately 70% of the cases.
Figure 3.6: Detecting fish using a light valve. When the fish swims through the light valve, some receivers can see the light that is emit-ted (in the figure the top and bottom two re-ceivers). Some other receivers can not receive the light, because the fish is blocking the light (4 receivers in the centre).
Pros:
- Measured size of fish does not depend on fish location in sensor because the scan lines are horizontal. (closer to or from the sensor does not give larger or smaller images)
- Infra red light can be used, which does not scare the fishes.
Cons:
- Length of fish measurement is difficult when swimming speed is unknown. (Can be solved by also placing a row of sensors and LEDs in horizontal di-rection)
Ring sensor
With a ring sensor it is possible to detect some 3D information of the fish. It is possible to get the outline just as was the case with the light valve, but now there is more infor-mation about the 3D shape of the fish. Concave spaces can not be detected, which is a pity, because information about the position and location of the fins of fish can give use-ful information about the fish species. The global outline of the fish can be measured. This type of sensor has not been used in fish counting solutions before, but it is used for counting and measuring the shape of potatoes and apples [17].
Figure 3.7: Detecting fish using a ring sensor. The global shape of the fish is detected, but it is not possible to detect for example the concave areas on the bottom between the fins and the body of the fish.
Pros:
- 3D information about the fish
- Swimming direction in 3D can be distinguished (Maybe some fish species have another swimming pattern than others)
- Infra red light can be used, which does not influence the fish.
Cons:
- Length of fish measurement is difficult when swimming speed is unknown.(Can be solved by placing some horizontal LEDs for measuring the speed)
- When the water is too turbid no information can be obtained.
- Can not detect concave spots, this can give problems with fish fins. (See figure 3.7), the shape of the fish will be seen as the bold outline, while the shape of the fish is different. This can make species detection more difficult. - The sensor can not detect more than one fish at a time in the sensor.
3.2.3 Resistive
According to information from the company Aquantic, the conductivity of riverine wa-ter varies between 30 μS cm−1and 450 μS cm−1.
The conductivity of fish is according to the information of Aquantic higher than the conductivity of water. Some conductivity values for fish that are published [24] indi-cate that for carp (787 μS cm−1- 1085 μS cm−1) the conductivity is indeed higher than
for water. For ’various species’ the conductivity is (280 μS cm−1- 3130 μS cm−1), which partly overlaps the conductivity of water. Unfortunately ’various species’ is not speci-fied further in this article.
Because the fish counter is tested with success in the Netherlands, it is very likely that almost all fish that needs to be counted have a resistance differing from the resistance of water. Therefore it should be possible to detect fish using resistive measurements.
Fish resistance between two plates
With a resistive measurement system consisting of two plates, the resistance between the plates is continuously measured. When a fish passes the sensor, the resistance is likely to lower, because the resistance of fish is lower than the resistance of water.
Pros:
- Only the measurement elements need to be waterproof, the largest part can be outside the water.
- Light is not needed for the measurement
Cons:
- When the diameter of the pipe / passage is large with respect to the diameter of the fish, resistance change is low.
- Not possible to distinguish species.
- The resistance of water can be varying, which can give false fish counts. - The differences in resistance caused by the fish can be small in comparison
to the measured resistance, which makes it difficult to detect fish.
Fish resistance using three metal strips
between upstream and centre electrode, and downstream and centre electrode both change with the same factor. Therefore the difference between the two resistances does not change.
Figure 3.8: Schematic view of detecting fish using three
metal strips. The upstream and downstream electrode
have a voltage that is in counter phase, therefore the mea-sured voltage at the center electrode is 0 V if no fish is present. If a fish is present, the measured voltage will change.
Pros:
- Method works and is tested in a real situation. - Independent of environmental light.
- Direction of swimming can be detected.
- Because of differential setup, relative insensitive to changes of water conduc-tivity.
Cons:
- Not possible to distinguish species.
- Not possible to count fish correctly when multiple fish are passing simulta-neously.
Impedance based tomography
Impedance tomography is a measurement method that can be used in order to measure the impedance of objects inside a ring of sensor elements. A ring with a number of metal plates can be used to measure the resistivity of the material inside the ring. In figure 3.9 there is some current put onto two of the plates, and the voltage is measured at two other plates. This measurement is carried out with the current on different plates, and the voltage measured on the different plates. When there are a lot of measurements carried out, some reconstruction algorithm can than be used to create an image which shows a map of the resistivity inside the ring. This technique has not been used in fish detection before, but there is research for using this system in medical environments [7], An example of such a measurement for measuring a body with a hearth and lungs is shown in figure 3.10. Because the resistance of fish differs from the water resistance, the location of the fish can be detected this way. Because the resistance inside the fish will also differ, it can be possible to detect the location of some of the organs of the fish, which can be used to detect the species.
Pros:
Figure 3.9: A schematic view of a setup for de-tecting fish using impedance tomography. In this figure, there is a current flowing through two of the electrodes, where the voltage is sured on two of the other electrodes. The mea-sured voltage is dependent on the distribution of conductivity in the pipe. When enough of these measurements are carried out, it is possi-ble to reconstruct a map of the resistivities.
Figure 3.10: An example of a reconstructed im-age of two lungs, and a heart. It can be seen that the lungs (left and right) and the heart have a different resistance than the area between them(if you look at this image in color, you can also see that the lungs tend to red, meaning higher resistance, where the heart is blue, and thus has a lower resistance). This image is from an article about ways applications, and recon-structions of impedance tomography [7].
- If the fish are large enough, information about the location of some organs may be obtained.
Cons:
- Reconstruction algorithm will be difficult and computational intensive
3.2.4 Capacitance
Capacitive mnethods are based on differences in permittivity between fish and water. When two plates are placed in parallel, the capacity can be calculated by:
C=ε0εrA d
In whichC= capacity,ε0= permittivity in vacuum (≈ 8.8510−12),εr= relative
permit-tivity,A= surface of a plate,d= distance between two plates.
The relative permittivity of water is approximately 80, this value differs for changing temperatures and frequencies, but for frequencies below 1 GHz, and temperatures that seems reasonable for water in rivers ( 0◦C to 25◦C)[31] the relative permittivity is be-tween 78 and 86. This is mostly influenced by temperature, and almost not by fre-quency.
of water. Muscle for example has a relative permittivity of approximately 1800[15] for a frequency of 1 MHz.
Because there are differences in the permittivity of water and organic materials like blood and muscle, it is assumed that the permittivity of fish also differs from the water permittivity. Therefore it seems to be possible to detect fish using capacitive measure-ments.
Capacitance
Counting fish based on capacitance can be done by placing a metal plate on the bottom, and a metal plate on the top of the fish passage (both underwater). When a fish swims between the plates, the water is partly replaced by fish, which changes the permittivity between the plates. Therefore the capacity changes, which can be measured.
Figure 3.11: Illustration of counting fish using the capacity of a fish. Because the permittiv-ity of the water differs from the permittivpermittiv-ity of fish, the measured capacitance between the plates on the left (only water) differs from the measured capacitance between the plates on the right (fish and water). When measuring the capacitance, it is therefore likely that a fish can be detected.
Pros:
- Light is not needed for the measurement.
Cons:
- Not possible to distinguish species
- Not much research about capacitive fish detection
Capacity based tomography
Capacitive based tomography uses a ring of (generally 8 or 12) metal plates. The capacity between each of these plates is measured. When the permittivity is not homo-geneous (for example because there is a fish in the water), this can be detected. This can be used to make an image of the location of the fish. Capacitive tomography is used for example to measure the filling of a pipe [22]. The biggest problem when using tomography is the reconstruction. Because the measured values need to be converted to an image, some reconstruction algorithm is needed. There is already some research carried out about reconstruction images [52] [51] indicate that capacitive tomography reconstruction is possible. There is also some research carried out about capacitive to-mography for fish detection, however the results are not made public.
Pros:
- Information about the shape of the fish.
- Maybe even information about the location of some organs of the fish that give information about the species.
Cons:
- Changes in the water capacity will greatly influence the measurement.
- Reconstruction is a computationally heavy process.
- Reconstruction is a mathematical difficulty, and will probably be not very accurate.
3.2.5 Inductive
Inductive measurement is based on the change in permeability inside a coil, or between multiple coils. For a coil the inductance can be calculated with the following formula.
L=n2μ0μr l A
With L= inductance, n= number of windings,μ0= magnetic constant (4π10−7,μr =
relative permeability,l= length of the coil,A= area of the coil.
The idea is that when the coil is placed around a tunnel filled with water, and an ob-ject with a relative permeability different from the relative permeability of water passes through the tunnel, the inductance will change. The change in inductance can be de-tected.
Figure 3.13: Counting fish using a coil around the fish tube, and measure changes of relative permeability.
Inductive
Placing a coil around a non-conductive pipe through which a fish swims, can detect changes in the permeability inside the coil. This probably changes when a fish passes through the sensor.
Pros:
- No need for light or sound.
Cons:
- Probably not possible to distinguish fish from water - Not possible to distinguish species.
- Not possible when the fish passage is made from metal.
- Not much information available about inductive fish detection.
Induction based tomography
Figure 3.14: A schematic view of the localisa-tion of the coils inside a ring. Each time one of the excitation coils is activated, while the re-ceiving coils are measuring. This measurement gives information about the conduction of the materials inside the ring. This image is from a report about an experimental setup for mag-netic induction tomography [25].
the conductivity of fish probably will be, so it is not clear if this method will work for fish. However, the biggest problem is the time it takes to get an accurate measurement. In order to get a complete measurement, the setup takes approximately 1 second. In the situation with a fish, it is unlikely that the fish will stay at a location for 1 second. Therefore the reconstruction will be impossible, because the fish has changed location between the different measurements, which makes the measurement results incompa-rable.
Pros:
- No need for light or sound.
Cons:
- Image is probably not clear enough to detect shape of fish
- Measurement as described by [25] takes too much time to detect a fish
3.2.6 Radiation
Electromagnetic radiation can be divided in a lot of different categories. Some exam-ples of these categories are radio transmission, visible light and ionizing radiation (e.g. x-rays). Methods using X-rays, and radio frequencies are described in this chapter. Methods using light (both visible and invisible (e.g. IR and UV) have been discussed in section 3.2.2.
X-Ray
This kind of radiation can pass through the most soft tissues, and is blocked by most hard tissue such as bones. Therefore this method can be used to look through the skin and see the bones of a human. This method is often used in medical imaging. Another sector where the x-rays are used is the food industry, where it is used to check contam-inants in the food.
This method can be used by placing an x-ray source on one side, and a detector on the other side of a pipe. When a fish swims through the pipe, the fish bones can be de-tected. Unfortunately this kind of radiation can be dangerous if people or animals are exposed for a longer time to this kind of ionizing radiation. Therefore there are a lot of regulations for using this kind of radiation [39], which makes using this method very time consuming because of the permissions that must been granted.
pros
- Can detect shape of bones, which can give information about the fish species.
Cons
- X-rays can be dangerous if people or fish are exposed to this radiation too long.
- Strict regulations for ionising radiation.[39]
Radar
Radar (Radio detection and ranging) is a method which can be used for detecting aircrafts[36], ships[14], but also for level measurements in reservoirs[21] and detect-ing buried objects[4]. There are 2 types of radar, primary and secondary.
Primary radar emits a pulse, and waits to receive an echo. By calculating the time between the emitted pulse, and the reflected signal, the distance to an object can be measured.
Secondary radar does not emit a pulse, but waits for a pulse that is emitted by another object (for example an air plane). Because fish have usually no transmitter for emitting these pulses, only primary radar can be used.
Radio waves can be strongly damped by conducting material. Tin foil for example can almost block radio waves, but also salt water which is a bit conductive can strongly attenuate the radio waves. Pure freshwater does not attenuate the radio waves as fast as salt water, however also freshwater attenuates the radio waves more than air. But with a strong enough transmitter it should be possible to measure half a metre to detect fish.
Figure 3.16: A schematic view of how to detect a fish using radar. The transmitter transmits a pulse. This pulse is reflected by the fish, and re-ceived by the receiver. By calculating how long the pulse is on its way from the transmitter via the fish to the receiver, the distance can be cal-culated. Unfortunately the bottom of the water (not drawn here) also reflects a part of the signal, which makes it difficult to find the fish in the re-flected pulses.
Pros
- Can work without influencing the fish behaviour.
Cons
3.2.7 Magnetic
There are various measurement methods using magnetic fields. One of these methods is to measure the magnetic field around some object. Another way uses a magnetic field and radio waves to detect the hydrogen molecule density (nuclear magnetic resonance).
Determining the magnetic field
This method is based on detecting the magnetic field around a magnetic object. This field can be detected by for example a Hall sensor, or a fluxgate sensor. Unfortunately, fish are not magnetic. Therefore this measurement method will not be able to detect fish.
Figure 3.17: This figure shows how a fish could be detected if it was actually magnetic. The sen-sor on the right side could detect the magnetic field that the fish creates. Unfortunately the fish does not have such magnetic field.
pros
- Can be used in situations without light, or sound
Cons
- Fish are not magnetic, and therefore not detectable using this technique.
Nuclear magnetic resonance
This method is also known as MRI (magnetic resonance imaging). This method works just like an MRI scanner. A strong magnetic field sets the spin of the atoms to be either with, or against the direction of the magnetic field. Most of the spins are cancelled out by each other (a spin in the direction of the field cancels a spin in the counter direction). Only a couple atoms out of a million are not cancelled out. These atoms can change spin when there is a radio wave transmitted of the correct frequency. When the radio field is turned off, the spin will restore to its original direction. By going back to the original direction, the atom releases some energy in the form of a photon, with a frequency depending on the magnetic field at the location of the atom.
By applying a gradient magnetic field, it is possible to select a slice of the object to detect the hydrogen atom density.
Figure 3.18: An image of a MRI scanner that can be used for scanning humans.
pros
- Can be used in situations independent of environmental light. - Can look inside the fish to detect location of organs.
Cons
- Very strong magnets needed.
- Absolutely no ferromagnetic parts are allowed in the area of the sensor. - Scanning is not very fast, the fish needs to stop moving during the scan,
which is very improbable.
- The gradient magnets make a lot of noise, which is uncomfortable for hu-mans, and very likely also for fish.
- These scanning devices are very expensive(in the order of millions of euros) [20], [49].
3.2.8 Thermal
Figure 3.19: This image shows a fish passing some thermometers. The thermometer before
the fish is not yet warmed up. As the fish
passes, the thermometers show increasing tem-peratures. When the fish is passed, the temper-ature decreases again.
To measure the temperature, it is possible to use for example an infra red thermome-ter or a thermocouple. This could detect the fish if the temperature of a fish differs considerably from the temperature of water and the fish were swimming close to the sensor. Unfortunately, this is not the case because all fish are cold blooded. Therefore they have approximately the same temperature as the water. The other problem is that fish are swimming in the water and not always at the same distance from the sensor, which would make it difficult to measure the temperature of the fish.
be necessary to know the exact distance from the object to the sensor to calculate the real temperature of the object.
pros
- Can be used in situations without light.
Cons
- Fish can probably not be detected because they are cold blooded.
- The water spreads the temperature relatively well, therefore it is only possi-ble to measure the fish temperature if the fish is close to the sensor and this (small) distance is known.
3.3
The methods compared
During a meeting in Deventer with Marcel Wijnberger, Marcel Klinge, Guus Kruitwa-gen, Paul Regtien and Jeroen Broersen the pros and cons of the different methods were compared, and each property has been given a weight. The values as assigned in this meeting are showed in table 3.1.
Not each method mentioned in this chapter is placed in the table, because some meth-ods like magnetic and temperature have that small chance of success that they were not discussed any further, and therefore have no values assigned.
Information available Expected costs Computational power requir ed annoying for fi sh Can detect o bjects Can d istinguish fish and other o bjects Can d istinguish multiple fish Can appr oximate fi sh size Can determine fish shape Can detect color of fish automatize-ability species re cognition T o tal scor e
Sonar ++ - 0 ++ ++ + + 0 - - - 4
Didson + - - 0 ++ ++ ++ ++ + + - - 0 22
Camera ++ 0 - + + ++ + + + 0 + 21
Stereo vision 0 0 - + + ++ ++ ++ ++ 0 + 27 Light valve 0 0 + + ++ + + + + - - 0 17 Ring sensor - 0 0 + ++ + ++ ++ + - - 0 20
2 metal plates - 0 + ++ + + 0 0 - - - 2 3 metal strips + 0 + ++ ++ + + + - - - 8 Impedance tomography - - - - ++ ++ ++ ++ ++ + - - + 24
Capacitive - 0 + ++ ++ + + 0 - - - 3 Capacitive tomography - - - - ++ ++ ++ ++ ++ + - - + 24
Radar 0 - - - ++ + 0 - - - -15
Weighting factor 1 1 1 3 3 2 2 3 3 1.5 2
3.4
Conclusions about the possible measurement methods.
As already shown in table 3.1, the tomography (resistive and capacitive) and camera methods have the highest score. Therefore the choice was made to further investigate these measurement methods.
4 Optical methods
4.1
Introduction
This chapter is about optical fish detection and recognition. The chapter starts with some information about what will happen to the light when it passes through riverine water. After this part an experiment that is carried out in the lab at the university, and a test with camera’s in a real fish passage will be described.
4.2
Background
When a light beam travels through riverine water, the beam is affected by the water. Water can have the following effects on a beam of light:
absorption When light travels through water, a part of it will be transformed to other
forms of energy, like heat.
scattering When light hits a particle (e.g. a grain of sand), it can be scattered into
different directions depending on the shape of the grain and the angle of incident.
refraction Because most cameras are intended for use above water, a camera has
prob-ably to be placed in an area without water. Because this creates a transition from air to water, the angles at which the light travels will change.
The amount of absorption is mainly dependent on how turbid the water is, and what kind of matter causes the turbidity. It is also dependent on the color(wavelength) of the light. Humic acid for example absorbs the blue side of the spectrum more than the red side [26], leading to a brown color of the water.
Green alga on the other hand mainly absorb red and blue, while not absorbing green [41]. This makes these alga look green, and therefore affects an other part of the spec-trum.
The amount of scattering depends strongly on the water. If there are a lot of particles (sand, clay, alga) more light will be reflected by these particles.
The refraction is caused by the transition from water to air. When the light goes from air to water, or from water to air, the light beam will be refracted. The angle of refraction can be calculated by Snell’s law
sinθ1
sinθ2 =
n2
n1
In this formula θ1 is the angle the light from medium 1 to the boundary between
medium 1 and medium 2 (angle of incidence). θ2 is the angle of refraction. n1 and
n2are the refractive indexes for the different mediums. In the case of air to water, the
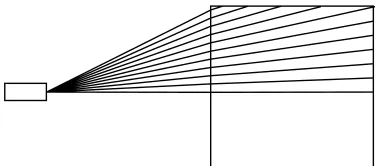
If for example a circular tube is used, and a camera is placed to the side of the tube, the refraction of the water will make a part at the top and bottom of the tube ’invisible’ to the camera, while another part of the tube is seen twice, which can give strange views when analysing the images. Figure 4.1 shows the light beams for different angles. It can be seen that the beam of light at the top side of the tube (red in the figure) crosses other light beams inside the tube. This makes it very difficult to look at the top and bottom side of the tube. Therefore another shape for the tube is preferred. In case of a square tube (figure 4.2), the whole tube can be seen by the camera.
Figure 4.1: Illustration of some light rays when a circular tube is used. The rays partly cross each other (top 2 lines) which makes it impossible to see the top of the tube by using only 1 camera.
Figure 4.2: A view of some light rays when a square tube is used. This tube has less problems caused by the refraction index than the case with the circular tube.
Fish can be chased away by intense light sources, or blinking lights. Because a fish passage is meant for letting the fish pass, it is not a good idea to use a very bright light source that the fish can see. Freshwater fish living in deep water often have only two color receptors, and can only see colors around 530 nm and 620 nm wavelength (green and orange). Fish living in shallow water often have also sensitive receptors for 430 nm (blue) light. Fish in very shallow water usually have also three color receptors, but the sensitivity is changed to a little lower wavelengths [42].
[image:36.612.228.417.411.494.2]4.3
Camera tests at the University of Twente
4.3.1 Introduction
When cameras are used to count and recognize fish underwater, the quality of the im-age is strongly affected by the water. The water contains alga, sand, and humic acid, which all add some noise to the image. Edges can become blurred and a grain of sand can block or reflect light, which adds more noise.
This experiment is carried out to find out if it is possible to look with a camera through turbid water and detect a fish or the edges of a fish. Furthermore this experi-ment is to find out which color can be used to look at the fish.Because the requireexperi-ments state that a fish should be possible to recognise in a tube with a 30 to 50 centimetre diameter, it is necessary to see enough detail through 30 to 50 centimetre of water for recognition.
4.3.2 The setup
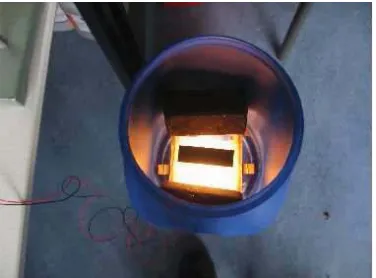
In order to measure how much the water influences the ’sharpness’ of the edge, a barrel is used. On the bottom of the barrel a lamp is placed of which a part is covered. The camera is placed above the water level. The camera looks to the lamp. This means that a part of the image is dark, while another part emits light. Images are taken for different amounts of water between the camera and the lamp. This is done by taking 10 images every 5 centimeter of water level raise . In figure 4.3 a photo of the setup is shown. The camera is not visible in this photo, but the camera is placed above the barrel, facing the light source which is partly covered with the plate.
[image:37.612.196.384.473.612.2]Because the water in rivers has much more turbidity than tap water, water from a pond near the Hogekamp building of the University of Twente is used for this experiment.
4.3.3 Processing the images
It is difficult to compare the images objectively by only looking at them. Therefore a matlab script is developed to extract the needed information from the images.
For this script it is necessary to manually select the area in which the edge is visible. In figure 4.4 such an area is marked. After the selection, the edge between dark and light needs to be found. This is done by highlighting the edges using the canny edge detector. After this, the Hough transform is used to find the edge between the covered and not covered part.
[image:38.612.189.456.361.561.2]When the edge is found, the image is rotated to get this edge vertical (see figure 4.5). After rotation the average of a column of pixels is taken in the area where more than 50 % of the rotated image contains infomation from the image. The thin vertical lines in figure 4.5 indicate the area where more than 50% of the pixels in a vertical row are from the original unrotated image.
Figure 4.6 contains graphs that are created from the rotated image. The left part shows the average value of the pixels for every column as well as the the minimum and max-imum value. The derivative of the amplitude is shown in the graph on the right. This derivative is calculated by subtracting two values next to each other from the average graph.
The rotated image
Figure 4.5: The selected area of the image is rotated. The area in which more than 50% of the vertical line is from the original image is marked with the two small vertical lines.
20 40 60 80 100 120 140 160
0 10 20 30 40 50 60 70
Intensity level
Position in horizontal direction of image
Average
-5 0 5 10 15 20 25
0 10 20 30 40 50 60 70
Intensity level
Position in horizontal direction of image
[image:39.612.253.327.116.322.2]Derivative
Figure 4.6: The graphs that are created based on the rotated image, from the gray image. In the left part, the average value is shown, it can be clearly seen that there is a transition from dark to light. In the right part, the derivative is showed. Here a peak can be seen at the location where the derivative is at it’s maximum value.
4.3.4 Analysing the results
maximum derivative is measured.
Noise
The quality of the image is not only determined by blurring, but also by some noise caused by larger particles, for example sand grain. In order to get an idea of the level of this noise, the noise of some images with the highest water level used (38cm) is calculated. The noise is calculated by assuming that the average of an area of 5x5 pixels has the ’correct’ value. By subtracting this value from the value in the centre of these five pixels, the noise is calculated.
Noise has a wide range of which low noise levels occur often and higher noise levels are rare(figure 4.7). The standard deviation of this noise is calculated using
σ=
1
n−1
n
∑
i=1(xi−x¯)2
The standard deviation is found to be 5.2 .
When 99.99 % of the noise should be within the specs, a 4σcan be used. In this case, this is 21.
This value of 21 is on a scale of 0 to 255. This corresponds to a value of 0.082 on a scale from 0 to 1 (0=black; 1=white), as is used in the following section.
0 10000 20000 30000 40000 50000 60000 70000 80000 90000
-60 -40 -20 0 20 40 60
number of occurences
amplitude of noise
The noise level and the number of occurences
Figure 4.7: The noise level versus the number of occurrences for an image taken through a layer of 38 centimetres of turbid water.
Maximal blurring
blur, a figure with two black stripes with a width of 3 pixels and a distance of 30 pixels is used (if 3 pixels per millimeter is assumed, this means that there are two prickles of 1 mm thick with a distance of 1 cm), see figure 4.8.
A Gaussian blur with different values for the scale(σ) is applied to this model. In figure 4.9 the result for different values ofσcan be seen.
Obviously, as sigma increases, it becomes more difficult to detect the prickles. In order to make it more clear what pixel intensities are caused by blurring, the intensities at the centre of the prickle are plotted in figure 4.10.
In these cases no noise is present. In order to still be able to detect the stickle in presence of the noise, the change in intensity caused by the stickle should be more than the inten-sity difference caused by noise. Because the noise can work in both directions (light can be darker, and dark can be lighter by the noise), it is possible that a part without stickle is made darker, while a part with a stickle is lighter, leading to a difference two time as much as the noise that was found. Therefore the stickle should give an intensity more than 2 times the noise (for a better difference, 3 times the noise is chosen). Because the noise was found to be 0.082 , the minimum level change caused by a stickle should be 3×0.082 = 0.25 . In the case of aσ=4.5, the level change caused by the prickle is 0.26 as can be seen in figure 4.10.
Therefore it is necessary to have a blurring level σ <4.5 in order to be able to detect details of a fish like prickles.
The original image
Gaussing blur, sigma=1 Gaussing blur, sigma=2
Gaussing blur, sigma=3 Gaussing blur, sigma=4
Figure 4.9: The stickle, but now blurred with different values forσ
0.3 0.4 0.5 0.6 0.7 0.8 0.9 1
0 5 10 15 20 25 30 35 40 45 50
Intensity
x-position in image of prickle
Intensity of light for different values of sigma
[image:42.612.189.455.109.361.2]Sigma = 1 Sigma = 2 Sigma = 3 Sigma = 4
Figure 4.10: The values for every pixel at the centre of the prickle.
From sigma to derivative
Because in the experiments the values for the derivative are obtained, and not the blur-ring factorσ, this blurring should be converted to a derivative.
this.
For the standard Gaussian blur, the following formula can be used.
h(x,y) = 1
2πσ2e
−x2+y2
2σ2
Because the image is rotated, we can consider only the 1-dimensional case. This can be written as:
h(x) = √1
2πσe
−x2
2σ2
The blurred edge is found by convolution of h(x) and the step function. This results in:
f(x) =
inf
0
1 √
2πσe
−(x−t)2 2σ2 dt
The maximum derivative is at x=0, and is dependend ofσby:
˙
f(x) = √1
2πσ
So with the maximum allowable sigma of 4.5, this leads to a minimum derivative of 0.09 .
Results
For every color channel (Red, Green and Blue), the derivative and average values are obtained from the image. Unfortunately the red channel has clipped in a lot of the images taken (clipped means the intensity applied to the camera is higher than the maximum detectable intensity). Therefore it becomes difficult to find the amplitude for the red channel for all water distances .
To get the amplitude for the water levels where the images clipped, the other color channels are studied. It seems that the intensity of the blue channel divided by the intensity of the green channel is a linear function dependent on the water level. For the not overexposed values of the red channel, it is also possible to calculate such a ratio between the red and green or blue channel.
By calculating the ratio between the red and green channel, the expected amplitude of the red channel is calculated. The amplitude for the different color channels can be found in figure 4.11.
The maximum derivative is also detected in the images. For the derivative the clip-ping of the red channel also gives some problems. Therefore not every water level has a data point in the graph. The derivative is divided by the amplitude, resulting in the graph of figure 4.12.
It can be seen that the signals of the different color channels are close to each other, and are decreasing when the water level increases.
0 100 200 300 400 500 600
0 5 10 15 20 25 30 35 40
Intensity
Water level
The amplitude of the color channel for different water levels
Red channel Blue channel Green channel
Figure 4.11: The amplitude for the different color channels.
should be no more than 0.09. It can be seen in figure 4.12 that in this case the levels are above this value. Therefore it should be possible see enough detail to distinguish prick-les of 1 mm wide, and 1 cm long in 38 centimetre water. However, when extrapolating the graph, it is probable that at 50 centimetre the derivative becomes lower than 0.09. Therefore at 50 centimetre the requirement for detecting these prickles is not met.
0.08 0.1 0.12 0.14 0.16 0.18 0.2 0.22 0.24 0.26 0.28
0 5 10 15 20 25 30 35 40
Derivative / amplitude
Water level
The amplitude of the color channel for different water levels
Red channel Green channel Blue channel
4.3.5 Conclusions about the camera experiments at the University of Twente
The experiments in the laboratory at the University of Twente have shown that it is possible to look with a camera through 38 centimetre of water, while still seeing enough details of a fish in order to detect fish species. When the results are extrapolated to a distance of 50 centimetre, the level of detail that is visible is not enough to achieve the requirements as discussed in section 4.3.4.
The red channel has stronger signal strength than the other channels. This is probably caused by the light source, since this is also the case in the situation without water. Because there are no big differences in the used spectrum, it is assumed that colors close to this spectrum (such as infra-red) will also satisfy. Because fish can not see infra-red light [42], and it is likely that infra-red is as good as the other colors to look underwater, Infra-red is recommended to use for fish recognition.
4.4
The camera setup in Roermond
4.4.1 Introduction
In Roermond there is an experiment where a siphon fish passage from FishFlow is com-pared with a basin fish passage from the Ministry of Waterways.
Every morning one of the two passages is turned on. The next morning the other pas-sage is turned on. The two paspas-sages are compared by counting the number of fish caught in a fyke at the end of the passage. Unfortunately there are not many fish caught after the siphon passage. There are several theories why the fish are not caught. It is for example possible that the streams at the fyke could confuse the fish, which lets the fish turn around and go to the start, instead of entering the fyke. It is also possible that the fish hear the noise of a dam nearby, and decide to turn back.
In order to find out if the fish are actually passing the largest part of the passage, cam-eras are placed inside the passage. These camcam-eras should be able to record fish, and can give information about the theory that fish are going to the end of the passage and return to the entry of the passage. If this is the case, the fish should pass the cameras twice. One time in upstream direction, and one time in downstream direction.
The experiment is carried out in two iterations. In the first iteration some cameras and infrared light sources were placed. After analysing the results, the choice was made to place more infrared light sources and a better camera. These additions are done in the second iteration.
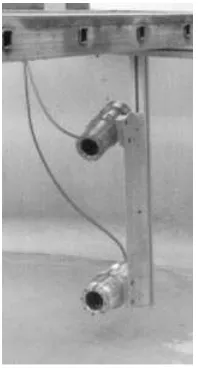
4.4.2 The first setup
Cameras
The tube of the fish passage is fairly large (2.4 meter diameter). Fortunately the part of the passage in which the fish can pass is a lot smaller, as can be seen in figure 4.13. This is because the goal of the fish passage is to change a large difference in water level to a lot smaller differences in water level. This is done by placing baffles in the tube with small differences in water level, which are all possible for the fish to pass.
[image:46.612.257.389.434.615.2]The cameras are located near a baffle, because here the fish need to pass through a small part of the tube, which makes it more likely for the camera to detect passing fishes.
Figure 4.13: The schematic setup of the cameras in the fish passage. The tube has a diameter of 2.4 meter. But the fish can only pass through a small part of the tube. The cameras are directed to this part.
Figure 4.14: A photo of the camera placed in the tube, as used in the first setup.
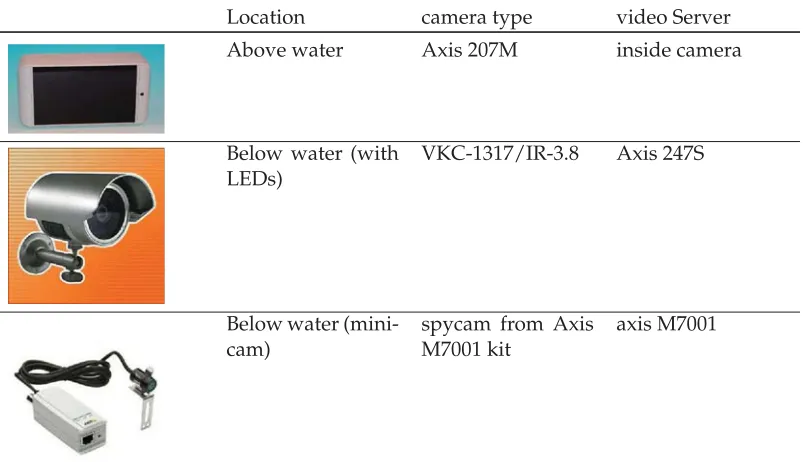
Location camera type video Server Above water Axis 207M inside camera
Below water (with LEDs)
VKC-1317/IR-3.8 Axis 247S
Below water (mini-cam)
spycam from Axis M7001 kit
[image:47.612.95.497.111.342.2]axis M7001
Table 4.1: The cameras that are placed inside the fish passage (first setup)
IR beamers
There were also several Infra-red (IR) sources used. The camera above the water had a source of IR light, one of the underwater cameras had an IR source and another IR source was placed facing the underwater cameras.
Data transfer
The cameras produce a lot of data. Because these data need to be analysed, and prefer-ably not at the fish passage, but at another location, the data has to be transfered to another location. A few days after the camera-setup was placed, an UMTS-router was placed. Via this UMTS router it was possible to look at live images from the cam-eras, however playing forward and backward was not possible, which is difficult when analysing the images, because if there is something interesting it would be nice to take a second look at the images.
Therefore the data was also saved locally in Roermond. When the first setup was con-verted to the second setup, the images were copied to a NAS (Network attached stor-age) , and transported to Deventer.
4.4.3 Results from the first setup
some waves at the water surface, that could be caused by fish, but it was not clear enough to be certain.
The underwater minicamera was not sensitive enough for the IR light to see clearly what was passing.
The underwater camera with IR beamer had problems with looking underwater be-cause the light generated by the IR beamer on the camera was reflected very close to the camera by the turbidity of the water. This caused the image to be overexposed, however it was also possible to see the IR beamer that was mounted on the opposite side of the area where fish could pass.
4.4.4 The second setup
Cameras
Because the results from the first setup where unsatisfying, but showed that there were possibilities for improvements, changes were made to the setup. In this second setup a camera was added. The extra camera (a Mobotix D12) is chosen because this camera is much more adjustable to the situation. It is for example possible to select a region to which the brightness is adjusted.
This Mobotix camera has two lenses. One of them has a daylight sensor, and a sen-sor with a small angle. The other lens has a night (IR) sensen-sor, and a wide angle lens. Because the daylight camera is not sensitive to IR light, and there is almost no non-IR light present in the tube, this camera gave no information, therefore the recording of this lens is stopped after a few days. The night vision camera with a 90◦ lens gives a better quality of images. Therefore these images are recorded.
Because the two underwater cameras from the first setup were blocking the ideal lo-cation of the Mobotix camera, these two cameras were moved. These two cameras are still placed underwater, but they are moved more to the top as can be seen in figure 4.15. The setup is also shown in figure 4.16a.
Figure 4.15: The location of the IR beamers, and the camera for the second setup.
IR beamers
(a) The cameras (b) The IR beamers
Figure 4.16: The cameras and IR beamers as used in the second setup.
made switchable by the outputs that the different cameras have. The switching setup is described in table 4.3.
Data transfer
Shortly after adding the Mobotix camera, the live images from that camera were also available via the UMTS router.
To get the images to Deventer, at first an ftp server was established, so it would be possible to download the images. However, this connection was also over the UMTS network, which made it too slow to transport all the data. Therefore the data was locally stored on a NAS (network attached storage) in Roermond. After some time of recording the images, the NAS was replaced by another NAS and sent by mail to Deventer to analyse the captured images.
4.4.5 Results from the second setup
The new setup has an extra camera and more IR beamers. Especially the Mobotix cam-era combined with the IR beamers gives better images than the previous setup.
over FTP, the fish could not be found. This is probably caused by the frame rate of the recording. The Mobotix camera can take up to 25 fps. But there were less frames recorded. Manually counting of the frames showed that between 3 and 5 frames per second were recorded. Because of this low speed of recording images, and the inde-pendent process of viewing images by the live viewer, it is possible that fish are seen, that are not recorded. This is illustrated in figure 4.17
Figure 4.17: The images captured by the camera are not all saved. The images are also not all viewed by the live video stream. It is possible that different images are viewed by the live stream than are captured by the camera. Therefore it is possible to see a fish in the live images, while not seeing it in the saved video.
There are a lot of images found in which objects are detected that are likely to be a fish. However because of the low frame rate at which the