OCULOMOTOR FUNCTION AT LOW TEMPERATURE:
ANTARCTIC VERSUS TEMPERATE FISH
J. C. MONTGOMERY AND J.A. MACDONALD
Department of Zoology, University of Auckland, Auckland, New Zealand
Accepted 4 December 1984
SUMMARY
The peripheral oculomotor system can be modelled as a first order linear system (Montgomery, 1983), and hence specified by its characteristic frequency and 'd. c.' gain. These parameters can be determined by recording eye movements produced by stimulation of the abducens nerve with sinusoidally modulated pulse trains, and compare well with those indepen-dently derived from the relationship between motoneurone firing and spon-taneous eye movement. Characteristic frequency and gain of the peripheral oculomotor system were determined for two species of antarctic teleost and one temperate species, to examine temperature compensation within a com-plete motor output pathway. Compared with low temperature function in temperate fish, the characteristic frequency is clearly temperature compen-sated in antarctic fish, which explains in part the observed temperature compensation of their rapid eye movement. The ' d . c ' gain of the peripheral oculomotor system is inversely related to temperature, providing an automatic compensation for possible reductions in central nervous system output and sensory gain at low temperature.
INTRODUCTION
For several million years antarctic fish have inhabited the world's coldest marine environment, where the mean annual sea temperature is as low as — 1*9 °C (Littlepage, 1965). For a temperate fish, cooling to this degree would be lethal; even if the body fluids remained supercooled and did not freeze, CNS motor programmes would cease (respiration: Friedlander, Kotchabhakdi & Prosser, 1976; eye move-ment: Montgomery, McVean & McCarthy, 1983), peripheral nerve conduction would fail (Macdonald, 1981) as would muscle function (McCarthy, 1982), and the activity of many enzyme systems would be drastically reduced (Clarke, 1983). The ability of antarctic fish to survive at — 1 -9 °C depends on a range of adaptations which enable their vital systems to function. For example, their body fluids are prevented from freezing by an antifreeze component (DeVries, 1980) and the activity of many of their biochemical systems is partially temperature compensated. That is: the activity of these systems exceeds their activity in temperate species lowered to near freezing, but does not match that of temperate fishes at warm temperature (see Clarke,
1983).
Cold adaptation of enzymes and membranes occurs in the nervous system, allowing adequate function of the neuronal elements (Prosser & Nelson, 1981). In antarctic fish, there is temperature compensation of both peripheral nerve conduction (Macdonald, 1981) and neuromuscular function (Macdonald & Montgomery, 1982), though in comparison with temperate fish, obvious functional deficits remain. For example, nerve conduction velocity in antarctic fish is less than half that of temperate fish, and the refractory period of peripheral nerves is around 15-25 ms (Macdonald & Montgomery, 1982). The implications of these differences within the context of a functioning motor control system are explored in this study. The problem addressed is how fish maintain integrated activity at low temperature.
Choice of the oculomotor system for study offers considerable advantages: it is one of the best understood vertebrate motor control systems, eye movements include components of accuracy (visual stabili2ation) and speed (saccades), and detailed mechanical analyses can be made. It is a system in which the potent techniques of control systems analysis have proved to be particularly useful, and where despite its apparent complexity, a single first order model of the peripheral oculomotor system provides a satisfactory description for most purposes (Robinson, 1981). The parameters of the model can be derived from a study of eye movements elicited by abducens nerve stimulation (Montgomery, 1983), and this approach has been used to quantify the effects of acute temperature change on the oculomotor system (Mont-gomery & Paulin, 1984). A comparison of the peripheral oculomotor system of antarctic and temperate fish provides the opportunity to study genetically controlled temperature compensation within a complete motor output pathway.
MATERIALS AND METHODS
Experiments were performed on three species of teleost fish. The temperate eurythermal Girella tricuspidata was caught in hand nets at night by divers using SCUBA, and kept in tanks of circulating sea water at 24 °C. The two species of antarctic fish, Pagothenia borchgrevinki and Dissosttchus mawsoni, were caught on hand lines in the vicinity of Scott Base (77°51'S, 166°48'E), and experiments were carried out in a fish hut on the sea ice.
In fish anaesthetized with Tricaine, the cranium was opened and the brain removed leaving the stumps of the cranial nerves accessible intracranially (Fig. 1). Bleeding was controlled by cautery, and the fish were maintained in a tank by passing sea water at the appropriate ambient temperature over the gills. The stump of the abducens nerve (cranial nerve VI) was secured in a suction electrode, and the cranial cavity filled with Ringer. Electrical stimuli were trains of supramaximal square wave pulses (0-5 ms, 1-5-2 V). Two types of pulse trains were used to stimulate the nerve: con-stant frequency trains in the range 0-50 Hz for antarctic fish and 0-200 Hz for G.
tricuspidata, or trains in which the pulse frequency was sinusoidally modulated at
modulation frequencies in the range 0-04—8 Hz.
B ^ __—•_, A Stimulus train (Hz)
Fig. 1. Experimental procedure. (A) Stimulus pulse trains (0-5 ms, 2 V) were applied to the stump of the VI nerve via a suction electrode (B), in a fish (in this case the antarctic fish Pagothema
borchgrevinki) from which the brain had been removed, but in which the circulation was still intact
and the gills perfused with sea water (C). A retroreflective eye patch was attached to the eye (D) and illuminated (E) through a half-silvered mirror. Eye rotation was recorded by an opto-electronic movement detector mounted in the film plane of a camera (F). (G) Eye movement response to trains of pulses at 10, 20 and 30 Hz.
a single lens reflex camera body. Further details of the method are described elsewhere (Montgomery et al. 1983).
The force required to produce and maintain a given eye deviation was measured with a calibrated strain gauge connected to the surface of the eye. Force was applied tangentially to the eye surface to produce a movement in the same plane as that produced by abducens nerve stimulation. Deflection of the eye was measured both with a protractor positioned above the eye and with the opto-electronic movement detector.
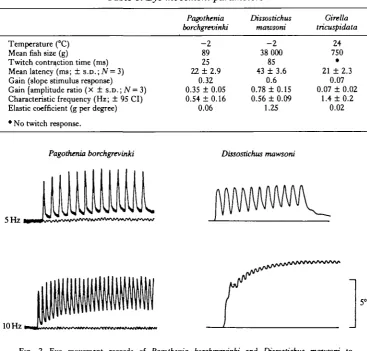
Table 1. Eye movement parameters
Temperature (°C) Mean fish size (g)
Twitch contraction time (ms) Mean latency (ms; ± s.D.;iV= 3) Gain (slope stimulus response)
Gain [amplitude ratio (X ± s.D.; N =3) Characteristic frequency (Hz; ± 95 CI) Elastic coefficient (g per degree) • No twitch response.
Pagothenia borchgrevinki - 2 89 25 22 ±2.9 0.32 0.35 ± 0.05 0.54 ±0.16 0.06 Dissostichus mawsoni - 2 38 000 85 43 ± 3.6
0.6 0.78 ±0.15 0.56 ± 0.09
1.25 Girella tricuspidata 24 750 • 21 ± 2.3
0.07 0.07 ± 0.02
1.4 ± 0.2 0.02
Pagothenia borchgrevinJti Dissostichus mawsoni
5Hz
10 Hz
Fig. 2. Eye movement records of Pagothenia borchgrevtnki and Dissostichus mawsoni to supramaximal stimulation of the abducens nerve with constant frequency pulse trains (5 and 10 Hz). Note the slower twitch of D. mawsoni, and consequent increased summation at 10 Hz.
R E S U L T S
The most dramatic difference between antarctic fish and Girella tricuspidata was the efficacy of low frequency stimulation at the colder temperature. Single supramaximal pulses in both Pagothenia borchgrevinki and Dissostichus mawsoni produced large eye movements (Fig. 2). Twitch contraction time, the rate of relaxa-tion and response latency were all longer in D. mawsoni (Fig. 2; Table 1). Maximal eye deviation in the antarctic species P. borchgrevinki andZ). mawsoni (about 15 ° and 20° respectively) was produced at 50 Hz stimulation. In the temperate fish however, single stimulus pulses produced no observable eye movement, and stimulus frequen-cies of around 50 Hz were required to produce a threshold response (Fig. 3). The eye movement response in this species was still increasing at impulse frequencies of 200 Hz.
20
i-16
12
§
1
e
I I
40 80 120 160 Stimulus frequency (Hz)
[image:5.451.102.337.58.316.2]200
Fig. 3. Stimulus response curves for constant frequency pulse trains. Circles: Dissostichusmawsont; squares: Pagothenia borchgrevinki; triangles: Girella tricuspidata. Error bars indicate ± s.E.
frequency, there was an approximately linear section of the stimulus response curve, below saturation (Fig. 3). This region corresponds to the natural operating range of the oculomotor system (Montgomery, 1983; Zuber, 1968). The ' d . c ' gain (output/ input) of the oculomotor system can be specified by the slope of the stimulus response curve, and was highest inZ). mawsoni and least in G. tricuspidata (Fig. 3; Table 1). A second, independent, estimate of gain can be obtained from the ratio of the am-plitude of eye movement to the amam-plitude of sinusoidal modulation of the stimulus pulse train at low modulation frequencies (e.g. Fig. 5). Estimates of gain derived in this way agreed well with the values determined from the slopes of the stimulus response curves (Table 1).
Pulse trains, sinusoidally modulated between 0 and 40 Hz for antarctic fish and 0-160 Hz for G. tricuspidata, were used to determine the frequency response of the oculomotor systems. As modulation frequency was decreased, the resulting eye rota-tion increased in amplitude, as shown for G. tricuspidata (Fig. 4). Maximum and minimum stimulus pulse frequencies were unchanged. The response to a standard constant frequency pulse train preceding each sine wave stimulus remained constant throughout the stimulus sequence in this example.
Girella tricuspidata eye movement
t
8Hzt
4Hzt
2Hzt
lHzt
0-5 Hz [image:6.451.45.405.82.319.2]t
0-2 HzFig. 4. Eye movement record of Girella tricuspidata during presentation of a series of sinusoidally modulated pulse trains. Modulation frequency is shown below each stimulus presentation (peak-to-peak 0-160 Hz in all cases). Arrows mark the onset of a standard 200 Hz, 200 pulse constant frequency pulse train, showing the responsiveness of the preparation is unchanged. Note the decreased gain at modulation frequencies above 1 Hz.
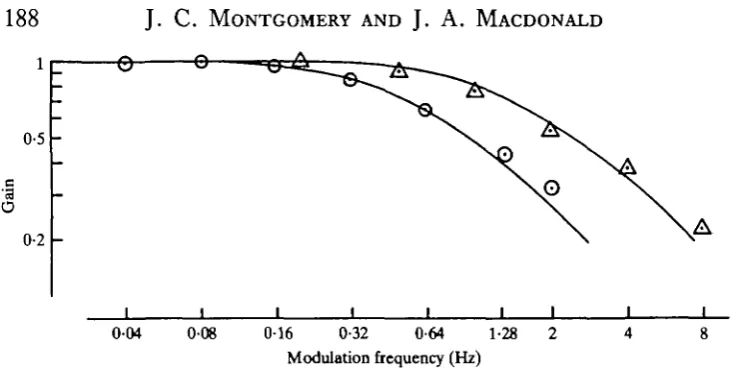
Relative gain at each modulation frequency was calculated as the ratio between gain at the chosen frequency and maximum (d.c.) gain. A Bode plot (log relative gain
versus log modulation frequency, Fig. 6) shows that within this frequency range, the
peripheral oculomotor system behaves very much as a linear first order system. The characteristic frequency (half power frequency; frequency at which response has dropped by 3 dB) of each group of fish was determined using a non-linear regression technique (Helwig & Council, 1979) to fit the best first order model of the form:
G(f) = 1 (f/fc)2
where G is gain, fc is characteristic frequency and f is modulation frequency. As the characteristic frequencies for the two antarctic species were not significantly different (Table 1) the relative gains for both have been combined and plotted in Fig. 6 along with the best-fit model. The temperate species had a significantly higher characteristic frequency, and the mean relative gain at each modulation frequency was plotted along with the best-fit model for these points.
Pagothenia borchgrevinki
Eye movement
[image:7.451.67.384.96.322.2]Vlth nerve stimulation
Fig. 5. Eye movement record of Pagothenia borchgrevinki during presentation of a sinusoidally modulated pulse train. The expanded time base of this record, and the pronounced single twitches allow comparison of the eye movement response with the reconstructed stimulus pulse train (lower trace).
increased size, so that the tension required for a given eye deviation was greater in both antarctic fish, but considerably greater in the large D. mawsoni.
Preliminary experiments were performed on the effects of acute temperature change on the characteristic frequency of the peripheral oculomotor system of G.
tricuspidata. The characteristic frequency was strongly temperature dependent,
decreasing from 1-4 Hz at 24 °C to 0-8 Hz at 16 °C and 0-25 Hz at 12°C in a 24 °C-acclimated fish.
DISCUSSION
Models of the oculomotor system
I
0-5
I
o
0-2
-0
[image:8.451.39.405.47.232.2]0-04 0-08 0 1 6 0-32 0-64 1-28 2 4 8 Modulation frequency (Hz)
Fig. 6. Normalized gain versus modulation frequency. Open circles: the combined mean response of the two antarctic fish. Open triangles: mean response of Girella tricuspidata. Solid lines are best fit theoretical models (characteristic frequencies 0 5 5 and l'4Hz respectively).
units are thought to innervate the red fibres (Gestrin & Sterling, 1977).
From information provided by Gestrin & Sterling (1977) it is possible to calculate the transfer function which relates eye movement to the firing of the phasic-tonic, or fast motor units. The modulation of discharge rate of the 'average motoneurone' (AR) is related to eye position (E) and eye velocity (dE/dt) by the following equation (Robinson, 1981):
AR = kE + r(dE/dt),
where k and r are constants. The constant k can be evaluated for goldfish from the slope of the line relating tonic frequency to eye position (Fig. 8 in Gestrin & Sterling, 1977). Assuming total eye deviation to equal 40 °, k has an average value of 3-4 (± S.D. of 1 -8; N = 14). Linear regression of burst frequency against saccade velocity (Fig. 7 in Gestrin & Sterling, 1977) for saccades initiated from middle positions yields a value for the constant r of 0-58 (S.E. of regression coefficient = 0-12). Robinson (1981) also shows that the transfer function [G(S)] derived from the preceding differential equa-tion is of the form:
G(s) =
Ts+ 1
where the time constant T = r/k = 0-17s, and hence the characteristic frequency f = (2nT)~l = 0-94 Hz. This value for the goldfish is similar to the characteristic frequency of the parore oculomotor system reported in this study: 1-4 ± 0-2Hz (± 95 % confidence interval). Temperature affects the characteristic frequency of the peripheral oculomotor system in dogfish (Montgomery & Paulin, 1984) and parore (this study); assuming the recordings in goldfish were around 18-20 °C (actual recording temperatures are not given by Gestrin & Sterling, 1977), the slightly higher characteristic frequency found in parore may be due to a higher recording temperature (24 °C).
supramaximal abducens nerve stimulation are in good agreement with the parameters determined from the firing patterns of phasic-tonic motoneurones. The slow motoneurones would not be expected to make a substantial contribution to the eye movement dynamics but would contribute to the low frequency gain, and may introduce a degree of phase lag in the response to low frequency sine wave stimulation (Montgomery, 1983).
Effects of temperature on the parameters of the model
The characteristic frequency of the peripheral oculomotor system is determined by the visco-elastic coupling of the globe to the orbit (Collins, 1971). Increasing viscosity will lower the characteristic frequency, as will decreasing elasticity. The combined effect of temperature on these two variables results in a very strong temperature dependence of characteristic frequency in the temperate fish. For G. tricuspidata acclimated to 24 °C the characteristic frequency measured at 12 °C is already consider-ably lower than that of the antarctic fish, indicating a degree of temperature com-pensation in the mechanical coupling of globe to orbit in antarctic fish. Connective tissue sheaths on the extraocular muscles of antarctic fish (J. C. Montgomery & J. A. Macdonald, unpublished observation) may provide the increased elasticity.
For a first order system, the lower the characteristic frequency the slower the response is to a given step input. Thus saccade velocity may be related to characteristic frequency, and for a given burst rate in the motoneurones a lower characteristic frequency would result in a reduced saccade velocity. The changes in characteristic frequency with temperature may thus explain some of the observed effects of tem-perature on saccade velocity. Saccade velocity decreases with decreasing temtem-perature for G. tricuspidata (Montgomery et al. 1983), but is clearly temperature compensated in antarctic fish (Montgomery & Macdonald, 1983). Presumably changes in burst rates of oculomotor neurones with temperature will also contribute to the observed effects of temperature on rates of rapid eye movement.
Changes in the characteristic frequency of the peripheral oculomotor system will also affect the degree of central processing required to produce slow compensatory eye movements. Over the working range of the vestibulo-ocular reflex, afferent input from semicircular canals is in phase with head velocity. This signal must be integrated to produce eye movements in phase with head position in order to stabilize the visual field (Carpenter, 1977). For frequencies of head movement above the characteristic frequency of the peripheral oculomotor system, this integration step can be performed by the sluggish response of the motor pathway, while at lower frequencies, this integration must be performed by the central nervous system. At present insufficient is known about the frequency match between natural head movements, vestibular input and frequency response characteristics of the oculomotor system to assess adequately the relative importance of the contribution of oculomotor dynamics to the production of accurate compensatory eye movements.
the known effects of temperature on twitch contraction. Cooling decreases the rate of muscle relaxation and hence each muscle twitch is increased in size and prolonged (Hill, 1951; Wardle, 1980; Montgomery & Macdonald, 1984). The result of these changes is to produce summation at lower frequencies of stimulation, thereby increas-ing the slope of the stimulus-response curve; i.e. increasincreas-ing gain at low temperature. Large muscles have a slower twitch response (Wardle, 1980), which explains why the oculomotor responses of D. mawsoni (Fig. 2) exhibit a larger gain than those of the smaller antarctic fish P. borchgrevinki.
The large increase in gain observed in the antarctic fish at low temperature is likely to be of biological significance in offsetting reduced rates of CNS output, and lower sensory gain expected at low temperature (Montgomery & Paulin, 1984).
The authors wish to acknowledge grants from the Medical Research Council, the University Grants Committee, and the Auckland University Research Committee. We are grateful to the staff of New Zealand's Scott Base, Antarctica, and to the staff of the Leigh Marine laboratory.
R E F E R E N C E S CARPENTER, R. H. S. (1977). Movements of the Eyes. London: Pion.
CLARKE, A. (1983). Life in cold water: the physiological ecology of polar marine ectotherms. Oceanogr. mar.
biol. A. Rev. 21, 341-453.
COLLINS, C. C. (1971). Orbital mechanics. In The Control of Eye Movements, (eds P. Bach-y-rita, C. C. Collina & J. Hyde), pp. 283-325. New York: Academic Press.
DEVRIES, A. L. (1980). Biological antifreezes and survival in freezing environments. In Animals and
Environ-mental Fitness, (ed. R. Giles), pp. 583-607. Oxford, New York: Pergamon Press.
FRIEDLANDER, M. J., KOTCHABHAKDI, N. & PROSSER, C. L. (1976). Effects of cold and heat on behaviour and cerebellar function in goldfish. J. comp. Physiol. 112, 19-45.
GESTRIN, P. & STERLING, P. (1977). Anatomy and physiology of goldfish oculomotor system. I I . Firing patterns of neurons in abducens nucleus and surrounding medulla and their relation to eye movements.
J. Neuwphysiol. 40, 573-588.
HELVERSEN, O. N. & ELSNER, N. (1977). The stridulatory movements of acridid grasshoppers recorded with an opto-electronic device. J . comp. Physiol. 122, 53-64.
HELWIG, J. T . & COUNCIL, K. A. (1979). The Statistical Analysis System User's Guide. North Carolina: S.A.S. Institute.
H u x , A. V. (1951). The influence of temperature on the tension developed in an isometric twitch. Proc.R. Soc.
Land. B 138, 349-354.
LITTLEPAGE, J. L. (1965). Oceanographic investigations in McMurdo sound, Antarctica. In Biology of the
Antarctic Seas, Vol. 2, (ed. G. A. Llano), pp. 1-37. Washington: American Geophysical Union.
MCCARTHY, D. (1982). Temperature effects upon the Parore oculomotor system. MSc thesis, University of Auckland.
MACDONALD, J. A. (1981). Temperature compensation in the peripheral nervous system: antarctic vs. tem-perate poikilothenns. J. comp. Physiol. 142, 411-418.
MACDONALD, J. A. & MONTGOMERY, J. C. (1982). Thermal limits of neuromuscular function in an antartic fish. J . comp. Physiol. 147, 237-250.
MONTGOMERY, J. C. (1983). Eye movement dynamics in the dogfish. J. exp. Biol. 105, 297-304.
MONTGOMERY, J. C. (1984). Low temperature increases gain in the fish oculomotor system. J . Neurobiol. IS, 295-298.
MONTGOMERY, J. C. & MACDONALD, J. A. (1984). Performance of motor systems in antarctic fish. J. comp.
Physiol. 154, 241-248.
MONTGOMERY, J. C , MCVEAN, A. & MCCARTHY, D. (1983). Effects of lowered temperature on spontaneous eye movements in a teleost fish. Comp. Biochem. Physiol. 75A, 363—368.
MONTGOMERY, J. C. & PAULIN, M. G. (1984). The effects of temperature on the characteristics of the dogfish oculomotor system, jf. exp. Biol. 113, 101-107.
ROBINSON, D. A. (1981). The use of control systems analysis in the neurophysiology of eye movements. A. Rev.
Neumsd. 4, 463-503.
STERLING, P. (1977). Anatomy and physiology of goldfish oculomotor system. I. Structure of abducens nucleus.
J. Neutvphysiol. 40, 557-572.
WAKDLE, C. S. (1980). Effects of temperature on the maximum swimming speed of fishes. In Environmental
Physiology of Fishes, (ed. M. A. Ali), pp. 519-531. New York: Plenum Press.