Accepted Manuscript
Title: Ordered polyhedral foams in tubes with circular,
triangular and square cross-section
Authors: S.T. Tobin, J.D. Barry, A.J. Meagher, B. Bulfin, C.E.
O’Rathaille, S. Hutzler
PII:
S0927-7757(10)00645-X
DOI:
doi:10.1016/j.colsurfa.2010.11.024
Reference:
COLSUA 16719
To appear in:
Colloids and Surfaces A: Physicochem. Eng. Aspects
Received date:
5-10-2010
Revised date:
4-11-2010
Accepted date:
9-11-2010
Please cite this article as: S.T. Tobin, J.D. Barry, A.J. Meagher, B. Bulfin, C.E.
O’Rathaille, S. Hutzler, Ordered polyhedral foams in tubes with circular, triangular
and square cross-section,
Colloids and Surfaces A: Physicochemical and Engineering
Aspects
(2010), doi:10.1016/j.colsurfa.2010.11.024
Accepted Manuscript
Ordered polyhedral foams in tubes with circular,
triangular and square cross-section
S.T. Tobina,∗, J.D. Barrya, A.J. Meaghera, B. Bulfina, C.E. O’Rathaillea, S.
Hutzlera
aSchool of Physics, Trinity College Dublin, Dublin 2, Ireland
Abstract
Soap bubbles of equal volume readily crystallize as ordered polyhedral foam structures when introduced into tubes whose width is of the same order as the bubble diameter. In the past a large number of these structures have been identified experimentally for cylindrical tubes. The surface energy per bubble was computed using Ken Brakke’s Surface Evolver software. We have now extended this work to tubes with square and triangular cross-section and present both experimental data and results of Surface Evolver calculations for a variety of new ordered foam structures. The result is a catalogue of all structures for which simulation results exist.
Keywords: ordered structure, foam structure, foam modelling
1. Introduction
When soap bubbles of equal volume are introduced into tubes they readily crystallize as ordered polyhedral foam structures, provided that the tube diam-eter is of the same order as the bubble diamdiam-eter (and larger than the capillary length, in order to form dry foams [1]). This phenomenon was noted as early as 1933 by Mann and Stephens [2], who reported three ordered structures in tubes of cylindrical cross-section.
In recent years monodisperse foams have enjoyed renewed interest as objects of study [3], with a large number of ordered monodisperse structures identified experimentally incylindrical tubes [4, 5] for foams (and emulsions [6]). Several structures have also been identified in the square geometry [7]. While in the simplest of these structures all bubbles are in contact with the tube wall, several contain at least one bulk bubble per unit cell.
The goal of this article is to provide a comprehensive catalogue of the sim-plest structures for which simulation results exist. We also present new results
∗Corresponding author
Email address: [email protected] (S.T. Tobin)
Accepted Manuscript
from experiment and simulation for tubes with triangular and squarecross-sections.
Such ordered foam structures may have direct applications in discrete mi-crofluidics and lab-on-a-chip technologies. Mimi-crofluidics is the science and tech-nology of systems that process or manipulate small amounts of fluids using channels with dimensions of tens to hundreds of micrometers [8]. Discrete mi-crofluidic systems employ droplets, bubbles, or foams [9, 10, 11], with applica-tions on the larger-than-micron scale. Studying the structure and rheology of confined foams (and emulsions) will be key to designing such systems.
2. The Study of Ordered Foams in Confinement
2.1. Experimental Methods
An experimental set-up that may be conveniently used to produce ordered foam structures is sketched in Figure 1. A glass or perspex tube of diameter 1–2 cm is partly submerged in a surfactant solution (commercial detergents which produce very stable foams are sufficient for these types of experiments which are concerned with foam structure only). Air or nitrogen gas is injected into the solution at the submerged end of the tube (through a capillary). Monodispersity of bubbles is achieved by using a pump or gas storage tank to ensure constant gas pressure. The bubble size is controlled via the diameter of the capillary opening and the gas pressure. As the bubbles are collected in the tube, they readily self-assemble into ordered structures, such as that shown in Figure 2.
The type of structure formed as the bubbles fill the tube is crucially depen-dent on the ratioλof the tube diameter to the bubble diameter. In the earliest comprehensive study conducted, Weaireet al.[12] identified 11 structures using a setup of the type shown in Figure 1. Pittetet al. [4] extended the catalogue of cylindrical structures to 37 and included the ranges ofλfor eleven of these. However, only nine of these structures have ever been simulated [5, 13].
The experimental determination of bubble volume and ofλis as follows:
1. A long column of the desired structure is allowed to form. The length
l of a section of the tube that contains a multiple of the unit cell (i.e., the simplest periodic subset of the structure) of the ordered structure is measured. The volume of this section is therefore
Vtot=Acsl (1)
whereAcs is the cross-sectional area of the tube.
2. The volume of a single bubble Vb is then calculated by dividing Vtot by the product of the number of bubbles in a unit cell of the structure and the number of unit cells in the section. The equivalent sphere radius of a bubble is then given by:
r=
3Vb
4π 1/3
Accepted Manuscript
Figure 1: A schematic representation of the apparatus used to produce orderedfoam structures. Equal bubble volume, achieved by having constant air-flow, is the most important factor for obtaining ordered foam structures.
3. The ratioλof characteristic tube width to bubble radius is then calculated, based on the definitions displayed in Figure 3.
As can be seen from the definition ofλ, it may be varied by either varying the tube diameter (by choosing a different tube) or by varying the bubble diameter. Varying the latter allows for smooth changes, as the bubble volume is easily controllable by adjustments of the gas pressure.
An additional adjustment mechanism is available when studying ordered foams using ferrofluids (to which surfactant is added) [14, 15]. In this case, bubble volume may be controlled by applying a magnetic field close to the nozzle and varying the field strength, to change the effective buoyancy of the emerging bubbles.
Yet another experimental method (which would deserve to be further inves-tigated) for adjusting bubble volume was developed by Boltenhagenet al.[16]. An ordered foam structure was created in a cylindrical tube, consisting of a fixed number of bubbles N. The structure is confined between a stopper and a mov-able piston. Moving the piston allowed the volume of the bubbles to be changed continuously. By compressing and dilating (up to 500% of initial volume) the foam, structural transitions could be induced.
Accepted Manuscript
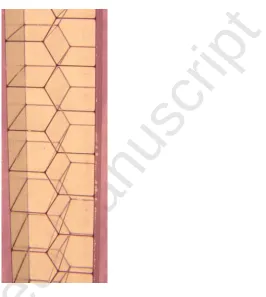
Figure 2: An example of an ordered foam structure in a tube with square [image:5.612.251.517.134.431.2]cross-section (side length 1 cm). The structure has two bubbles per unit cell and is recorded as s-2.
Accepted Manuscript
2.2. Simulation Methods
The question arising from confined foam experiments is: for some given λ
value, what determines which ordered structure forms, or which alternatives are available? It is hypothesised that the structure that forms is generally the structures with least surface energy, although the hysteresis issues discussed above play an important role in experiment.
The surface energy of the confined foam structures may be calculated by computer simulation [5, 7, 13, 17] using Ken Brakke’s Surface Evolver soft-ware [18]. This softsoft-ware enables the computation of cellular structures of mini-mal surface area for a given topology. This ‘input’ topology is generally obtained from careful visual analysis of an experimentally obtained structure.
The simulations carried out treat the foams as infinitesimally dry (i.e., zero film and Plateau border thickness), which is a reasonable approximation to the experimental conditions for the dry foam structures reported here (with liquid fraction less than 1%). In foams with bubbles with diameter of the order of the capillary length, the liquid fraction is considerably higher (up to 36% [19]) which would require different simulation methods.
The simulation of structures which are periodic in one direction only (i.e., along the tube) suggests the use of the Surface Evolver’s Torus model [20]. The surface of the structure is represented computationally by a discretized mesh, which can be refined to increase the number of surface elements and hence achieve more accurate modelling (the points on the mesh can be averaged to ensure uniformity of surface coverage). Surface minimization is performed at every refinement stage.
The default energy minimization method used by the Surface Evolver is gra-dient descent [21]. This technique moves points on the surface mesh in the direc-tion negative to the gradient of the energy vector i.e., in the direcdirec-tion of steepest descent. However, gradient descent is a first-order method and successive steps can be inefficient, as the solver ‘zig-zags’ towards a (local) energy minimum. The Surface Evolver provides a higher-order (and much more efficient) method called conjugate gradient descent [21]. This method combines information from previous steps to find a more direct route to the energy minimum.
A robust minimization technique therefore involves applying conjugate gra-dient descent to successive mesh refinements until the surface is deemed suffi-ciently close to equilibrium. At this point the Hessian minimization [22] may be used. The Hessian command solves the Hessian matrix and determines its eigenvalues to jump directly to an energy minimum. The Hessian matrix is the square matrix of the second-order partial derivatives of the surface energy func-tion; that is, it describes the local curvature of surface energy. If the Hessian is positive definite at some point x, then x is a local minimum of the function. Where the Hessian command can not be used successfully (i.e., for some struc-tures in the cylindrical geometry), extensive conjugate gradient minimization must be carried out.
Accepted Manuscript
structure is then minimized, resulting in one energy value for the given value ofλand the given topology. This contrasts with experiment, where the tube size is fixed and the bubble size is varied.
In this paper we present energy per bubble in the periodic unit cell of the foam. Values for energy are obtained in units ofγVB2/3 where γ is the surface tension andVB is the bubble volume.
In these simulations it is generally found that there is a finite range ofλfor which a structure of a given topology can be minimized. The endpoints of these ranges indicate required structural changes, at which an edge length or face area shrinks to zero. The Surface Evolver cannot deal with the required topological change, so once a topology becomes ‘impossible’ an alternative topology must be entered manually (based on experimental observations). An example of such a change is shown in Figure 4, where the decrease in λ leads to the gradual shrinking of a square face. Figure 5 shows how values for the decreasing surface area of a face may be extrapolated to find a stability bound for a particular structure.
Figure 4: The onset of a topological change in the Goldberg-3 (G-3, see Sec-tion 3.1 structure is shown above. As λ is decreased, the upper edge of the highlighted face shrinks, eventually disappearing atλ= 1.8. This is the lower bound for this structure. The upper bound may be found by increasingλand watching for similar topological changes. Note that all images shown correspond to fully minimized structures (for the given value ofλ).
Accepted Manuscript
Figure 5: The limit of stability for a structure of given topology may be foundAccepted Manuscript
Figure 6: Asλis increased past 1.9, s-1 (the “bamboo” structure) is no longerthe structure of lowest energy. Note however that in experiments the transition to s-2 (“staircase”) does not occur where the energy curves overlap but instead atλ= 2.2.
3. Catalogue of Structures
This section consists of a catalogue of all experimentally observed dry or-dered foam structures in confined geometries which have also been successfully simulated.
The results for the circular section, and some for the square cross-section, have been previously published by us. We include them here (see Figure 7) for completeness of the catalogue and in a unified style combining experimental and numerical results. The computed values of surface energy per unit cell are shown as bold lines for the range ofλwhere the structure has been observed experimentally. We also show upper and lower bounds of stability for the structures, as obtained from our simulations.
Tables 1, 2 and 3 give experimentally obtained ranges of λ, together with upper and lower bounds of stability (where available) from simulations, see Section 2.2 for details.
As a rule of thumb, when structures can be compared across different tube geometries (with equal number of bubbles per unit cell), the cylindrical structure will have the lowest minimum energy, followed by the square structure, with the triangular structure having the highest.
3.1. Circular Cross Section
Accepted Manuscript
The surface can be ‘rolled out’ on a plane, and is conveniently described aphyllotactic nomenclature [25] (arising from the description of the arrangements of leaves on plants). According to this notation, all structures are annotated by the parameters l, m, n with l = m+n. These parameters relate to the description of the structure as a spiral: a strip whose width contains m or n hexagons can be wound on the cylinder to create a structure.
This notation fails for the simplest (bamboo) structure, and also for any structures involving bulk cells. We have nevertheless decided to include the notation in Figure 7 and Table 1 to facilitate comparison with earlier work. We chose a different notation for the structures in the square and triangular confinements.
Figure 7 shows the energy profiles for the structures as obtained from Surface Evolver calculations. Observed experimental ranges are marked as bold lines over the simulated results.
The experimental ranges for each structure are provided in Table 1, with bounds of stability as determined from simulation. Examples of experimentally observations and simulation are shown in Figure 8.
It is obvious from Figure 7 that the Surface Evolver simulations are not sufficient to determine the ranges of stability for the observed structures, which are, however, hard to obtain with accuracy in experiment (see Section 2.1). Note however that the observed ranges always include the respective minimum values for energy.
As the value of λ is increased, the surface energy becomes dominated by the bulk, and for this reason we have included the energy of a bulk Kelvin foam (consisting of multiples of Kelvin’s tetrakaidecahedron) as a dotted line in Figure 7. This decrease towards a bulk value is even more visible in our simulations of square structures (Figure 9) in the next section.
3.2. Square Cross-Section
Ordered foam structures in tubes with a square cross-section, produced by glueing four perspex tubes together, have previously been studied in [7]. We will label the structures s-N, where s stands for ‘square’ and N is the number of bubbles in the unit cell.
Previously, only four structures (s-1, s-4, s-9, s-16) had been found experi-mentally [7], although it was argued that more structures should be expected, filling in gaps in the observed number of bubbles per unit cell. We have now carried out further experiments, leading to the identification of a total of 7 such square structures. Each of these has also been simulated using the Surface Evolver. Figure 9 shows the corresponding energy profiles, and Table 2 shows the ranges ofλ (both experimental and simulated). Examples of structures in the square geometry are shown in Figure 2 and Figure 10.
3.3. Triangular Cross-Section
Accepted Manuscript
Figure 7: Energy profiles for all simulated cylindrical structures -Accepted Manuscript
Structure Experimental Range λmin λmax110 0.44≤λ≤1.25 0 ∞
211 1.05≤λ≤1.53 -
-220 1.10≤λ≤1.24 -
-321 1.25≤λ≤1.83 -
-330 1.53≤λ≤1.68 -
-422 1.25≤λ≤1.98 -
-550 (G-0) 1.55≤λ≤2.38 1.43 2.92 Goldberg (G-3) 2.36≤λ≤2.39 1.76 2.86 633-1k (Kelvin) 2.22≤λ≤2.56 1.60 ∞
Table 1: Table ofλvalues for structures formed in the cylindrical cross-section that have been successfully simulated. The bounds of stability (calculated from Surface Evolver simulations) are shown where known. Note that these bound-aries bracket the experimental values. Data regarding structures denoted in phyllotactic notation has been taken from [4] for experiment and [13] for simu-lation.
Structure Experimental Range λmin λmax
s-1 1.75≤λ≤2.08 0 ∞
s-2 2.22≤λ≤2.65 1.27 3.90 s-4 2.75≤λ≤3.60 2.06 4.61 s-14 3.54≤λ≤3.61 2.78 5.30 s-6 3.73≤λ≤3.90 2.92 5.40 s-9 4.31≤λ≤5.21 3.80 6.20 s-16 5.77≤λ≤6.63 5.05 7.62
Accepted Manuscript
(a)
(b)
Accepted Manuscript
Figure 9:Energy profiles for all known square structures- Results ofAccepted Manuscript
(a)
(b)
Accepted Manuscript
with square tubes, the triangular tubes are produced by glueing together sheetsof perspex. For convenience, we will refer to structures in tubes of triangular cross-section as “triangular structures”, and label them as t-N (where t stands for ‘triangle’ and N is the number of bubbles in the unit cell).
Surface Evolver simulations of all four experimentally observed triangular structures have been performed. The energy profiles for the structures are displayed in Figure 11. The experimental ranges for each structure are provided in Table 3, with bounds of stability as determined from simulation. Examples of experimentally observations and simulation are shown in Figure 12.
Accepted Manuscript
(a)
(b)
Accepted Manuscript
Structure Experimental Range λmin λmaxt-1 2.27≤λ≤3.47 0 ∞
t-2 λ= 3.58 3.0 ∞
t-3 3.91≤λ≤4.92 1.77 ∞ t-6 5.28≤λ≤6.19 3.3 ∞
Table 3: Table ofλvalues for structures formed in the triangular crosssection -including bounds of stability where known. Note that these boundaries always bracket the experimental values (t-2 was only experimentally observed once).
4. Conclusions & Outlook
We have presented above a comprehensive overview of the simpler ordered foam structures that form in confinements of circular, square, and triangular cross-section. Simulations with the Surface Evolver allow us to numerically calculate the dependence of surface energy onλand the limits of stability. We find that the ranges over which structures form generally tend to lie in regions where that structure has lower energy than the available alternatives.
It is possible to conceive of and simulate many more such structures (within theλranges considered). However, it is likely that they are very hard to achieve experimentally. For example, there was considerable difficulty in observing the t-2 structure (due to the presence of alternative lower-energy structures, see Figure 11), and the Goldberg-3 required a modification of the standard produc-tion procedure [5]. In some cases, structures were observed when a lower-energy structure was available at thatλvalue. This can be attributed to a history ef-fect in the system (see Section 2.1), where bubbles pack onto bubbles already in the tube. This ‘template’ may prevent lower-energy structure from forming. In future work, templates may be fabricated to encourage the deliberate formation of desired structures.
Our future work in this area will now focus on Surface Evolver simulation of moderately wet confined foam structures, with liquid fraction of up to 10%. By calculating energy as a function of the liquid fraction, comparisons may be made to experimental work on transitions between structures as the liquid fraction is slowly increased [26].
For even higher values of liquid fraction the bubbles take on more spherical shapes. Their packing is then more akin to the packing of spheres. The com-parison of sphere packings in cylindrical tubes with such bubble packings will be addressed in a future paper by Meagheret al. [27].
Acknowledgements
Accepted Manuscript
and AO-99-075:C14308/00/NL/SH), the Irish Research Council for Science,Accepted Manuscript
References[1] D. Weaire, S. Hutzler, The Physics of Foams, Clarendon Press, Oxford, 1999.
[2] W. Mann, R. Stephens, Bubble formation in glass tubes, Philosophical Magazine Series 7 15 (1933) 143 – 146.
[3] W. Drenckhan, D. Langevin, Monodisperse foams in one to three dimen-sions, Current Opinion in Colloid & Interface Science 15 (2010) 341–358.
[4] N. Pittet, N. Rivier, D. Weaire, Cylindrical packings of foam cells, Forma 10 (1995) 65–73.
[5] M. Saadatfar, J. Barry, D. Weaire, S. Hutzler, Ordered cylindrical foam structures with internal bubbles, Phil. Mag. Lett. 88 (2008) 661–668.
[6] S. Hutzler, N. P´eron, D. Weaire, The foam/emulsion analogy in structure and drainage, The European Physical Journal E 14 (2004) 381–386.
[7] S. Hutzler, J. Barry, P. Grasland-Mongrain, D. Smyth, D. Weaire, Or-dered packings of bubbles in columns of square cross-section, Colloids and Surfaces A: Physiochemical and Engineering Aspects 344 (2008) 37–41.
[8] G. Whitesides, The origins and the future of microfluidics, Nature 442 (2006) 368–373.
[9] W. Drenckhan, S. Cox, G. Delaney, H. Holste, D. Weaire, N. Kern, Rhe-ology of ordered foams–on the way to discrete microfluidics, Colloids and Surfaces A: Physiochemical and Engineering Aspects 263 (2005) 52–64.
[10] C. Priest, S. Herminghaus, R. Seemann, Generation of monodisperse gel emulsions in a microfluidic device, Applied Physics Letters 88 (2006) 024106.
[11] E. Surenjav, C. Priest, S. Herminghaus, R. Seemann, Manipulation of gel emulsions by variable microchannel geometry, Lab on a Chip 9 (2009) 325–330.
[12] D. Weaire, S. Hutzler, N. Pittet, Cylindrical packings of foam cells, Forma 7 (1992) 259–263.
[13] D. Weaire, G. Bradley, R. Phelan, Speculations and calculations in the physics of foams, in: A. Skjeltorp, S. Edwards (Eds.), Soft Condensed Matter: Configurations, Dynamics and Functionality, Kluwer Academic Publishers, 2000, pp. 247–268.
Accepted Manuscript
[15] W. Drenckhan, F. Elias, S. Hutzler, D. Weaire, Bubble size control andmeasurement in the generation of ferrofluid foams, Journal of Applied Physics 93 (2003) 10078.
[16] P. Boltenhagen, N. Pittet, N. Rivier, Giant deformations and topological hysteresis of an ordered foam, EPL (Europhysics Letters) 43 (1998) 690– 694.
[17] D. Weaire, R. Phelan, Cellular structures in three dimensions, Philosoph-ical Transactions: MathematPhilosoph-ical 354 (1996) 1989–1997.
[18] K. Brakke, The Surface Evolver, Experiment. Math. 1 (1992) 141–165.
[19] A. van der Net, W. Drenckhan, D. Weaire, S. Hutzler, The crystal structure of bubbles in the wet foam limit, Soft Matter 2 (2006) 129–134.
[20] K. Brakke, J. Sullivan, Using symmetry features of the Surface Evolver to study foams, in: K. Polthier, H. Hege (Eds.), Mathematics and Visualiza-tion, Springer Verlag, 1997, pp. 95–117.
[21] W. H. Press, B. P. Flannery, S. A. Teukolsky, W. T. Vetterling, Numerical Recipes in C : The Art of Scientific Computing, Cambridge University Press, 1992.
[22] K. Brakke, The Surface Evolver and the stability of liquid surfaces, Philo-sophical Transactions: Mathematical, Physical and Engineering Sciences (1996) 2143–2157.
[23] N. Pittet, P. Boltenhagen, N. Rivier, D. Weaire, Structural transitions in ordered, cylindrical foams, EPL (Europhysics Letters) 35 (1996) 547–552.
[24] S. Hutzler, D. Weaire, R. Crawford, Moving boundaries in ordered cylin-drical foam structures, Philosophical Magazine B 75 (1997) 845–857.
[25] R. Jean, Phyllotaxis: A Systemic Study in Plant Morphogenesis, Cam-bridge University Press, 1994.
[26] S. Hutzler, D. Weaire, R. Crawford, Convective instability in foam drainage, EPL (Europhysics Letters) 41 (1998) 461–465.