1
Long-Term Imaging of Cellular Forces with
High Precision by Elastic Resonator Interference
Stress Microscopy
Nils M. Kronenberg1, Philipp Liehm1, Anja Steude1, Johanna A. Knipper2, Jessica G. Borger2,+,
Giuliano Scarcelli3, Kristian Franze4, Simon J. Powis5, Malte C. Gather1,*
1) SUPA, School of Physics and Astronomy, University of St Andrews, St Andrews, UK 2) Institute of Immunology and Infection Research, University of Edinburgh, Edinburgh, UK
3) Fischell Department of Bioengineering, University of Maryland, College Park, MD, USA 4) Department of Physiology, Development and Neuroscience, University of Cambridge, Cambridge, UK
5) School of Medicine, University of St Andrews, St Andrews, UK
Abstract
Cellular forces are crucial for many biological processes but current methods to image them
have limitations with respect to data analysis, resolution and throughput. Here, we present a
robust approach to measure mechanical cell-substrate interactions in diverse biological
systems by interferometrically detecting deformations of an elastic micro-cavity. Elastic
Resonator Interference Stress Microscopy (ERISM) yields stress maps with exceptional
precision and large dynamic range (2 nm displacement resolution over a >1 µm range,
translating into 1 pN force sensitivity). This enables investigation of minute vertical stresses
(<1 Pa) involved in podosome protrusion, protein specific cell-substrate interaction and
amoeboid migration through spatial confinement in real time. ERISM requires no zero-force
reference and avoids phototoxic effects, which facilitates force monitoring over multiple days
and at high frame rates and eliminates the need to detach cells after measurements. This
allows observation of slow processes like differentiation and further investigation of cells, e.g.
by immunostaining.
* correspondence: [email protected]
2
Introduction
Cells sense mechanical cues and constantly probe the mechanical properties of their
environment (mechano-sensing)1. Mechanical stimuli at the cellular level play an important
role in cell function, e.g. migration and differentiation, as well as in tissue-level processes, e.g.
morphogenesis, tumour growth and immune response2–7. Forces exerted by cells are also
fundamental for many other physiological processes such as locomotion (e.g. during immune
response or tumour metastasis), cell growth, wound healing, tissue formation and repair, and
extracellular matrix deposition8–14.
Mechanical interaction between a cell and its substrate can occur through various
mechanisms. During mesenchymal migration, lateral mechanical forces generated by the
cytoskeleton are transferred to the extracellular matrix via firm focal adhesion protein
complexes15. In other cases, forces act perpendicularly to the substrate and there is rapidly
increasing interest in the role these vertical forces play, e.g. during the extension of special
cellular processes such as podosomes16 or during amoeboid migration in spatial confinement
where non-specific cell-substrate interactions such as friction and pushing are important17–19.
The forces involved in these diverse mechanical interactions are expected to vary
substantially in magnitude, spatial distribution and temporal evolution. Being able to monitor
them in a robust and non-disruptive manner is thus critical to advancing our understanding.
Early studies obtained semi-quantitative maps of forces by direct observation of
wrinkles that cell-generated forces induce in elastomer substrates20,21. Currently, the most
widely used methods for imaging cellular forces (i.e. to record stress or force maps) are
traction force microscopy (TFM)22–28 and the use of micro-fabricated elastic micro-pillar
arrays8,29,30. (See Ref. 31 for a review on presently available methods.) TFM and micro-pillar
arrays are based on tracking displacement of fluorescent particles in hydrogels and bending
of individual elastic pillars, respectively. While being powerful, these methods are indirect; in
most cases the data analysis requires zero-force reference images, particularly if cell-induced
substrate deformations are <200 nm29,32. For these reference images cells have to be
removed from the substrate, rendering them unavailable for further investigations. There
have been attempts to obviate the need for disruptive cell removal in TFM by using highly
regular meshes or grids to record cell induced substrate deformations but even under
3
and require rather involved sample preparation32–34. Furthermore, fluorescence microscopy
is often needed, which can be associated with photo-toxicity. Micro-pillar arrays and TFM also
have limited sensitivity to vertical forces. For instance, measuring the weak vertically-directed
protrusive forces exerted by podosomes has necessitated a specialized detection scheme
based on atomic force microscopy (AFM)16. What is currently missing is a more generally
applicable method to image cellular forces that allows cells to be retained on the substrate
for subsequent measurements and is capable of resolving weak forces with reasonable
throughput.
Here, we address this need by introducing Elastic Resonator Interference Stress
Microscopy (ERISM), an approach for direct, robust and non-destructive imaging of forces
associated with various types of mechanical cell-substrate interactions. While most existing
methods use localization microscopy or direct imaging of surface deformations, ERISM
detects cell-induced substrate deformations interferometrically by using an elastic optical
micro-resonator and thus provides unprecedented sensitivity. We are able to resolve not only
forces exerted by cells that form firm focal adhesion contacts to the substrate but can also
detect protein-specific cell-substrate interaction and quantify the much weaker vertical
forces (down to piconewtons) associated with amoeboid-type cell migration through
confined environments and with the protrusion of podosomes. ERISM requires no zero-force
reference image, which eliminates the need to detach non-migrating cells after a
measurement and enables continuous, long-term measurements of multiple cells on one
substrate as well as further investigation of the cells, e.g. by immunostaining. Being a
wide-field imaging method, ERISM determines the local deformation at each point of the image
simultaneously and requires only low light intensities, thus facilitating observation of multiple
cells at once without inducing photo-damage to the cells.
Results
Concept and validation of ERISM
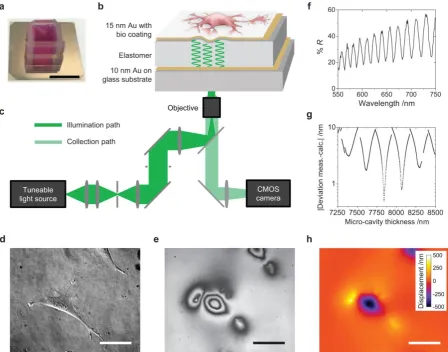
Cells were grown on a protein-coated elastic optical micro-cavity consisting of a layer of an
ultra-soft siloxane-based elastomer (stiffness 1.3 kPa, thickness (8±0.5) µm; unless stated
4
Supplementary Fig. 1a-d for details on gold-elastomer interface). Forces applied by cells were
mapped with the microscope setup schematically shown in Figure 1c. Cells of interest were
identified by conventional phase contrast or fluorescence microscopy (Fig. 1d). The reflection
of the micro-cavity was then imaged under illumination with monochromatic light of a certain
wavelength (Fig. 1e, Supplementary Fig. 1e). When a cell locally deformed the micro-cavity,
a fringe pattern was formed. (At the position of each dark fringe, the incident light coupled to
a resonant mode of the micro-cavity.) This fringe pattern provided a direct measure of how
much the cells deformed the substrate, with each fringe corresponding to a ≈200 nm
deformation. To obtain a more accurate deformation map, reflectance images were recorded
for a set of different illumination wavelengths. This yielded the reflectance as a function of
wavelength (Fig. 1f) and thus the local resonance wavelengths of the micro-cavity for every
pixel within the field of view. The actual thickness and cell-induced deformation for each pixel
were then obtained by fitting the measured resonance wavelengths with an optical model
using a fast look-up table-based fitting algorithm (Fig. 1g-h).
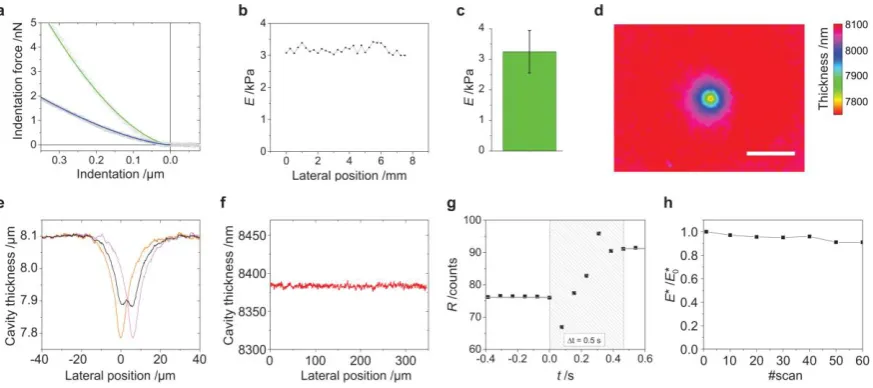
We used AFM and a corrected Hertz model to quantify the mechanical properties of
the elastic micro-cavities (Fig. 2a)35. Micro-cavities used in this study had an apparent stiffness
of 3.2 kPa, in the same range as many relevant types of tissue36, and showed low stiffness
variation across their surface (Fig. 2b) and between batches (Fig. 2c). Figure 2d shows an
ERISM thickness map for a micro-cavity into which an AFM probe was indented. Using
finite-element-method (FEM) modelling we converted this indentation profile – or later, cell
induced deformations – into a map of locally applied stress (Online Methods,
Supplementary Fig. 1f) and found the forces obtained by the FEM model to be within 20% of
the AFM set-force. By analysing the width of the AFM indentation, we estimated that the
lateral resolution of ERISM is 1.6 µm (Fig. 2e), which is similar or better than values achieved
with super-resolution TFM28 and the latest generation arrays of sub-micrometre sized elastic
pillars30. Due to the interference-based measurement principle, ERISM measures the cell
induced vertical substrate deformation with much higher resolution; in the present study, the
displacement resolution was 2σrms = 2 nm (limited by the surface roughness of the
micro-cavity and pixel noise, Fig. 2f). The temporal resolution, i.e. the relaxation response time of
the elastic micro-cavity, was < 0.5 s (Fig. 2g). We also tested the mechanical stability of the
5
cell culture conditions (up to two weeks) and observed no significant changes (Fig. 2h and
Supplementary Video 1).
To demonstrate the broad applicability of ERISM, we next discuss mechanical
measurements for several cell types and forms of cell-substrate interaction.
Localized vertical forces of podosome protrusion
The forces macrophages apply during podosome protrusion are perpendicular to their
substrate and too small to be resolved with TFM. Podosomes are small (<1 µm), cylindrical,
actin-based structures on the ventral side of the plasma membrane that are formed by many
different cell types, e.g. invasive cancer cells and macrophages16. They play a critical role in
cell migration and invasion into tissue, and it has recently been shown that they perform
mechanosensing by protruding into their substrate16. Here we exploited the unprecedented
vertical resolution of ERISM to resolve the protrusive forces of podosomes in primary human
macrophages (Supplementary Fig. 2).
Figure 3a shows a phase contrast and an ERISM image of a macrophage on a
collagen-coated ERISM micro-cavity. The ERISM data showed an unstructured broad pushing of the
main cell body into the substrate and pulling at the cell periphery. However, there is also a
more subtle substructure underneath the cell, which we hypothesized may be associated with
podosomes protruding into the substrate. To visualize this structure more clearly, we
removed the broad features via spatial Fourier filtering (cut-off frequency ≈0.5 µm-1; Fig. 3a
bottom and Fig. 3b). This revealed a large number of weak and tightly confined pushing sites
(peak stress ≈10 Pa; diameter, 1-2 µm) which are surrounded by even weaker partial rings of
upward pulling. Immunocytochemistry suggested that these features indeed corresponded
to podosomes (Fig. 3g, see below). Although the deformations, stresses and integrated forces
exerted by the podosomes were substantially smaller than what is usually observed for focal
adhesions of e.g. fibroblasts22,28, and even though the podosome indentations were often less
than 2 µm apart, they were clearly resolved by ERISM. Using time-lapse measurements, we
analysed the temporal evolution of the mechanical action of podosomes for a large number
of podosomes and found a pronounced oscillatory behaviour (period of force oscillation
(41±10) s, Figure 3c-d and Supplementary Video 2), consistent with earlier studies using a
6
We next investigated podosome behaviour during cell migration where their activity
is believed to be most important37. Figure 3e shows phase contrast and Fourier-filtered ERISM
time-lapse images of the leading process of a macrophage (also see Supplementary Video 3).
Over 1 h, the leading edge expanded by 40 µm. This was accompanied by formation of
protrusions in a region ≈5 µm away from the leading edge of the cell. Figure 3f shows a
kymograph of the mean applied stress along the direction of cell migration. The forces
generated by podosomes in the region around the leading edge of the cell oscillated over time
(Fig. 3f; red arrows indicate times of maximum pushing). The oscillations were likely
associated with the speed of cell expansion as maximum podosome activity was immediately
followed by stalling and in some cases even retraction (i.e. negative speed) of the leading
edge (blue arrows).
Finally, to confirm that the observed structures were indeed podosomes, we fixed the
cells on the micro-cavity immediately after recording an ERISM image, immunostained for
actin and vinculin and performed epi-fluorescence imaging through the micro-cavity
substrate (Fig. 3g). This revealed a characteristic podosome dot-pattern with small actin-rich
spots surrounded by vinculin rich regions (the soft substrate led to some mislocalization of
vinculin16). The actin-rich spots co-localized with pushing sites in the stress map and the
surrounding vinculin-rich regions co-localized with the weaker ring-shaped pulling.
Diffuse forces during amoeboid migration in confined environments and adhesion receptor specific cell-substrate interaction
While the podosome protrusions discussed above represent very localized cell-substrate
interactions, other cell types, such as amoebae, transmit more diffuse vertical stresses
through transient adhesion contacts when migrating in a three-dimensional
environment17,38,39. This “amoeboid migration” is also observed in embryonic cells, cancer
cells and leukocytes17,18,40. It is characterized by rapid changes in cell shape, induced by the
formation of pseudopodia and plasma membrane blebs. In spatially confined environments,
friction or “chimneying”-type locomotion, in which cells project themselves forward in
horizontal direction by applying weak vertical forces, have been proposed as mechanisms for
stress transduction17,18,38,41. However, measurements of the involved force patterns remain
challenging, mainly due to the technical difficulties in detecting the underlying small vertical
7
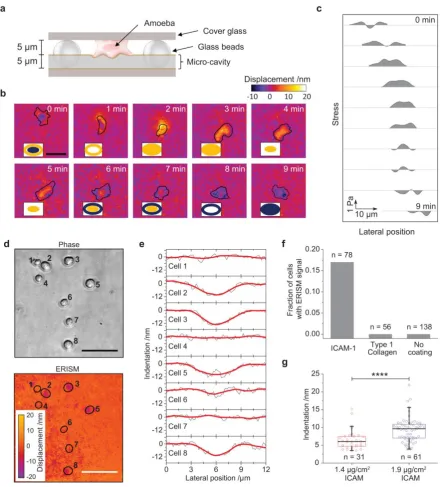
We used ERISM to study deformations induced by migrating Dictyostelium discoideum
amoebae confined within a 5 µm-thick void as illustrated in Figure 4a. During migration, a
continuous evolution of an ellipsoid push and pull pattern was observed (Fig. 4b and
Supplementary Video 4). Profiles of the stresses along the longer axis of the cell are shown
in Figure 4c to illustrate the horizontal cell migration more clearly. Importantly, horizontal
migration occurs even though the detected peak stresses were <1 Pa.
We also applied ERISM to perform wide-field imaging of adhesion receptor specific
cell-substrate interaction, specifically during the adhesion of primary murine T cells. During
lymphocyte migration and immunological synapse formation between T cells and antigen
presenting cells, T cells adhere to the extracellular matrix and to other cells42,43. The adhesion
is based on a protein complex formed between Lymphocyte function-associated antigen 1
(LFA-1) – a transmembrane integrin on the surface of T cells – and
Intercellular Adhesion Molecule 1 (ICAM-1). We measured LFA-1:ICAM-1-mediated adhesion
by investigating T cells on ICAM-1-coated micro-cavity substrates (Fig. 4d-e). During initial
contact, a significant fraction of T cells deformed the surface of these micro-cavities but no
deformation was observed for T cells on uncoated and on type 1 collagen-coated
micro-cavities (Fig. 4f), indicating that the surface interactions are protein specific. By analysing a
large number of indentation events, we found that the stress sustained by the micro-cavity
substrate increased with the surface concentration of ICAM-1 as more LFA-1:ICAM-1
complexes can be formed at higher ICAM-1 surface concentration (Fig. 4g).
Horizontal traction stresses in mesenchymal cell migration
Next, we investigated cells that are known to apply chiefly horizontal traction forces to their
substrate when in a two-dimensional environment. Although ERISM measures vertical
deformations of the micro-cavity substrate, it is also highly sensitive to horizontal forces.
Applying a defined horizontal force to the surface of an ERISM micro-cavity with an AFM led
to local twisting of the top gold surface (Supplementary Fig. 3). The amount of twisting was
directly proportional to the applied force (150 pN per nm of twist; R2 > 0.99; n = 5 force
measurements). The origin of this twisting is somewhat related to the non-linear surface
wrinkling effect that early studies on cell generated traction forces have used20,21.
8
linear surface twisting; taking into account the 2 nm displacement resolution of ERISM, the
minimum lateral force that causes a resolvable signal above the noise floor is 300 pN.
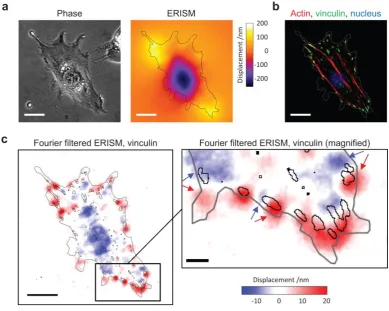
Figure 5a shows a phase contrast image and the corresponding ERISM map of an
adherent 3T3 fibroblast. The cell was fixed during the measurement and immunolabelled for
actin and vinculin (Fig. 5b and Fig. 5c for overlay with Fourier-filtered ERISM map). At the
periphery of the cell, there were multiple clearly distinguishable push/pull features (i.e.
twisting; marked by pairs of blue/red arrows in the magnified inset to Fig. 5c). This twisting is
consistent with earlier observations of torque being applied by focal adhesions26. Areas of
high vinculin expression were located at the centre of these features, confirming that they
are associated with focal adhesions transferring traction forces horizontally to the substrate.
Focal adhesion complexes had sizes of (6.1±3.4) µm2 and transmitted horizontal forces and
stresses of (3.1±1.0) nN and (602±323) Pa, respectively, to the substrate (n = 19 focal
adhesions). These values are not significantly different from reference measurements we
performed using conventional TFM on stiffness-matched polyacrylamide gels (horizontal
stress at focal adhesion, (386±131) Pa; n = 6 cells; p = 0.11, Mann-Whitney U-test). They are
also consistent with earlier micro-pillar array measurements of Bovine pulmonary artery
smooth muscle cells (≈20 nN horizontal force for 4 µm2-sized adhesion complexes on an array
with fivefold larger effective stiffness)29 and with TFM measurements of mouse embryonic
fibroblasts (≈500 Pa horizontal stress on a hydrogel substrate with a shear modulus of
≈2.4 kPa)26.
Long-term imaging of mechanical activity: cell cycle, migration from tissue explants
and in situ differentiation
We then applied ERISM to monitor cell behaviour with high temporal resolution and over
extended periods of time. Time-lapse data of slowly migrating 3T3 fibroblasts with a frame
taken every 2 s revealed fast force oscillations (oscillation period, 11.3 s; Supplementary
Video 5 and Supplementary Fig. 4a-b), which is consistent with earlier observations5.
Supplementary Video 6 shows a 5.5 day time-lapse video of migrating 3T3 fibroblasts
(5 minutes per frame, over 1,600 frames total) and traces five cycles of cell division without
any signs of phototoxicity or micro-cavity degradation, thus enabling the analysis of
mechanical activity during and between mitotic events. During mitosis, cells rounded up
9
observations21. Afterwards cells quickly reattached and began to apply forces to the
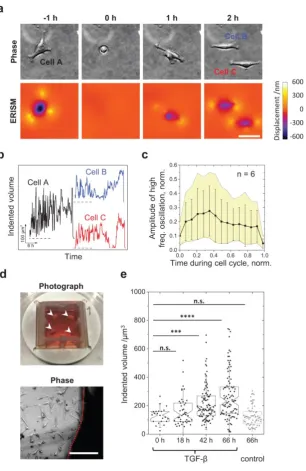
substrate. Taking the total volume by which each cell indents into the substrate as a proxy for
the applied force, we observed pronounced force fluctuations (period of oscillation,
(21.5±5.0) min; Fig. 6b). The amplitude of these fluctuations increased quickly after each cell
division, before going through a maximum followed by a slow decay in force as the cells
approached mitosis again (Fig. 6c).
Next, we applied ERISM to primary mouse fibroblasts. The robustness of the ERISM
micro-cavity allowed for tissue explants to be incubated directly on the cavity for several days
until cells had migrated out and onto the micro-cavity substrate (Fig. 6d). We then recorded
the mechanical activity of fibroblasts in close proximity to the tissue explant (Supplementary
Videos 7 and 8, Supplementary Fig. 4c-e). Afterwards we stimulated the fibroblasts with
TGF-β to initiate their differentiation into myofibroblasts10. Myofibroblasts express large amounts
of -smooth muscle actin (-SMA) and play a critical role in wound healing; they accumulate
in the wound’s granulation tissue and contribute to wound closure by applying large
contractile forces10. Over the 66 h time course of our differentiation experiment, the mean
force of cells stimulated with TGF-β increased by about twofold, whereas no change was
observed for the control group (Figure 6e; see Supplementary Fig. 4f-g for ERISM map and
-SMA immunostaining).
Discussion
The above examples illustrate how ERISM can be used to record mechanical cell substrate
interaction in a fast, robust and sensitive manner. The micro-cavity substrates used for ERISM
show excellent long-term stability, which renders ERISM particularly well suited for measuring
cellular forces over prolonged periods of time as demonstrated by a 5.5 day continuous
time-lapse consisting of over 1,600 frames. The extraction of cells from primary tissue directly on
a micro-cavity facilitated investigation of primary cells without transferring them between
substrates. Importantly, no zero-force reference image is required to analyse ERISM data,
which eliminates the need to detach non-migrating cells after a measurement. This makes
them available for subsequent studies (e.g. by immunostaining) and drastically simplifies
investigation of large numbers of cells on a common substrate and at multiple time-points.
10
differentiation of fibroblasts into myofibroblasts and found a twofold increase in cellular
force, in line with earlier TFM measurements on a sample of much smaller size44.
Microscopy methods that require high light intensities can be problematic in terms of
cellular photo-damage, in particular if repeated measurements are required during long-term
investigations. The intensity needed to acquire ERISM maps is ≈100 µW cm-2 – much lower
than the intensities required for fluorescence-based methods such as TFM. Furthermore,
ERISM time-lapse data is free from drift-artefacts because the interference effect occurs
within the substrate and does not require an external reference mirror.
The extreme stress sensitivity, large field of view, high dynamic range, and the
time-lapse capability provide unique possibilities for observing podosome protrusions during cell
migration – the process during which podosome activity is believed to be most crucial. In
addition, ERISM revealed that the migration of Dictyostelium discoideum under confined
conditions differs fundamentally from the situation on flat substrates, for which earlier TFM
studies found large in-plane stresses exerted by stationary traction adhesions27,39,45,46. Like
many other cell types, Dictyostelium discoideum is capable of adapting its mode of locomotion
to its environment18,40,47–49. Our data suggest that in a spatially confined environment they
project themselves forward in horizontal direction by applying weak vertical forces, a
mechanism previously described as “chimneying”18,38,41. A recent investigation on
non-adherent Walker 256 carcinosarcoma cells found that friction stresses play a pivotal role for
migration through micro-channels17. While these friction stresses were too small to be
resolved with TFM, they were estimated to be comparable to the stresses we measured with
ERISM for Dictyostelium discoideum, indicating that ERISM may be well suited to study cell
migration in micro-channels and other confined environments.
In summary, ERISM is a fast, robust and sensitive method for recording mechanical
cell-substrate interactions that is based on local interference in an elastic optical micro-cavity. It
can be used to measure vertical forces <1 pN with a spatial resolution < 2 µm and also readily
detects lateral forces with < 300 pN sensitivity. We validated ERISM by AFM, using indentation
and horizontal pulling measurements, and applied it to a wide range of biological systems.
ERISM can be easily combined with other microscopy modalities, such as bright-field, phase
contrast or fluorescence microscopy. Its field of view can be readily adjusted by changing the
microscope objective. The optics needed for ERISM can be easily integrated into a standard
11
versus abnormal mechanical behaviour of cells quickly, together with the option to
investigate multiple cells within a large field of view in real time by simply counting
interference fringes, will render ERISM a very powerful tool for diagnostic applications.
Acknowledgments
The authors thank K. Venkatesan Iyer and Paul A. Reynolds for fruitful discussion, Rajesh
Shahapure for TFM reference measurements, Anna L. Sobiech for illustrations and the
DictyoBase for provision of AX3 strain Dictyostelium discoideum. This project has received
funding from the Human Frontiers Science Program (RGY0074/2013), the Scottish Funding
Council (via SUPA), the European Research Council (ERC) under the European Union’s Horizon
2020 research and innovation programme (grant agreement No 640012), the EPSRC DTP
(EP/L505079/1), the RS MacDonald Charitable Trust and the MRC (G1100116).
Author Contributions
N.M.K., P.L. and M.C.G. developed ERISM. N.M.K. fabricated and characterized the
micro-cavity substrates and conducted measurements. P.L. developed the data analysis, stress map
calculation and graphical data presentation. A.S. contributed to protein coating, staining and
cell culture. J.A.K. designed and prepared the primary mouse fibroblast experiment. J.G.B.
prepared and assisted in the T cell experiment. G.S. and K.F. performed rheometry and TFM,
and contributed to AFM and general discussion. S.J.P. proposed and prepared the
macrophage experiment. M.C.G. supervised the project. N.M.K. and M.C.G wrote the
manuscript with input from all authors.
References
1. Geiger, B., Spatz, J. P. & Bershadsky, A. D. Environmental sensing through focal adhesions. Nat. Rev. Mol. Cell Biol. 10, 21–33 (2009).
2. Koser, D. E. et al. Mechanosensing is critical for axon growth in the developing brain.
Nat. Neurosci. 19, 1592–1598 (2016).
3. Kshitiz et al. Control of stem cell fate and function by engineering physical microenvironments. Integr. Biol. 4, 1008–1018 (2012).
4. Lo, C. M., Wang, H. B., Dembo, M. & Wang, Y. L. Cell movement is guided by the rigidity of the substrate. Biophys. J. 79, 144–152 (2000).
12
within focal adhesions mediate ECM-rigidity sensing to guide directed cell migration.
Cell 151, 1513–1527 (2012).
6. Paszek, M. J. et al. Tensional homeostasis and the malignant phenotype. Cancer Cell
8, 241–254 (2005).
7. Jannat, R. A., Robbins, G. P., Ricart, B. G., Dembo, M. & Hammer, D. A. Neutrophil adhesion and chemotaxis depend on substrate mechanics. J. Phys. Condens. Matter
22, 194117 (2010).
8. Ricart, B. G., Yang, M. T., Hunter, C. A., Chen, C. S. & Hammer, D. A. Measuring traction forces of motile dendritic cells on micropost arrays. Biophys. J. 101, 2620– 2628 (2011).
9. Betz, T., Koch, D., Lu, Y.-B., Franze, K. & Käs, J. A. Growth cones as soft and weak force generators. Proc. Natl. Acad. Sci. U. S. A. 108, 13420–13425 (2011).
10. Tomasek, J. J., Gabbiani, G., Hinz, B., Chaponnier, C. & Brown, R. A. Myofibroblasts and mechano-regulation of connective tissue remodelling. Nat. Rev. Mol. Cell Biol. 3, 349–363 (2002).
11. Mertz, A. F. et al. Scaling of traction forces with the size of cohesive cell colonies.
Phys. Rev. Lett. 108, 198101 (2012).
12. Lemmon, C. A., Chen, C. S. & Romer, L. H. Cell traction forces direct fibronectin matrix assembly. Biophys. J. 96, 729–738 (2009).
13. Brugués, A. et al. Forces driving epithelial wound healing. Nat. Phys. 10, 683–690 (2014).
14. Tambe, D. T. et al. Collective cell guidance by cooperative intercellular forces. Nat. Mater. 10, 469–475 (2011).
15. Case, L. B. & Waterman, C. M. Integration of actin dynamics and cell adhesion by a three-dimensional, mechanosensitive molecular clutch. Nat. Cell Biol. 17, 955–963 (2015).
16. Labernadie, A. et al. Protrusion force microscopy reveals oscillatory force generation and mechanosensing activity of human macrophage podosomes. Nat. Commun. 5, 5343 (2014).
17. Bergert, M. et al. Force transmission during adhesion-independent migration. Nat. Cell Biol. 17, 524–529 (2015).
18. Liu, Y. J. et al. Confinement and low adhesion induce fast amoeboid migration of slow mesenchymal cells. Cell 160, 659–672 (2015).
19. Toyjanova, J., Flores-Cortez, E., Reichner, J. S. & Franck, C. Matrix confinement plays a pivotal role in regulating neutrophil-generated tractions, speed, and integrin
utilization. J. Biol. Chem. 290, 3752–3763 (2015).
20. Harris, A. K., Wild, P. & Stopak, D. Silicone rubber substrata: A new wrinkle in the study of cell locomotion. Science 208, 177–179 (1980).
21. Burton, K. & Taylor, D. L. Traction forces of cytokinesis measured with optically modified elastic substrata. Nature 385, 450–454 (1997).
22. Dembo, M. & Wang, Y. L. Stresses at the cell-to-substrate interface during locomotion of fibroblasts. Biophys. J. 76, 2307–2316 (1999).
23. Schwarz, U. S. et al. Calculation of forces at focal adhesions from elastic substrate data: the effect of localized force and the need for regularization. Biophys. J. 83, 1380–1394 (2002).
13
207–220 (2008).
25. Hur, S. S., Zhao, Y., Li, Y. S., Botvinick, E. & Chien, S. Live cells exert 3-dimensional traction forces on their substrata. Cell. Mol. Bioeng. 2, 425–436 (2009).
26. Legant, W. R. et al. Multidimensional traction force microscopy reveals out-of-plane rotational moments about focal adhesions. Proc. Natl. Acad. Sci. U. S. A. 110, 881–886 (2013).
27. Álvarez-González, B. et al. Three-dimensional balance of cortical tension and axial contractility enables fast amoeboid migration. Biophys. J. 108, 821–832 (2015). 28. Colin-York, H. et al. Super-resolved traction force microscopy (STFM). Nano Lett. 16,
2633−2638 (2016).
29. Tan, J. L. et al. Cells lying on a bed of microneedles: an approach to isolate mechanical force. Proc. Natl. Acad. Sci. U. S. A. 100, 1484–1489 (2003).
30. Wolfenson, H. et al. Tropomyosin controls sarcomere-like contractions for rigidity sensing and suppressing growth on soft matrices. Nat. Cell Biol. Biol. 18, 33–42 (2015).
31. Polacheck, W. J. & Chen, C. S. Measuring cell-generated forces: a guide to the available tools. Nat. Methods 13, 415–423 (2016).
32. Polio, S. R., Rothenberg, K. E., Stamenovic, D. & Smith, M. L. A micropatterning and image processing approach to simplify measurement of cellular traction forces. Acta Biomater. 8, 82–88 (2012).
33. Bergert, M. et al. Confocal reference free traction force microscopy. Nat. Commun. 7, 12814 (2016).
34. Balaban, N. Q. et al. Force and focal adhesion assembly: a close relationship studied using elastic micropatterned substrates. Nat. Cell Biol. 3, 466–472 (2001).
35. Dimitriadis, E. K., Horkay, F., Maresca, J., Kachar, B. & Chadwick, R. S. Determination of elastic moduli of thin layers of soft material using the atomic force microscope.
Biophys. J. 82, 2798–810 (2002).
36. Levental, I., Georges, P. C. & Janmey, P. A. Soft biological materials and their impact on cell function. Soft Matter 2, 1–9 (2007).
37. Calle, Y., Burns, S., Thrasher, A. J. & Jones, G. E. The leukocyte podosome. Eur. J. Cell Biol. 85, 151–157 (2006).
38. Charras, G. & Paluch, E. Blebs lead the way: how to migrate without lamellipodia. Nat. Rev. Mol. Cell Biol. 9, 730–736 (2008).
39. Bastounis, E. et al. Both contractile axial and lateral traction force dynamics drive amoeboid cell motility. J. Cell Biol. 204, 1045–1061 (2014).
40. Lämmermann, T. et al. Rapid leukocyte migration by integrinindependent flowing and squeezing. Nature 453, 51–55 (2008).
41. Malawista, S. E. & de Boisfleury Chevance, A. Random locomotion and chemotaxis of human blood polymorphonuclear leukocytes (PMN) in the presence of EDTA: PMN in close quarters require neither leukocyte integrins nor external divalent cations. Proc. Natl. Acad. Sci. U. S. A. 94, 11577–11582 (1997).
42. Friedl, P. & Weigelin, B. Interstitial leukocyte migration and immune function. Nat. Immunol. 9, 960–969 (2008).
43. Kinashi, T. Intracellular signalling controlling integrin activation in lymphocytes. Nat. Rev. Immunol. 5, 546–559 (2005).
14
45. Delanoe-Ayari, H., Rieu, J. P. & Sano, M. 4D traction force microscopy reveals asymmetric cortical forces in migrating dictyostelium cells. Phys. Rev. Lett. 105, 248103 (2010).
46. Alamo, J. C. del et al. Three-dimensional quantification of cellular traction forces and mechanosensing of thin substrata by fourier traction force microscopy. PLoS One 8, e69850 (2013).
47. Renkawitz, J. et al. Adaptive force transmission in amoeboid cell migration. Nat. Cell Biol. 11, 1438–1443 (2009).
48. Petrie, R. J., Gavara, N., Chadwick, R. S. & Yamada, K. M. Nonpolarized signaling reveals two distinct modes of 3D cell migration. J. Cell Biol. 197, 439–455 (2012). 49. Yoshida, K. & Soldati, T. Dissection of amoeboid movement into two mechanically
15
16
17
18
19
Figure 4 | ERISM for investigation of amoeboid migration in confined space and protein-specific cell-substrate interaction. (a) Illustration of 5 µm void formed on top of a 5 µm thick micro-cavity substrate by using 10 µm-diameter glass beads and a glass coverslip. (b) Temporal evolution of substrate deformation generated by a Dictyostelium discoideum amoeba migrating through the void. The boundary of the cell is indicated in black. The
20
21
22
TGF-23