Effects of Image Reconstruction on Fibre Orientation Mapping
from Multi-channel Diffusion MRI: Reducing the Noise Floor
Using SENSE
S. N. Sotiropoulos1,*, S. Moeller2, S. Jbabdi1, J. Xu2, J. L. Andersson1, E. J. Auerbach2, E. Yacoub2, D. Feinberg3,4, K. Setsompop5, L.L. Wald5, T.E.J. Behrens1,6, K. Ugurbil2, and C. Lenglet2
1Centre for Functional Magnetic Resonance Imaging of the Brain, University of Oxford, Oxford,
UK
2Center for Magnetic Resonance Research, University of Minnesota, Minneapolis, MN, USA
3Advanced MRI Technologies, Sebastopol, CA, USA
4Helen Wills Institute for Neuroscience, University of California, Berkeley, CA, USA
5Department of Radiology, Massachusetts General Hospital, Charlestown, MA, USA
6Wellcome Trust Centre for NeuroImaging, University College London, London, UK
Abstract
Purpose—To examine the effects of the reconstruction algorithm of magnitude images from multi-channel diffusion MRI on fibre orientation estimation.
Theory and Methods—It is well established that the method used to combine signals from different coil elements in multi-channel MRI can have an impact on the properties of the reconstructed magnitude image. Utilising a root-sum-of-squares (RSoS) approach results in a magnitude signal that follows an effective non-central-χ distribution. As a result, the noise floor, the minimum measurable in the absence of any true signal, is elevated. This is particularly relevant for diffusion-weighted MRI, where the signal attenuation is of interest.
Results—In this study, we illustrate problems that such image reconstruction characteristics may cause in the estimation of fibre orientations, both for model-based and model-free approaches, when modern 32-channel coils are employed. We further propose an alternative image reconstruction method that is based on sensitivity encoding (SENSE) and preserves the Rician nature of the single-channel, magnitude MR signal. We show that for the same k-space data, RSoS can cause excessive overfitting and reduced precision in orientation estimation compared to the SENSE-based approach.
Conclusion—These results highlight the importance of choosing the appropriate image reconstruction method for tractography studies that use multi-channel receiver coils for diffusion MRI acquisition.
Keywords
Sum of Squares; SENSE; Rician; Non-central-χ; Magnitude Image; Tractography
NIH Public Access
Author Manuscript
Magn Reson Med
. Author manuscript; available in PMC 2014 December 01.Published in final edited form as:
Magn Reson Med. 2013 December ; 70(6): . doi:10.1002/mrm.24623.
NIH-PA Author Manuscript
NIH-PA Author Manuscript
INTRODUCTION
Noise in the real and imaginary MRI signal is commonly assumed to be zero-mean, Gaussian, uncorrelated and with equal variance for the two signals [1, 2]. Therefore, intensity y in magnitude MR images follows a Rician distribution Pr when single-channel
receiver coils are employed [1]:
[1]
where S denotes the signal intensity in the absence of noise, σ the noise standard deviation of the real/imaginary part, and I0 the modified 0th order Bessel function of the first kind.
In the case of multi-channel receiver coils, signal properties can change dramatically, depending on the image reconstruction method that is used to combine information from the different channels [3]. In the seminal paper on imaging with phased-arrays [4], Roemer et al showed that when coil profiles are unknown, a root-sum-of-squares (RSoS) combination is asymptotically SNR optimal (see also [5]). However, for an RSoS reconstruction, the noise follows a non-central-χ distribution [6, 7] Pχ, whose degrees of freedom depend on the number n of channels:
[2]
The non-central-χ reduces to a Rician distribution for n=1 and deviates more from it as n increases. The above distribution assumes that the signals obtained from the different channels are independent. If correlations between channels exist, noise characterisation becomes more complicated [8]. Stationary correlations, for instance, exist due to electronic coupling between channels, which is inherent for high density, phased-array coils. Non-stationary correlations are introduced when using multiband (MB) echo planar imaging (EPI) for accelerated acquisitions [9–12] or when using Generalized Auto-calibration Partially Parallel Acquisition (GRAPPA) to correct for under-sampled acquisitions in k-space. As shown in [13], when RSoS reconstruction is performed with GRAPPA, the noise follows an effective non-central-χ distribution with fewer degrees of freedom and larger variance than the ones predicted for independent channels.
For all these reasons, it has become far from obvious to parametrically describe the noise in modern, multi-channel MRI. Even if such a characterization is plausible though, changes in the noise properties can influence the noise floor, the minimum measurable signal in the absence of any true signal [14]. For instance, in the case of RSoS, the noise floor is elevated as the number n of channels increase. This is particularly problematic for diffusion-weighted (DW) MRI, as any further elevation of the (inherently unavoidable) noise floor limits the ability to properly quantify the true signal attenuation [14, 15]. As a result, the spatial resolution and maximum diffusion weighting (b-value) that one can reliably use are ultimately limited, because of indistinguishable and rectified diffusion-weighted signals.
In this note, we explore the impact of image reconstruction methods on the estimation of fibre orientations. We utilise, as an alternative to RSoS, a sensitivity-encoding (SENSE) image reconstruction [16] for multichannel MRI data, aimed particularly for (inherently low SNR) diffusion-weighted data; we refer to it as SENSE1. The SENSE reconstruction, originally introduced in [16], uses the coil sensitivity profiles to recover images from data acquired with missing phase-encoding lines, i.e. with an undersampling factor R greater than 1 (where R is the ratio of the desired space phase-encoding lines over the number of
k-NIH-PA Author Manuscript
NIH-PA Author Manuscript
space lines actually acquired). In SENSE1 (i.e. R=1), complex images without undersampling that have been obtained from each channel are combined into a single complex image. A magnitude image is subsequently computed, which is therefore expected to exhibit Rician noise properties. We compare the performance of the RSoS and SENSE1 reconstruction methods for the purpose of fibre orientation mapping at various b-values. We estimate fibre orientations through model-free [17] and model-based [18] approaches on the same k-space data, reconstructed to magnitude images in both ways. We illustrate the artifacts caused by the RSoS elevated noise floor and demonstrate the advantages of the SENSE1 approach. Preliminary results of this study have been presented before in abstract form [19, 20].
METHODS
For the RSoS reconstruction, magnitude images are obtained as:
[3]
where Ik is the complex-valued image from channel k and n the number of channels.
SENSE1 reconstruction utilizes the coil sensitivity profiles to linearly combine the complex-valued images Ik obtained from the different channels. The magnitude image is obtained as
[4]
where is the complex conjugate coil sensitivity profile of channel k. Due to the absence of a homogeneous body-coil, the determination of the absolute sensitivity profiles is not feasible at high field strength (≥3T). Instead, relative sensitivity profiles can be estimated after low-pass filtering the ratio Ik/yRSOS, as proposed in [16]. We followed this approach
and estimated sensitivity profiles from a reference acquisition without any diffusion-weighting or multiband acceleration. To obtain smooth profiles, channel independent phase-variations were estimated as θ(Σ Ik), where θ is the phase, and removed from each channel.
A Gaussian filter with a FWHM of 4 pixels was applied to the magnitude of Ck. For the
phase, the filter was applied to the real and imaginary components of Ck respectively (after
removing θ(ΣIk)), and then combined to get a smooth phase image.
Diffusion-weighted images were acquired from a healthy subject on the 3T Connectome Skyra scanner (Siemens, Erlangen), retrofit with an SC72C gradient set capable of up to 100 mT/m for diffusion encoding [21]. The subject provided informed written consent prior to participating in the study, which was approved by the Institutional Review Board of the University of Minnesota. Whole brain DW images were acquired with a 32 channel head coil (Siemens) using a multiband echo-planar imaging (EPI) sequence with simultaneous multi-slice excitation [9, 10, 12], and a Stejskal-Tanner (i.e. monopolar) diffusion-weighting scheme [22]. Imaging parameters were: 1.5 × 1.5 × 1.5 mm3 voxels (78 slices), TR/TE: 3200/77ms and slice acceleration MB=31 (with a slice shift of 1/3 FOVPE [11, 12].
Slice-unaliasing was performed with the slice-GRAPPA algorithm [12] using a 3×3 kernel). Fifteen b=0 s/mm2 and 128 DW volumes were acquired for each of the b=1000, 2000 and
3000 s/mm2 values, with a left-right phase encoding direction. A noise-only “single-slice”
1We should point out that all findings in this study were independent of whether MB acceleration was employed.
NIH-PA Author Manuscript
NIH-PA Author Manuscript
acquisition was acquired initially with matched bandwidth. Using the pseudo-replica methods [23], the g-factor was estimated as 1.14±0.2, consistent with previous results [12].
From the noise-only acquisition, a n × n channel-decorrelation matrix was determined using a singular value decomposition of the noise-correlation matrix [23]. The
channel-decorrelation was applied to all data for the whole series. Then, the same k-space data were reconstructed using either RSoS or SENSE1, giving two separate magnitude datasets for each acquisition (the decorrelation operation did not affect the SENSE1 reconstruction, but improved the SNR for the RSoS case and is consistent with the current vendor
implementation on the Skyra platform). The magnitude diffusion-weighted images were then corrected for eddy current distortions using an affine transformation, as implemented in FSL [24].
Fibre orientations were estimated separately for each reconstruction of each dataset using a model-based and a model-free approach; the ball and stick model [18] and the constant solid angle orientation distribution functions (CSA ODFs) [17], respectively. The ball and stick is a multi-compartment model that was fitted within a Bayesian inference framework and a Rician noise model assumption, using the FDT toolbox in FMRIB’s Software Library (FSL) [24]. The CSA ODFs and their uncertainty were estimated using a spherical harmonic decomposition and residual bootstrapping, as implemented in the QBOOT toolbox [25] in FSL. For each of these fibre orientation estimation methods, we examined differences induced solely by the image reconstruction method (SENSE1 vs RSoS).
RESULTS
In this section, we illustrate the difference in the noise properties between RSoS and SENSE1 reconstructions. We also show how the elevated RSoS noise floor causes problems in fibre orientation estimation for both model-based and model-free approaches and how these issues are alleviated using SENSE1 reconstruction.
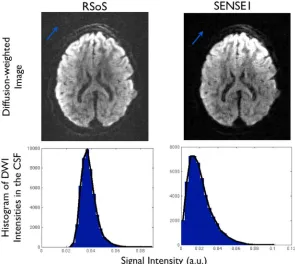
Figure 1 illustrates differences in the raw magnitude data between the two reconstructions. It shows a clear elevation of the signal intensity outside the brain using RSoS and how this is reduced using SENSE1. For a more representative illustration of the noise features within the brain, the histograms represent the distribution of the diffusion-weighted signal at a high b value from a region of interest (ROI) in the CSF. The CSF signal is maximally attenuated and is expected to reach the noise floor. As shown, the signal obtained from a SENSE1 reconstruction exhibits a Rician distribution, while the distribution for RSoS is non-central-χ
(observe how far away from zero the distribution is, reflecting more than one degrees of freedom).
Figure 2 shows how the RSoS DW signal becomes rectified in a voxel at the midbody of the corpus callosum, particularly for high b values. The signal datapoints are sorted according to the angle difference of the direction of the respective diffusion-sensitizing gradient with the DTI principal eigenvector; the latter representing the principle callosal fibre orientation. So, measurements along the principle fibre orientation (maximum signal attenuation) appear first and measurements perpendicular to the main fibre orientation (minimum signal attenuation) appear last. It is clear that along the fibre orientation of such an anisotropic region, signal is “squashed”, particularly for RSoS compared to SENSE1. This “squashing” effect has been identified before and is unavoidable for low signal to noise ratio (SNR) measurements [14], but we show here how important the choice of the reconstruction method is. SENSE1 increases the dynamic range of the signal by almost 60% for the highest b value compared to RSoS.
NIH-PA Author Manuscript
NIH-PA Author Manuscript
Model-based Orientation Estimation
When the model-based approach is applied to RSoS reconstructed data excessive overfitting is observed. Figure 3 illustrates coronal and axial views with the estimated fibre orientations using the ball and stick model on both RSoS and SENSE1 data. The number of fibres supported by the data has been selected using the automatic relevance determination approach (ARD) [18]. We can observe that the model estimates many 3-way orthogonal crossings in the midbody of the corpus callosum, the cingulum and the fornix for the RSoS data. These are almost eliminated in the SENSE1 reconstruction. As shown in Table 1, the proportion of voxels in the midbody of the corpus callosum that exhibited overfitting artifacts for the higher b values was in the order of 70–80% for RSoS. The overfittting was assessed within an ROI, as the percentage of voxels where two extra fibres, roughly perpendicular (>80°) to the predominant callosal orientation, were estimated. We observe that in general the artifacts increase with b value, as the SNR is reduced. On the other hand, for the SENSE1 reconstruction the respective numbers were less than 0.5%, showing that the overfitting is effectively eliminated.
The artifacts are caused by the elevated RSoS noise floor (Figure 4), which is not accounted for in the model. A single predominant orientation is expected to be estimated at the midbody of the corpus callosum. The predicted signal from a single-fibre model fit is shown in the figure, superimposed on the reconstructed data. Such a model explains well the SENSE1 data. However, it fails to represent the RSoS data and particularly the
measurements along the major fibre orientation (i.e. the ones that cause the maximum signal attenuation). The model predicts a much higher attenuation than the data, which have been rectified by the elevated noise floor. On the contrary, a model with three fibres explains the RSoS data better. The extra fibres, which have small volume fractions and orientations perpendicular to the predominant one, reduce the predicted attenuation and match the squashed signal.
We should point out that SENSE1 does not decrease sensitivity in identifying true crossings (Figure 3). In areas where crossing fibres are expected (such as the centrum semiovale), the model still predicts multiple orientations. It is the overfitting in very anisotropic, single-fibre regions that is reduced.
Model-free Orientation Estimation
To examine whether image reconstruction influences only model-based fibre mapping approaches, we estimated fibre orientations through diffusion CSA ODFs [17]. These are functions on the sphere that indicate how likely diffusion along a certain orientation is. Figure 5 shows ODF glyphs obtained from the SENSE1 and RSoS data. The RSoS ODFs appear to be squashed along their largest peak, compared to the respective SENSE1. This is particularly evident for the most anisotropic regions, within the corpus callosum. The maximum ODF magnitude is reduced on average by 5%, 12% and 20% for b=1000, 2000 and 3000 s/mm2 respectively, when RSoS reconstruction is employed compared to SENSE1. For less coherent regions, where the signal attenuation is smaller (e.g. centrum semiovale), the squashing is much smaller. However, it becomes more evident for a b value of 3000 s/mm2.
As a result of the ODF squashing, the probability of the predominant fibre orientation (ODF peak) decreases. This can potentially increase the orientation uncertainty estimated from such a method. Table 1 shows the 95% cones of ODF orientation uncertainty [26] across the body of the corpus callosum, for different b values. Similar to the overfitting issues for the model-based method, RSoS artifacts (in the form of increased uncertainty) become worse for higher b values. Notice that for high b values, RSoS causes on average a 15% increase in
NIH-PA Author Manuscript
NIH-PA Author Manuscript
orientation uncertainty within the corpus callosum, compared to SENSE1. Given that probabilistic tractography approaches propagate local uncertainty spatially, such differences -driven by the image reconstruction alone- are expected to cause deviations in the estimated tracts.
Apart from the ODF squashing, RSoS reconstruction causes within the corpus callosum a 10–15% increase in the magnitude of the non-anatomically relevant ODF peaks, that appear perpendicular to the predominant orientation. This can also artificially increase the number of predicted fibres (similar to the overfitting observed for the model-based approach) in RSoS compared to SENSE1. A common way to detect fibre orientations is to use thresholds on the magnitude of the ODF local maxima; the squashing of the major peak, along with the magnitude increase of the perpendicular ones can significantly affect this process.
DISCUSSION AND CONCLUSIONS
We have illustrated the impact that the choice of image reconstruction can have on multi-channel diffusion-weighted MRI data. We identified artifacts, particularly in the fibre orientation estimation, that the simple root-sum-of-squares reconstruction (RSoS) can cause. RSoS changes the noise properties to non-Rician [6] and elevates the noise floor, the minimum measureable signal in the absence of any true signal. These cause overfitting problems in model-based fibre mapping approaches and reduced precision, as well as, potential overestimation of the number of crossing compartments for model-free ODF-based methods. The artifacts are mostly evident in white matter regions of high anisotropy and for measurements along the dominant fibre orientation. The signal attenuation is then maximal and the signal is rectified by the elevated noise floor. These findings suggest that white matter tractography results may become dependent on the image reconstruction method. Therefore, care should be taken when performing brain connectivity analysis.
We have also proposed an image reconstruction method, based on sensitivity-encoding, that retains the Rician noise properties, expected for single-channel receiver coils. The SENSE1 reconstruction combines the aliasing-free complex images from individual channels optimally into a simple complex image, whose magnitude is then obtained. Fibre mapping approaches exhibit a better performance with data reconstructed using SENSE1 compared to RSoS. In our experiments, SENSE1 increased the dynamic range of the signal by 50–70%, allowing therefore higher b values and/or spatial resolutions to be achieved, before the MR signal in anisotropic WM regions became squashed by the noise floor [14].
The deviation of the RSoS signal from a Rician distribution increases with the number of channels n used in the receiver coil; these define the number of degrees of freedom of the non-central-χ distributed signal, which are n − 1 for uncorrelated channels. For more realistic situations, where the signals obtained from different channels are correlated, the degrees of freedom are much less than n − 1 [13]. Therefore, we expect the identified RSoS artifacts to be less evident for the older 8-channel coils, but more severe for the modern 32-channel coils.
Furthermore, artifacts induced by image reconstruction will be more severe for low-SNR acquisitions, caused either by high b values or high spatial resolution. Figure 2 and Table 1 clearly show this trend and how deviation between RSoS and SENSE1 performance increases with b value. For lower spatial resolutions, reconstruction-induced differences of the same order are expected to be observed at higher b values and vice-versa.
We should point out that the overfitting artifacts in the model-based approach could be alleviated to an extent by considering the correct noise distribution. In fact, we have shown that they are less severe when a noise floor compartment is included into the model [19, 27],
NIH-PA Author Manuscript
NIH-PA Author Manuscript
since a non-central Gaussian/Rician approximates well a non-central- χ distribution with many degrees of freedom. However, as explained in the introduction, the characterisation of the noise distribution is far from obvious with modern acquisition protocols. Furthermore, even a proper noise model cannot remedy the dynamic range loss caused by RSoS (Figure 2), making signals at relatively high b values and spatial resolutions indistinguishable.
Similar to the SENSE1 reconstruction presented here, a few other methods have been proposed to combine multiple channels in a way that preserves the Rician features of the magnitude image. Amongst them, the adaptive reconstruction (AR) [28], also known as the spatial matched filter approach also alleviates the RSoS artifacts in fibre orientation estimation to a certain extent, as we have briefly shown in [19]. The AR combines linearly complex data from multiple receivers to get a single complex image before the final
magnitude calculation. However, the AR estimates signal optimal combination on a volume-by-volume basis, and is not compatible with unknown non-stationary alterations to the noise properties. In addition, a temporally varying sensitivity profile is estimated, which is not appropriate for low SNR signals, nor when noise-properties in multiple volumes are used for analysis, as in DW-MRI. Indeed, the primary motivation in AR is to suppress artifact or noise for clinical reading instead of retaining signal fidelity for quantification. Therefore, we did not include it as part of the comparisons performed in this study.
We should also note that the SENSE1 reconstruction is similar to the optimum complex weighted coil combination proposed in Roemer’s original work [4], but here it is further combined with the slice-GRAPPA algorithm. Furthermore, although it is hard to know what manufacturers exactly do, a similar to SENSE1 implementation seems to be available by one of the main vendors (Philips). For the Connectome system, however, the Siemens supported options were RSOS and adaptive coil-combination, neither of which has the right properties or stability respectively.
Regarding parallel imaging approaches and how they are affected by image reconstruction, magnitude images obtained from GRAPPA and RSoS reconstruction are expected to follow a non-central-chi distribution [3, 13] and therefore exhibit similar issues in fibre orientation estimation, as the ones illustrated in this study. On the other hand, GRAPPA combined with a SENSE1 reconstruction or SENSE with R>1 are expected to induce signals that have an effective Rician distribution.
In summary, we have illustrated problems that may arise from the image reconstruction method, in diffusion MRI with multi-channel receiver coil. Fibre orientation estimation, using either model-based or model-free approaches, can be substantially compromised. The commonly-used RSoS reconstruction can cause reduced accuracy and precision in the orientation estimation compared to the proposed SENSE1 approach. These findings highlight the importance of choosing the appropriate image reconstruction method for tractography studies that use data obtained from multi-channel receiver coils.
Acknowledgments
This study was supported in part by the Human Connectome Project (U54MH091657 and U01MH093765) from the 16 NIH Institutes and Centers that Support the NIH Blueprint for Neuroscience Research, and by NIH grants P41 RR008079 (NCRR), P41 EB015894 (NIBIB), P30 NS057091, and P30 NS5076408.
References
1. Gudbjartsson H, Patz S. The Rician distribution of noisy MRI data. Magnetic Resonance in Medicine. 1995; 34(6):910–4. [PubMed: 8598820]
NIH-PA Author Manuscript
NIH-PA Author Manuscript
2. Henkelman RM. Measurement of signal intensities in the presence of noise in MR images. Medical Physics. 1985; 12(2):232–3. [PubMed: 4000083]
3. Dietrich O, Raya JG, Reeder SB, Ingrisch M, Reiser MF, Schoenberg SO. Influence of multichannel combination, parallel imaging and other reconstruction techniques on MRI noise characteristics. Magnetic Resonance Imaging. 2008; 26(6):754–62. [PubMed: 18440746]
4. Roemer PB, Edelstein WA, Hayes CE, Souza SP, Mueller OM. The NMR phased array. Magnetic Resonance in Medicine. 1990; 16(2):192–225. [PubMed: 2266841]
5. Larsson EG, Erdogmus D, Yan R, Principe JC, Fitzsimmons JR. SNR-optimality of sum-of-squares reconstruction for phased-array magnetic resonance imaging. J Magn Reson. 2003; 163(1):121–3. [PubMed: 12852915]
6. Constantinides CD, Atalar E, McVeigh ER. Signal-to-noise measurements in magnitude images from NMR phased arrays. Magnetic Resonance in Medicine. 1997; 38(5):852–7. [PubMed: 9358462]
7. Kellman P, McVeigh ER. Image reconstruction in SNR units: a general method for SNR measurement. Magnetic Resonance in Medicine. 2005; 54(6):1439–47. [PubMed: 16261576] 8. Hayes CE, Roemer PB. Noise correlations in data simultaneously acquired from multiple surface
coil arrays. Magnetic Resonance in Medicine. 1990; 16(2):181–91. [PubMed: 2266840]
9. Moeller S, Yacoub E, Olman CA, Auerbach E, Strupp J, Harel N, Ugurbil K. Multiband multislice GE-EPI at 7 tesla, with 16-fold acceleration using partial parallel imaging with application to high spatial and temporal whole-brain fMRI. Magnetic Resonance in Medicine. 2010; 63(5):1144–53. [PubMed: 20432285]
10. Feinberg DA, Moeller S, Smith SM, Auerbach E, Ramanna S, Gunther M, Glasser MF, Miller KL, Ugurbil K, Yacoub E. Multiplexed echo planar imaging for sub-second whole brain FMRI and fast diffusion imaging. PloS One. 2010; 5(12):e15710. [PubMed: 21187930]
11. Xu, J.; Moeller, S.; Strupp, J.; Auerbach, E.; Chen, L.; Feinberg, DA.; Ugurbil, K.; Yacoub, E. Highly Accelerated Whole Brain Imaging Using Aligned-Blipped-Controlled-aliasing Multiband EPI. Proceedings of the International Society for Magnetic Resonance in Medicine (ISMRM) Annual Meeting; 2012; Melbourne, Australia.
12. Setsompop K, Gagoski BA, Polimeni JR, Witzel T, Wedeen VJ, Wald LL. Blipped-controlled aliasing in parallel imaging for simultaneous multislice echo planar imaging with reduced g-factor penalty. Magnetic Resonance in Medicine. 2012; 67(5):1210–24. [PubMed: 21858868]
13. Aja-Fernandez S, Tristan-Vega A, Hoge WS. Statistical noise analysis in GRAPPA using a parametrized noncentral Chi approximation model. Magnetic Resonance in Medicine. 2011; 65(4): 1195–206. [PubMed: 21413083]
14. Jones DK, Basser PJ. “Squashing peanuts and smashing pumpkins”: how noise distorts diffusion-weighted MR data. Magnetic Resonance in Medicine. 2004; 52(5):979–93. [PubMed: 15508154] 15. Dietrich O, Heiland S, Sartor K. Noise correction for the exact determination of apparent diffusion
coefficients at low SNR. Magnetic Resonance in Medicine. 2001; 45(3):448–53. [PubMed: 11241703]
16. Pruessmann KP, Weiger M, Scheidegger MB, Boesiger P. SENSE: sensitivity encoding for fast MRI. Magnetic Resonance in Medicine. 1999; 42(5):952–62. [PubMed: 10542355]
17. Aganj I, Lenglet C, Sapiro G, Yacoub E, Ugurbil K, Harel N. Reconstruction of the orientation distribution function in single- and multiple-shell q-ball imaging within constant solid angle. Magnetic Resonance in Medicine. 2010; 64(2):554–66. [PubMed: 20535807]
18. Behrens TE, Berg HJ, Jbabdi S, Rushworth MF, Woolrich MW. Probabilistic diffusion
tractography with multiple fibre orientations: What can we gain? NeuroImage. 2007; 34(1):144– 55. [PubMed: 17070705]
19. Sotiropoulos, SN.; Behrens, T.; Andersson, J.; Yacoub, E.; Moeller, S.; Jbabdi, S. Influence of Image Reconstruction from Multichannel Diffusion MRI on Fibre Orientation Estimation. Proceedigns of the Organization for Human Brain Mapping (OHBM) Annual Meeting; 2011; Quebec, Canada.
20. Lenglet, C.; Sotiropoulos, SN.; Moeller, S.; Xu, J.; Auerbach, E.; Yacoub, E.; Feinberg, DA.; Setsompop, K.; Wald, LL.; Behrens, T.; Ugurbil, K. Multichannel Diffusion MR Image
Reconstruction: How to Reduce Elevated Noise Floor and Improve Fiber Orientation Estimation.
NIH-PA Author Manuscript
NIH-PA Author Manuscript
Proceedings of the International Society for Magnetic Resonance in Medicine (ISMRM) Annual Meeting; 2012; Melbourne, Australia.
21. Kimmlingen, R.; Eberlein, E.; Dietz, P.; Kreher, S.; Schuster, J.; Riegler, J.; Matschl, V.;
Schnetter, V.; Schmidt, A.; Lenz, H.; Mustafa, E.; Fischer, D.; Potthast, A.; Kreischer, L.; Eberler, M.; Hebrank, F.; Thein, H.; Heberlein, K.; Hoecht, P.; Witzel, T.; Tisdall, D.; Xu, J.; Yacoub, E.; Adriany, G.; Auerbach, E.; Moeller, S.; Feinberg, DA.; Lehne, D.; Wald, LL.; Rosen, B.; Ugurbil, K.; van Essen, D.; Wedeen, VJ.; Schmitt, F. Concept and realization of high strength gradients for the Human Connectome Project. Proceedings of the International Society for Magnetic Resonance in Medicine (ISMRM) Annual Meeting; 2012; Melbourne, Australia.
22. Stejskal EO, Tanner JE. Spin Diffusion Measurements: Spin Echoes in the Presence of a Time-Dependent Field Gradient. Journal of Chemical Physics. 1965; 42(1):288.
23. Robson PM, Grant AK, Madhuranthakam AJ, Lattanzi R, Sodickson DK, McKenzie CA. Comprehensive quantification of signal-to-noise ratio and g-factor for image-based and k-space-based parallel imaging reconstructions. Magn Reson Med. 2008; 60(4):895–907. [PubMed: 18816810]
24. Smith SM, Jenkinson M, Woolrich MW, Beckmann CF, Behrens TE, Johansen-Berg H, Bannister PR, De Luca M, Drobnjak I, Flitney DE, Niazy RK, Saunders J, Vickers J, Zhang Y, De Stefano N, Brady JM, Matthews PM. Advances in functional and structural MR image analysis and implementation as FSL. Neuroimage. 2004; 23(Suppl 1):S208–19. [PubMed: 15501092] 25. Sotiropoulos, SN.; Aganj, I.; Jbabdi, S.; Sapiro, G.; Lenglet, C.; Behrens, TEJ. Inference on
constant solid angle orientation distribution functions from diffusion-weighted mri. Proceedigns of the Organization for Human Brain Mapping (OHBM) Annual Meeting; 2011; Quebec, Canada. 26. Jones DK. Determining and visualizing uncertainty in estimates of fiber orientation from diffusion
tensor MRI. Magn Reson Med. 2003; 49(1):7–12. [PubMed: 12509814]
27. Jbabdi S, Sotiropoulos SN, Savio AM, Grana M, Behrens TE. Model-based analysis of multishell diffusion MR data for tractography: How to get over fitting problems. Magn Reson Med. 201210.1002/mrm.24204
28. Walsh DO, Gmitro AF, Marcellin MW. Adaptive reconstruction of phased array MR imagery. Magnetic Resonance in Medicine. 2000; 43(5):682–90. [PubMed: 10800033]
NIH-PA Author Manuscript
NIH-PA Author Manuscript
Figure 1.
Top: Raw magnitude diffusion-weighted images reconstructed using RSoS and SENSE1 from the same k-space data. Notice how the RSoS intensities are elevated at the background region (blue arrow). Bottom: Histograms of diffusion-weighted image intensities within the brain, extracted from the CSF-filled ventricles (b=2000 s/mm2). Notice the non-Rician
features of the RSoS signal. For each reconstruction, the signal was normalised by the mean intensity of the top 0.1% voxels, to account for the fact that RSoS and SENSE1 did not necessarily use the same scaling.
NIH-PA Author Manuscript
NIH-PA Author Manuscript
Figure 2.
Raw signal for different reconstructions at a voxel in the midbody of the corpus callosum (red: RSoS, blue:SENSE1) and for different b values. Datapoints are sorted according to the angular distance of the respective gradient direction and the principal fibre orientation of the voxel (i.e. measurements parallel to perpendicular to the major fibre orientation are
presented). For each reconstruction and b value, the signal was normalised by the mean intensity of the top 0.1% voxels, to account for the fact that RSoS and SENSE1 did not necessarily use the same scaling.
NIH-PA Author Manuscript
NIH-PA Author Manuscript
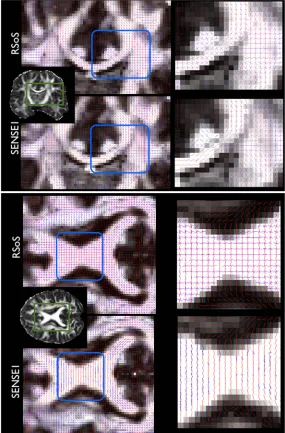
Figure 3.
Fibre orientations estimated using the ball & stick model on RSoS and SENSE1
reconstructed data. Notice that both reconstructions were performed on the same k-space DW data, acquired at b=3000 s/mm2. Coronal (top) and axial (bottom) perspectives are
shown. In each voxel, the fibre orientations that had a volume fraction larger than 5% are plotted, superimposed on anisotropy maps.
NIH-PA Author Manuscript
NIH-PA Author Manuscript
Figure 4.
Measured and predicted signals from a very anisotropic voxel in the midbody of the corpus callosum. The measured signals, reconstructed using either RSoS or SENSE1, are shown in red and blue respectively. Model predicted signals with one fibre are shown in black. For RSoS, the model prediction with three fibres is also shown, as it explains better the data. Note that DW volumes are sorted as in Figure 2 (i.e. data acquired parallel to perpendicular to the main fibre direction are shown). The first, high-intensity datapoints correspond to b=0 s/mm2 signals. The data are from the b=2000 s/mm2 acquisition, after eddy current
correction.
NIH-PA Author Manuscript
NIH-PA Author Manuscript
Figure 5.
CSA ODFs estimated from the RSoS (red) and SENSE1 (green) reconstructed signal. Two ROIs are shown, in the corpus callosum and the centrum semiovale. Notice the squashing of the ODFs with RSoS, particularly for the most anisotropic callosal region. The ODFs from two voxels (dashed regions) are shown magnified at the bottom.
NIH-PA Author Manuscript
NIH-PA Author Manuscript
NIH-PA Author Manuscript
NIH-PA Author Manuscript
[image:15.612.77.472.144.222.2]NIH-PA Author Manuscript
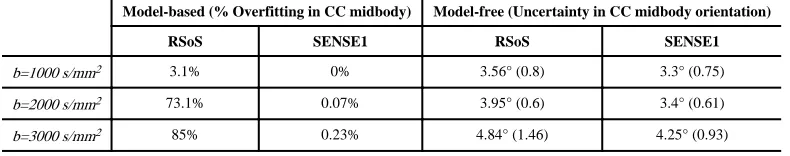
Table 1
Effect of image reconstruction method of fibre orientation estimation, for different b values. RSoS causes excessive overfitting for the ball and stick model and increased orientation uncertainty for the CSA ODFs. The uncertainty values depict the mean (st. dev.) 95% cone of uncertainty (in degrees) across the ROI.
Model-based (% Overfitting in CC midbody) Model-free (Uncertainty in CC midbody orientation)
RSoS SENSE1 RSoS SENSE1
b=1000 s/mm2 3.1% 0% 3.56° (0.8) 3.3° (0.75)
b=2000 s/mm2 73.1% 0.07% 3.95° (0.6) 3.4° (0.61)