Abstract— Most building constructions incorporate simple beam-column members designed to carry both axial and flexural loadings. These elements can exhibit different behaviour under fire conditions. Large displacements are often experienced by these elements when subjected to elevated temperatures making the analysis to become more nonlinear. This paper presents results from a performance based thermal and structural analyses of simple beams carrying non-structural concrete slabs. Numerical as well as simple theoretical models are developed and a comparison is made using the experimental results from tests conducted at the Warrington research centre, UK. Maximum coefficients of variation (COV) of about 2% and 6%, for mid-span deflection and temperature distribution respectively, demonstrates that the numerical model and trial results are in good agreement. Moreover, correlation coefficients of 99% or better can be achieved by implementing the theoretical models in predicting the deformation behaviour of the beams.
Index Terms— Beam-column, fire, load level, performance based methodology.
I. INTRODUCTION
The behaviour of steel beams under fire conditions has been extensively investigated both numerically and experimentally [1]-[5]. However, simple theoretical computations are hardly available for the assessment as well as preliminary design of the response parameters such as strength and deformation characteristics. A few have adopted the stochastic method to assess the performance of steel frames in fire while most modellers have employed the traditional techniques. These two approaches have been found to be reasonable in the computation of the required response parameters. The new trend in research seems to rely more on valid numerical predictions in order to circumvent the excessive cost that are inevitably present as contained by experimental techniques. Some of the parameters that can greatly influence the behaviour of steel beams in fire include, but not limited to, boundary conditions, restraint to thermal expansion, fire scenario, section factor and load level [1].
Recently, the trend of fire design has begun to move from the traditional prescriptive approach to a more robust performance based approach. Though, an increase in material ductility with increasing temperature enhances structural integrity, at high enough temperatures the strength and stiffness of structural steels are reduced. The traditional
E. Ufuah is a PhD research student at the University of Manchester, UK and is on study leave from Ambrose Alli University, Ekpoma, Nigeria (email: [email protected])
prescriptive approach to design is based on individual member analysis to assess the strength and behaviour under various loading conditions. This approach, though conservative in most cases, has been successfully implemented in most of the existing buildings. In the case of rolled steel joist I-section, the critical element is recognized to be the bottom flange of the beam. However, the web can be seen as critical for laterally unrestrained sections which can often result in lateral-torsional buckling under compressive loadings. In this paper, a performance based methodology as well as simple theoretical formulations is developed to evaluate the behaviour of simply supported beams carrying non-structural concrete slabs under fire conditions.
II. THERMO-MECHANICAL PROPERTIES OF STEEL AT ELEVATED TEMPERATURES
The materials which are commonly used to fabricate steel beams for onshore structural works include S235 and S275. Nevertheless, the provision for high strength requirement may necessitate the use of S355 steel in this environment. When a steel structure is exposed to fire, the temperature of the element will increase from ambient to a high level, thereby leaving the material to degrade in strength and stiffness. According to Eurocode 3 Part 1-2 [6], various models are recommended to determine the reduction of elastic modulus and yield strength of different steels at elevated temperatures. In addition, the thermal properties of carbon steel at elevated temperatures; namely thermal conductivity and specific heat used in this present study were computed using the correlations in Eurocode 3, Part 1-2 [6]. These properties at high temperatures are illustrated in Fig. 1.
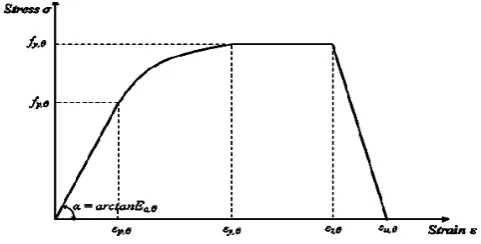
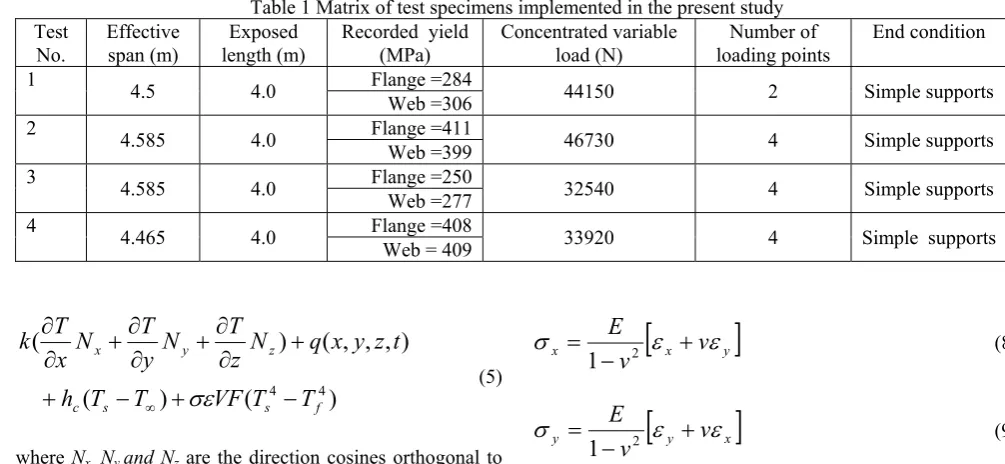
The reduction factors for proportional limit, yield strength and linear elastic range for carbon steel at elevated temperatures is represented in Fig. 2. A typical stress-strain-temperature curve for carbon steel is shown in Fig. 3 whereas the yield values for the various steel sections used in the present study are given in Table 1. The stress-strain model for carbon steel at elevated temperatures is illustrated in Fig. 4. A spreadsheet is usually developed to calculate the stresses and strains in conjunction with the stiffness as demonstrated in Fig. 4. Although, stiffness computation in this regard is somewhat implicit, it should be noted that it is a function of the linear elastic range within the stress strain characterization. It should also be emphasized that the model of Fig. 4, which explicitly excludes the effect of strain hardening, is derived by implementing the correlations defined in Eurocode 3, Part 1-2 [6].
A Performance Based Fire Analysis of Simple
Beams Supporting Non-structural Concrete Slabs
Fig. 1 Thermal properties of carbon steel at elevated temperatures.
Fig. 2 The reduction factors for yield strength, proportional limit and linear elastic range for carbon steel.
Fig. 3 Stress-strain curves for carbon steel at elevated temperatures
Fig. 4 Stress-strain model for carbon steel at elevated temperatures
III. MODELLING TECHNIQUES
The numerical calculations were carried out using a general-purpose commercial code-ABAQUS [7], which has the capability of predicting the thermal and mechanical responses of structures based on finite element method. The large displacement effects of the non-linear finite elements are considered using an updated Lagrangian formulation.
structural response using the standard ISO 834 fire load [8]. This methodology rather considers the fire behaviour by adopting a standard temperature time curve that characterizes the heating regime of a fire.
The multi-linear stress-strain curves at various temperatures describe the non-linear behaviour of the material. The plasticity is calculated by the von Mises yield criteria and the associated flow rule [7]. The results of the heat transfer analysis are implemented in the structural analysis making it possible to account for the effects of thermal strains. Therefore, the simulation assumes a sequentially coupled thermal-stress procedure in which a thermal analysis is followed by a stress analysis. All the beams investigated are 254x146x43UB and subjected to various point loads with a load level of 0.6 [9]. The loads were computed using elastic design in accordance with BS5950 Part 8 [10]. The segmented concrete toppings, nominally 650mm wide and 130mm thick, were characterized as non-structural and their influence on the resultant deformation of the beams was immaterial in all the analyses. However, to avoid stress concentration the total variable load at each loading point was divided equally amongst nine nodes. In addition, a theoretical formulation was developed from a regression analysis for the various grades of steel to calculate the deformation characteristics at elevated temperatures.
In order to compute the thermal and structural responses of the model beam, the governing differential equations for heat conduction and structural equilibrium together with the corresponding constitutive material model are required. However, the 3-D heat conduction equation can be generally stated as follows [11]:
)
,
,
,
(
)
,
,
,
(
x
y
z
t
t
T
c
t
z
y
x
Q
z
q
y
q
x
q
x y z
(1)where qr(r=x,y,z) represents the heat flux in the three
coordinate directions, T is the current temperature, Q(x,y,z,t)
is the rate of internal heat generation, t is the time, ρ is the density and c is the specific heat.
The conductive heat flux defined by the Fourier law can be written in general form as follows:
flow
of
coordinate
r
r
T
k
q
r r
,
(2)However, the thermal conductivity values of steel do not show significant spatial variation so that a homogeneous thermal conductivity k can be adopted in the following form:
0
)
,
,
,
(
)
,
,
,
(
2 2 2 2 2 2
t
z
y
x
t
T
c
t
z
y
x
Q
z
T
y
T
x
T
k
(3)The proper boundary conditions required to solve (3) for the temperature field relate to initial temperature T, internal heat generation Q= f (q) and heat fluxes qr as given in (4) and (5).
)
,
,
(
)
0
,
,
,
(
x
y
z
t
T
0x
y
z
[image:2.595.48.292.353.477.2] [image:2.595.47.288.516.638.2]Table 1 Matrix of test specimens implemented in the present study Test
No. Effective span (m) length (m) Exposed Recorded yield (MPa) Concentrated variable load (N) loading points Number of End condition 1
4.5 4.0 Flange =284 Web =306 44150 2 Simple supports
2 4.585 4.0 Flange =411 46730 4 Simple supports
Web =399
3 4.585 4.0 Flange =250 32540 4 Simple supports
Web =277
4 4.465 4.0 Flange =408 33920 4 Simple supports
Web = 409
)
(
)
(
)
,
,
,
(
)
(
4 4
f s s
c
z y
x
T
T
VF
T
T
h
t
z
y
x
q
N
z
T
N
y
T
N
x
T
k
(5)
where Nx, Ny and Nz are the direction cosines orthogonal to
the boundary surface, hc is the film coefficient, Ts is the
surface temperature assumed uniform through the thickness,
Tf is the fire temperature, T∞ is the temperature of the
surrounding medium, ε is the surface emissivity of the material, σ is the Stefan Boltzmann constant (= 5.667 x 10⁻⁸Wm-2K-4) and VF is the configuration factor.
This temperature field was then applied to the mechanical model as a forcing function to calculate the stresses and strains by means of incremental plasticity theory with temperature-dependent mechanical material properties. The transport properties comprising convective heat transfer coefficient and radiative emissivity utilised in the numerical computations of temperature profile are 25 W/m2K and 0.7 respectively. The view factor was assumed unity by neglecting the position and shadow effects.
The material model often adopted in the analysis of steel structures is assumed to follow the von Mises yield criterion and the associated flow rule [12]-[14]. The general purpose non-linear finite element analysis code ABAQUS [7] adopts the Newton-Raphson approach to incrementally solve the resulting differential equations. In this state, the mechanical strength and behaviour of a material need to be assessed by implementing the correlations (6) and (7) [14].
0
,j
i
ij
f
(6)
D
ep
B
U
e
C
th
M
T
e (7)where σijis a stress tensor, fi is a body force, Δσ is the
incremental stress, Dep is the elasto-plastic stiffness, B is
strain-displacement relation, Ue is nodal displacement, Cth is
thermal stiffness, M is temperature shape function and ΔTe is
nodal incremental temperature.
For a two dimensional stress analysis, after measuring the released strains following both thermal and mechanical loadings, the stresses in two orthogonal directions can been calculated by implementing (8) and (9) [15]-[16].
x y
x
v
v
E
21
(8)
y x
y
v
v
E
21
(9)However, in fire conditions with increase in strains the resultant stresses are reduced and thus the thermo-elastic stresses should be calculated according to (10) and (11) [15].
v
v
T
v
E
T y
x
x
(
1
)
1
2
(10)
v
v
T
v
E
T x
y
y
(
1
)
1
2
(11)where σx, σy are two orthogonal direct stresses, εx, εy are the two orthogonal direct strains, E is elastic modulus, ν is Poisson’s ratio, αTis coefficient of thermal expansion and T
is temperature.
IV. RESULTS AND DISCUSSION
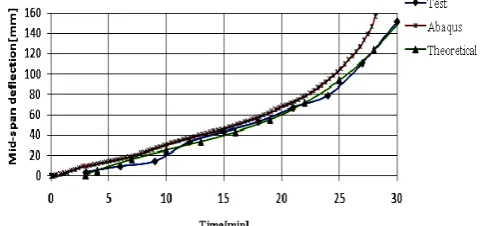
[image:3.595.39.542.53.285.2]The results of heat transfer analysis were used as part of the forcing function in the mechanical computation. These results are shown in Table 2. Moreover, the results of stress analysis are given in Table 3 and illustrated in Figs. 5-8. Table 4 shows the theoretical correlations from the results of a regression analysis conducted. A comparative assessment between the experimental results and the model predictions gave maximum coefficient of variation (COV) of 0.021 for mid-span deflection. However, a COV of 0.06 was also computed between experimental and numerical results for temperature distribution.
Obviously, the heterogeneity of temperature distribution across the beam section has a significant influence on the strength and behaviour of the beam. However, it was also observed that the thickness of the section plays an important role in dictating the magnitude of temperature reached without considering thermal equilibrium. Coupled with the numerical computation, simple theoretical calculations were conducted based on the method of least squares as illustrated in the appendix. Test beam is designated TB whereas COV
Table 2Comparison of fire test results with finite element predictions: Temperature Beam
No. Test results Finite element (FE) results Ratio of test to FE results Test
period [min]
UFT
[oC] WT [oC] LFT [oC] FRP [min] UFT [oC] WT [oC] LFT [oC] FRP UFT WT LFT
TB1 35.5 535 691 682 35.5 521.33 735.77 727.48 1 1.03 0.94 0.94
TB2 23 423 660 647 23 396.92 658.80 633.43 1 1.07 1 1.02
TB3 22 423 634 623 22 394.12 645.22 624.90 1 1.07 0.98 0.997
TB4 30 519 701 692 30 498.54 704.01 692.46 1 1.04 0.996 0.999
Mean 475 671.5 661 452.73 685.95 669.57 1 1.05 0.98 0.99
[image:4.595.48.545.173.739.2]COV 0.127 0.045 0.048 0.147 0.035 0.073 0 0.02 0.028 0.06
Table 3 Comparison of fire test results with finite element predictions: Mid-span deflection
Beam No. Test results Finite element (FE) results Ratio of test to FE results
Test period
[min]
Mid-span deflection[mm]
FRP [min] Mid-span deflection[mm]
FRP Mid-span deflection
TB1 35.5 148 29.11 147.626 1.22 1
TB2 23 144 21.78 146.434 1.06 0.98
TB3 22 140 21.44 146.955 1.03 0.95
TB4 30 152 28.11 156.618 1.07 0.97
Mean 146 149.418 1.095 0.975
COV 0.035 0.032 0.078 0.021
Table 4 Regression analysis results for mid-span deflection δ of the studied beams Beam No. Steel grade Theoretical correlations for mid-span deflection
TB1 S275
0
.
0043
t
3
0
.
133
t
2
4
.
06
t
7
;
t
2
min
TB2 S355
0
.
00326
t
3
0
.
957
t
2
12
.
2
t
28
;
t
3
min
TB3 S275
0
.
0407
t
3
1
.
13
t
2
12
.
66
t
27
;
t
3
min
TB4 S355
0
.
01
t
3
0
.
326
t
2
6
.
4
t
16
;
t
3
min
[image:4.595.60.286.622.724.2][image:4.595.305.548.626.739.2]
Fig. 5 Mid-span deflection for test beam 1 (TB 1)
Fig. 6 Mid-span deflection for test beam 2 (TB 2)
Fig. 7 Mid-span deflection for test beam 3 (TB 3)
V. CONCLUSION
The strength of steel beam-columns subjected to lateral pressure under heat loads was investigated by a series of numerical and theoretical computations. The results demonstrate that the finite element models as well as the theoretical formulations are in good agreement with the test data and may, thus be safely used for preliminary fire design.
APPENDIX
The mid-span deflection δ can be modelled in the form:
D
i
f
,
i
scalar constantsThe residuals can be denoted as follows.
/
,
1
f
D
r
ni
i
i i,
i
f
r
The sum of the least squares of the residuals is given by
ni i
r
S
1 2
The regression of the mid-span deflection on time (equivalent to temperature rise) can be achieved by minimizing the sum of the least squares of the residuals.
0
2
jj i n
i m
j i
r
r
S
ACKNOWLEDGMENT
E.Ufuah wishes to thank the federal government of Nigeria under the platform of petroleum technology development funds (PTDF) and the management of Ambrose Alli University, Ekpoma for their financial support.
REFERENCES
[1] V. K. R. Kodur, and M. M. S. Dwaikat, “Response of steel
beam–columns exposed to fire”, Engineering Structures,vol. 31, 2009, pp 369-379.
[2] M. M. S. Dwaikat, V. K. R. Kodur, S. E. Quiel, and M. E. M. Garlock, “Experimental behaviour of steel beam-columns subjected to fire-induced thermal gradients”, Journal of Constructional Steel Research, vol. 67, 2001, pp 30-38.
[3] R. B. Dharma, and K-H. Tan, “Rotational capacity of steel I-beams under fire conditions Part I: Experimental study”, Engineering structures, vol. 29, 2007, pp 2391-2402.
[4] R. B. Dharma, and K-H. Tan, “Rotational capacity of steel I-beams under fire conditions Part II: Numerical simulations”, Engineering structures, vol. 29, 2007, pp 2403-2418.
[5] M. M. S. Dwaikat, and V. K. R. Kodur, “A performance based methodology for fire design of restrained beams, Journal of Constructional Steel Research, vol. 67, 2011, pp 510-524.
[6] European Committeefor Standardization CEN, Eurocode 3, Design of
steel Structures- Part 1-2; BS EN 1993-1-2, General Rules- Structural
Fire Design, 2005.
[7] ABAQUS Standard/explicit user’s manual, Version 6.8-2, vol. 1,2,3
and 4. USA: Dassault Systèmes Simulia Corp., Providence, RI.
[8] International Organization for Standardization, ISO 834-1,
Fire-resistance tests; Elements of Building Construction - Part 1: General Requirements, 1999.
[9] D. E. Wainman, and B. R. Kirby, Compendium of UK Standard Fire
Test Data, Unprotected Structural Steel-1, British Steel Corporation,
RS/RSC/S10328/1/87/B, 1988.
[10] British Standard: Structural use of steelwork in building-Part 8, BS
5950-8, Code of practice for fire resistance design, 2003.
[11] F. P. Incropera, and D. P. Dewitt, Introduction to heat transfer, 3rd ed.,
John Wiley & sons, 1996.
[12] O. Kaitila, Finite element modelling of cold-formed steel members at
high temperatures, Helsinki University of Technology Laboratory of
Steel Structures Publications 24. Espoo: Helsinki University of Technology, 2002.
[13] ] P. M. M. Vila Real, N. Lopes, L. Simões da Silva, P. Piloto, and J. M. Franssen, “Numerical modelling of steel beam-columns in case of fire-comparison with Eurocode 3”, Fire Safety Journal, vol. 39, 2004, pp 23-39.
[14] T-L. Teng, P-H Chang, and W-C Tseng, “Effect of welding sequences on residual stresses”, Journal of Computers and Structuresvol. 81, 2003, pp 273–286.
[15] R. Szilard, Theory and analysis of plates: Classical and numerical
methods. Prentice-Hall Inc, 1974.