J. Range Manage.
51:9-l 3 January 1998
Energy cost of cattle walking on the level and on a gradient
O.N. DI MARCO AND M.S. AELLO
Authors are professors of animal nutrition at the Agricultural Science College of the National University of Mar de1 Plats, Department of Animal Science, CC 276, (7620) Balcarce, Argentina.
Abstract
The effect of walking on cattle energy expenditure was assessed by monitoring the CO, production of cattle with the
“‘C-entry rate technique. Seven Angus steers (298 f38 kg BW) were peritoneally infused with a solution of NaH14C03 for 72 hours using portable peristaltic pumps. The steers were forced to walk after 24 hours of infusion, on 2 consecutive days. On the first day, walking was at a constant speed of 2 km.hour’, divided in 4 periods of 0.5 hours (1 km), iirst on the level ground, second and third ascending and descending a 6% grade, and ilnally on the level surface on the way back to corrals. On the second day, cattle walked 1 km at 1 km hour”, and thereafter walked 4 km at 4 km hour-’ on the level. Saliva samples were collected for periods of 0.5 hours before and during different periods of walking and at rest at 2 and 4 hours after the activity. Concentration and specific activity of CO, were measured in saliva samples to estimate the rate of CO2 production [ml.hour’ .(Bw’q’5)-1] as the ratio between the rate of infusion (pCi.hour-‘) and the specific activity of CO, (pC!i.liter-’ of COz). The production of CO2 was converted to heat production using an energy equivalent of 5.26 kcal.liter~‘. Average energy expenditure (EE) in cor- rals ln both days before the activity was 82.6 f 3.1 kcal hour-
‘.lOO kg BW-’ [650 ml CO~hour-1.(Bw0.‘5)-1]. The cost of walk- ing on the level surface and on the 6% grade was 9.0 f 1.14 and 16.4 f 2.18 kca1.km~‘.100 BW”, respectively. There was a small nonsignificant residual effect of walking that disap- peared a few hours after exercise. It was concluded that the cost of walking can only have a minor effect on the energy requirement of grazing cattle.
Key Words: voluntary activity, energy expenditure, carbon dioxide entry rate
Freely grazing cattle spend most of the day harvesting forage and walking, consequently it has been assumed that the extra energy expenditure on pastoral systems may affect production of beef or dairy cattle. Daily, cattle could spend 8 to 10 hours graz- ing and would walk between 2 to 8 km (Herbel and Nelson 1966,
This experiment is part of the project “Factors affecting energy expenditure of grazing cattle” supported by the University of Mar de1 Plate, CONICET and INTA of Argentina. ~-
Manuscript accept 26 Feb. 1997.
Resumen
El efecto de la caminata sobre el gasto energetic0 de vacu- nos fue evaluado a traves de la production de CO,, estlmada por la tasa de dilution de1 radiocarbono (“C). Siete novillos Angus (298 fi8 kg peso corporal) se infundieron intra-peri- toneahnente con una solution de NaH’CO, durante 72 h, uti- lizando bombas peristalticas port&tiles. Los novillos se hicieron camlnar durante dos dias consecutivos, comenzando la actividad despues de 20 h de1 inicio de la infusion. El primer dia, la caminata se realii6 a una velocidad con&ante de 2 km&‘, en cuatro periodos de 0,s h (1 km). Primer0 camlnaron en el llano, segundo subiendo una loma de 6% de pendiente, tercero bajando la n&ma y, finahuente, volvieron a caminar en el llano para volver a 10s corrales, donde des- cansaron hasta el proximo dia. El segundo dia camlnaron en el llano, primer0 recorriendo una distancia de 1 km a una velocidad de 1 km h’ y, posteriormente, sobre una dlstancia de 4 km a una velocidad de 4 km&‘. Se colectaron muestras de saliva durante periodos de 0,5 h antes, durante 10s diie- rentes periodos de actividad, y a las 2 y 4 h de descanso despues de la misma. Se midi la concentration y activldad especiilca (AE) de1 CO, en las muestras de saliva, para esti- mar la production de CO2 [ml k’.(kgO,75)‘]. Esta se calcul6 coma la relaci6n entre la tasa de lnfusidn (pC!i.h-‘) y ia AE de1 CO, (pCi.1“ de CO& La production de CO, se convirti6 en calor, utilizando coma equivalente energetic0 de1 CO2 el valor 5,26 kcal.1~‘. El promedio de gasto energetic0 en corral durante 10s dos dii; previo a la activldad, fue de 82,6 f 3,l kcaLh-‘.108 kg” [650 ml C0~k1.(kg0,75)“]. El cost0 de cami- oar en el llano y en la loma de 6% de pendiente fue de 9,0 f 1,14 y 16,4 f 2,18 kcal.knil.lOO PV’, respectivamente. Hubo un pequeiio y no signiflcativo efecto residual de la caminata que desaparecid unas pocas horas despub de1 ejercicio. Se concluyo que el costo de la caminata solamente puede tener un efecto de poca importancla en 10s requerlmlentos energeti- cos de vacunos en pastoreo.
Ribeiro et al. 1977, Aello and G6mez 1984, Lathrop et al. 1988, Hart et al. 1993).
Energy expenditure of grazing cattle has been investigated by
various workers during the last 20 years. Most estimations of
energy cost of walking in cattle are derived from experiments
with sheep (Clapperton 1964, Graham 1964), or from the study of
Ribeiro et al. (1977) with cattle. Data from calorimeters or respi-
ration chambers indicate that walking may considerably increase the requirement of maintenance. For example Ribeiro et al.
(1977) estimated, from data of cattle walking on a treadmill, that animals travelling between 1 to 6 km could increase energy requirement by about 4 to 24% above maintenance. These workers measured 0, consumption of 4 steers walking on a treadmill at speeds between 2 to 5 km hour’, concluding that the average ener- gy cost for walking in cattle was about 50 kcal.km~*.100 kg BW-’
as it has been reported in sheep (Clapperton 1964, Graham 1964).
It is important to remark that research on the energetic cost of cattle walking on the open range has been limited by available methodologies, and also because measurement depends on obser- vations of an increase in heat production that is often small in rela- tion to that standing still (Farrell et al. 1972). Therefore, values from 45 to 60 kcal.kni’.100 kg BW’ have been generally accept- ed for unrestrained cattle walking on the open range (Osuji 1974, ARC 1980, CSlRO 1990). Consequently it has been assumed that if walking has such high energy cost, the reduction of the distance travelled could save energy and improve production.
Graham (1964) suspected that animals on a treadmill could exhibit a higher energy expenditure than those walking in the open range and many researchers have not found that walking per se effected animal performance, or that the effect was much lower than expected. For example Thomson and Barnes (1993) did not find a negative effect on milk production of dairy cattle travelling 8 km day-‘, even though their cows walked part of that distance over a 15 m hill. Lamb et al. (1979) found that walking improved reproductive and feeding efficiency without affecting production, in 2-year-old dairy heifers that have been kept in con- finement. Gemeda et al. (1995) reported minor differences in body weight losses and milk production between working and non-working cows. Nicholson (1987) found that the effect of long-term walking on zebu cattle productivity was negligible. He concluded that the additional energy requirements for walking are very small and lower than those reported in the literature. In addi- tion, Mendez et al. (1996) estimated from the carbon dioxide dilution rate technique that cattle walking between 6 to 9 km day-’
at 3 km hour-’ would increase energy expenditure by only 4 to 6%. Findings cited above indicate that the energy cost of walking on the open range may be lower than those on treadmills, which cast doubts on the negative effect of this extra energy cost on grazing cattle production.
This research was conducted to evaluate the energy cost of free-walking cattle travelling on the level at speeds of 1, 2, and 4 km hour’, on a 6% gradient at 2 km hour-‘, and standing still before and after 2 and 4 hours of the exercise, using the carbon dioxide dilution rate technique (Whitelaw 1974, White 1993).
Materials and Methods
Carbon Dioxide Entry Rate Technique
Energy expenditure of walking cattle was evaluated in the fall of 1995, in Balcarce, Argentina (37” 45’ south, 58” 18’ west), from the CO, production estimated by the CO, entry rate tech- nique (Young 1970).
A solution of NaHr4C0, (American Radiolabeled Inc., pH=lO) was infused at a rate of 8.1 uCi hour-’ for 72 hours using individ- ual battery-powered peristaltic pumps (Syropum, Everest Electronic, Australia). The pumps were carried in a canvas pouch on a wither harness. Saliva was drained manually from a parotid
salivary duct cannula directly into a plastic flask attached to the cattle neck. Samples were collected before and during different periods of walking, and at rest 2 and 4 hours after the activity.
Sampling commenced at least 20 hours after the infusion was started (Sanchez and Morris 1984) and over periods of 30 min- utes to provide an integrated value of specific activity of CO, over the period the exercise was performed.
The specific activity of COZ was calculated in saliva samples dividing the activity ($i.ml saliva) by the concentration of CO, in the samples of saliva (ml CO,.ml’ saliva). Carbon dioxide concentration was determined by Neiss’s technique (Sahlu et al.
1988) and r4C-activity was measured in 1 ml of saliva, mixed with 9 ml of a scintillation cocktail. In each case determinations were made in triplicate.
Carbon dioxide production rate was calculated as the ratio between the infusion rate (pCi hour-‘) and the specific activity of CO, (l.Ki liter-’ of COZ) (Corbett et al. 1971), and was expressed as ml of CO, hour-’ (kg”.75)-*. Heat Production (HE) was estimated assuming an energy equivalent of 5.26 kcal liter-’ of CO, (derived from data of Sahlu et al. 1988, and Elia et al. 1988).
Angus steers, 18 to 20 months of age, were placed in individual corrals for 1 week and fed alfalfa hay (1 kg DM. 100 kg BW-‘) and also allowed to graze 2 hours day-‘. During this adaptation phase the steers were tamed and trained to walk following a trac- tor at a constant speed. Animals were prepared for infusion of 14C and saliva sampling, placing 1 catheter into the peritoneal cavity, and another into 1 parotid gland duct, which exited the mouth via a perforation in the cheek (as described by Sanchez and Morris 1984, and Salhu et al. 1988).
Field Experiment
For 2 days, 7 steers, 3 of small size (258 f 14.9 kg BW) and 4 of medium size (327 * 6.4 kg BW), walked following a tractor at a constant speed over a predetermined distance. The exercise was performed under fall weather conditions with mild temperature and high humidity. Temperature averages were (“C!) 18.2 with a minimum of 13.4 and a maximum of 23.0. In both days a short rainfall was registered in the morning.
On day 1, the steers were allowed to graze 2 hours in the mom- ing and thereafter walked at 2 km hour-’ for 4 distance intervals of 1 km each (30 minutes). First interval was on the level ground, the second and third interval ascended and descended a 6% grade, and the fourth interval was on the level ground on the way back to corrals. The second day, they walked a distance of 1 km at 1 km hour-‘, and thereafter 4 km at 4 km hot& (intervals of 1 hour each) on level ground. Saliva samples were taken over a period of 30 minutes on each walking interval and also replicated samples were taken during the 1 hour-walking interval at 4 km hour-‘.
Additionally, saliva was taken before the activity of each day, and after 2 and 4 hours after the activity.
Statistical Analysis
Walking energy cost on the level ground @al km-‘) was estimat- ed by linear regression using speed (0, 1, 2, and 4 km.hom’) as the independent variable and energy expenditure (kcal.hom’.lOO kg BW-‘) as dependent variable. Energy cost of walking on the 6%
grade was calculated by the average increase of EE walking on the grade (ascending and descending) relative to that observed in corrals (kcal hour’), divided by the distance travelled (2 km).
Mean standard errors were computed in each case. Comparison of EE between both days in corrals before activity, walking at 2
10 JOURNAL OF RANGE MANAGEMENT 51(l), January 1998
km.houi’ before and after walking on the grade, ascension vs descension of the grade, resting 2 and 4 hours after the activity, and within the period of 1 hour walking at 4 km hour-‘, was ana- lyzed by 1 way ANOVA (p < 0.1) and significant F-means were tested by Fisher’s (LSD) test.
Results and Discussion
Application of “C entry rate technique
Steers adapted well to the experimental protocol and no techni- cal problems were detected during the 3 days of continuous infu- sion of 14C, or during saliva collection. It was very important to work with tamed and trained animals to collect saliva without
altering normal behavior of cattle. With a catheter properly placed in the parotid duct, saliva was collected continuously while cattle were walking or standing still without disturbing them. It was also mandatory to use proper portable peristaltic pumps, that assured 14C infusion at a constant rate under field
conditions during the 3 days of the study.
Saliva sampling from the parotid gland was chosen because it appeared to be easier and less stressful than continuous blood sampling. Engels et al. (1976) reported also greater precision in estimating energy expenditure from entry rate data derived from saliva than from urine or blood, and Whitelaw (1974) pointed out that this technique estimates CO, production with high precision, showing only minor differences with estimations on respiration chambers (Sahlu et al. 1988) and with the advantage of not dis- turbing animals on the open range. Saliva is secreted continuous- ly and its bicarbonate content (C02) equilibrates ‘with all extracel- lular bicarbonate in the rest of the body causing changes of CO2 production rapidly (Whitelaw 1974).
Variations in CO2 production were as depicted in Fig. 1. The low- est values were observed in conals before the activity [650 * 27.1 ml houi’.(kg Bw75)-‘] and on the short walk of 1 kilometer at 1
kmh~uf' (722 f. 48.8). These values were not significant (p > 0.1).
The highest level of CO2 was produced when walking on the gra-
950,
WH
3 WL: 4 km.6’
R4h
R4h
dient or on level ground at 4 km hour-‘. The increases in CO2 when walking at 2 and 4 km.hour’ on the level ground [837 * 26.3 and 919 + 40.0, mlhour-‘(kg B,.75)-‘, respectively] as well as on the grade (908 ~40.9) were significantly different from those in corrals (p I 0.1). However differences due to walking at 2 and 4 km.hour-’ on the flat, and on the 6% gradient were not significant (p > 0.1).
Energy Expenditure
It is important to bear in mind that an estimate of CO, entry rate, whether derived from blood, urine, or exhaled gas samples, is not necessarily an absolute measure of the rate of CO2 produc- tion either by the body tissues or the whole animal. It is a practi- cal index of heat production (HP) or energy expenditure (Corbett et al. 1971) that depends on the energy equivalent of CO2 which varies with the type of fuel being oxidized. Whitelaw (1974) pointed out that HP derived directly from the 14C entry-rate and the appropriate energy equivalent of C02, is as accurate as other published equations. Therefore, such approach was used in the present experiment, assuming an energy equivalent of 5.26 kcal liter-’ of CO2 (Sahlu et al. 1988; Elia et al. 1988). It is important to point out that estimations from this procedure agree very well with published prediction equations for sheep by Sahlu et al.
(1988) and for cattle by Young (1970).
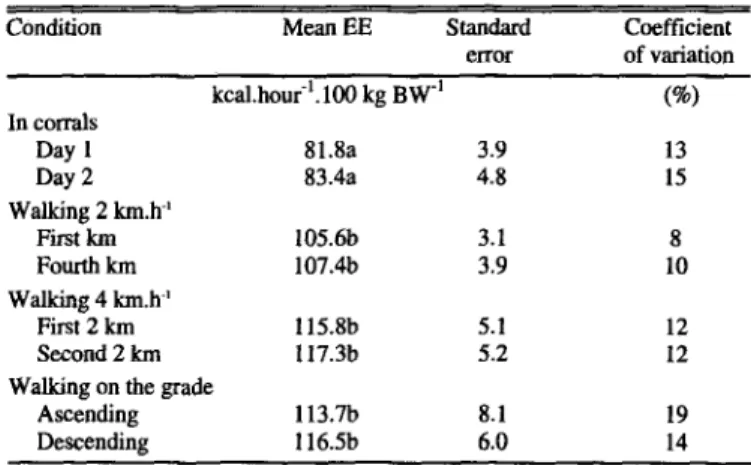
Differences in energy expenditure in both mornings in corrals before activity, or in 2 moments under the same level or intensity of activity were very small and had standard errors of each esti- mation between 3 to 8% (Table l), in accordance with Young (1970), Whitelaw (1974), and Havstad and Malechek (1982), who reported mean standard errors of 7 to 20%. The coefficient of variations in the present study were between 8 to 19% of the mean.
Table 1: Energy expenditure of 7 steers in 2 moments in corrals or under the same level of activity.
Condition
Mean EE standard Coefficient
error of variation kcal.houi’.lCJl kg BW-’
In corrals
Day 1 81.8a 3.9
Day 2 83.4a 4.8
Walking 2 km.h-’
First km 105.6b 3.1
Fourth km 107.4b 3.9
Walking 4 km.h-’
First 2 km 115.8b 5.1
Second 2 km 117.3b 5.2
Walking on the grade
Ascending 113.7h 8.1
Descending 116.5b 6.0
a,bc Means followed by different letter are siguifiiant (p L 0.1).
6)
13 15
8 10
12
12
19 14
C FRST DAY ’ SECOND DAY The average energy expenditure of both mornings standing in
600-o I I I I I I,, , , , , ,- the corrals before the different periods of activity (n = 14) was
10 13 14 15 16 18 20 9 10 11 12 14 16
82.6 r 3.1 kcal hour-‘.100 kg BW-’ as shown in Table 2. The
HOURS OF DAY
increase of EE was 11, 29, and 40% walking at 1, 2, and 4 km
Fii. 1: Variations in CO2 production rate (ml hour’.kg BWL’P in 7 hour-’ (or on the grade), respectively (8.7, 23.9, and 32.9 kcal
stews in corrals (C), walking (IV) on the level ground (L) at 1,2, hour-‘.100 kg BW“). With the exception of walking at 1 km hour’,
and 4 km/hour, on a 6% grade (a) and at 2 and 4 hours of rest EE expenditure increased significantly (p _< 0.1) above the level
0. observed in corrals when walking. However, effect of walking at
Table 2: Energy expenditure for steers in corral and walking (in kcal.houi’.lOO kg BW’).
Walking pace Surface EE Observations --Increasec--
type
(km.hour-‘) FE) (%I
0 Corral 82.6a i3.1 14 ___ -_
1 Level 91.3a i5.2
68.7a 11
2
Level 106.4b 12.6 13 23.9b 29
2
6%-grade 115.lb ~5.1 14 32.6b 39
4 Level 116.6b k3.7 14 33.lb 41
a.b Means followed by different letters are significant (p -z 0.1).
c Increase in energy expendihm relative to standing in a corral.
2 km hour-r (on level ground and on the 6% grade) or at 4 km hour-’ were not different (p > 0.1) among themselves (Table 2).
The lack of significance could be attributed mainly to the small relative differences in rate of CO, production among periods of activity, which were below, or close to, the limit of significance of 15% (P I 0.1) that this methodology was able to detect under the conditions of the present experiment.
When the speed was duplicated from 1 to 2 and from 2 to 4 km.hour-’ EE increased 18 and 12%, respectively, which is par- tially in accordance with Ribeiro et al. (1977) who reported that when walking speed on the treadmill increased from 2.4 to 5 km.hour-r EE augmented 18% in young cattle. However, they also found in their study that older cattle exhibited a minimum of EE when walking at a speed of 3.3 km hour’, which means that EE increased when animals walked at higher or lower speeds.
The maximum increase of energy expenditure of 40% observed in the present study is in agreement with those reported by Havstad and Malechek (1982) in grazing heifers (46%) and by Maloiy et al. (1986) in African women (47%) carrying a load of 61% of their body mass on a treadmill. One is tempted to specu- late that this maximum increase of energy expenditure of 40 to 50% above the no-activity level could be indicating same physio- logical limit of aerobic capacity.
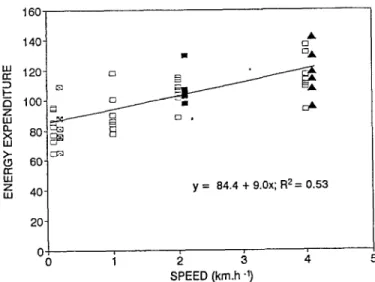
The energy cost of walking on the level ground (y) estimated by regression of heat production (Fig. 2) and the speed (x) was: y
= 84.4 + 9x (St, = 1.14, 8, = 12.63, R2 = 0.53). The average cost of walking on the 6% grade was 16.4 + 2.18 kcal.kml.lOO kg BW-’ with no significant differences between ascending and descending the 6% grade.
Residual Effect of Activity
After walking was terminated the rate of CO, production fell rapidly to the level before activity, following a similar pattern of decline on both days (Fig. 1). After 2 hours of rest, the rate of carbon dioxide production decreased to a level that was not sig- nificantly different from the level previous to exercise. There was a 10% not significant cumulative effect during 4 hours after walking that returned to the baseline observed in corrals after 1 night of rest, therefore the CO, production of the second morning was similar to that on the first morning. Corbett et al. (1971) observed that the CO, entry rate in sheep returned to a baseline 76 minutes after a 3 hour walking interval ended (1.5 km hour“).
Clapperton (1964) reported that the energy expenditure of sheep at night was unaffected by considerable differences in their level of activity by day, and that energy expenditure during the night following the exercise, could decrease because animals tend to lie more during the period of rest. The above author, also pointed out
12
that an increase in the rate of CO, production during the night could have happened only if animals failed to recover from the effect of exercise and enter into the night in a state of oxygen debt.
There was no difference in EE between the first and fourth walking interval at 2 km hour-’ on the level (Table 1). As depict- ed on Fig. 1, CO, production was similar when the steers walked the first kilometer at 2 km.hour’ (interval 1) than when they walked the fourth kilometer (interval 4) on the way back to cor- rals [832 vs 843 ml hour-’ (kg BW”.“)-‘]. In this last walking interval animals had previously walked 1 km on the level plus 2 km ascending and descending the 6% grade.
The l-hour-walking interval at 4 km hour-’ was divided in 2 periods of 30 minutes each to examine whether severe exercise in the preceding first 30 minutes affected the CO2 production of the next 30 minutes (2 km each interval). As shown in Table 1, no differences (1.3%) were found in EE within this walking interval.
Results clearly indicate that there was no carry over effect of the exercise from one day to the next, or between and within walking intervals.
Effect of Walking on Energy Requirement
As mentioned earlier most estimations of how much walking could affect cattle energy requirement are derived from data of Ribeiro et al. (1977), who measured O2 consumption of 4 steers walking on a treadmill at speeds between 2 to 5 km hour-‘. They concluded that on the average the energy cost was 50 kcal.kni’.100 kg BW-‘. However, Corbett et al. (1971) reported an energy cost of walking in 3 sheep walking at 1.5 km hour-r of is approximately half of Ribeiro’s estimation, (21,28, and 36 kcalkm~‘.lC0 kg BW-‘).
In the present study the cost of walking was 9.0 and 16.4 kcal lan“.100 kg BW-‘, on the level and on a 6% grade, respectively. A previous study from our lab (Mtndez et al. 1996) using this methodology showed an energy cost of steers walking at 3 km hour’ of approx- imately 16 kcal.kmr.100 kg BW-‘.
Although data in the present study are the lowest reported in lit- erature, they agree well with estimations of Nicholson (1987) who calculated, from body weight loss, an energy cost of walking
160 140
20 0
y = 84.4 + 9.0x; R2= 0.53