Proceedings of the 2011 Conference on Empirical Methods in Natural Language Processing, pages 771–781,
Collaborative Ranking: A Case Study on Entity Linking
Zheng Chen
Computer Science Department Graduate Center
City University of New York [email protected]
Heng Ji
Computer Science Department Queens College and Graduate Center
City University of New York [email protected]
Abstract
In this paper, we present a new ranking scheme, collaborative ranking (CR). In con-trast to traditional non-collaborative ranking scheme which solely relies on the strengths of isolated queries and one stand-alone rank-ing algorithm, the new scheme integrates the strengths from multiple collaborators of a query and the strengths from multiple ranking algorithms. We elaborate three specific forms of collaborative ranking, namely, micro col-laborative ranking (MiCR), macro collabora-tive ranking (MaCR) and micro-macro collab-orative ranking (MiMaCR). Experiments on entity linking task show that our proposed scheme is indeed effective and promising.
1 Introduction
Many natural language processing tasks can be for-malized as a ranking problem, namely to rank a collection of candidate “objects” with respect to a “query”. For example, intensive studies were de-voted to parsing in which multiple possible pars-ing trees or forests are ranked with respect to a sen-tence (Collins, 2000; Charniak and Johnson, 2005; Huang, 2008), machine translation in which multi-ple translation hypotheses are ranked with respect to a source sentence (Och, 2002; Shen et al., 2005), anaphora resolution in which multiple antecedents are ranked with respect to an anaphora (Yang et al., 2008), and question answering in which mul-tiple possible answers are ranked with respect to a question (Ravichandran et al., 2003). Previous stud-ies mainly focused on improving the ranking perfor-mance using one stand-alone learning algorithm on isolated queries.
Although a wide range of learning algorithms (un-supervised, supervised or semi-supervised) is avail-able, each with its strengths and weaknesses, there
is not a learning algorithm that can work best on all types of data. In such a situation, it would be desirable to build a “collaborative” model by integrating multiple models. Such an idea forms the basis of ensemble methodology and it is well-known that ensemble methods (e.g., bagging, boost-ing) can improve the performance of many prob-lems, in which classification is the most intensively studied (Rokach, 2009). The other situation is re-lated with isore-lated queries handled by learning al-gorithms. The single query may not be formulated with the best terms or the query itself may not con-tain comprehensive information required for a high-performance ranking algorithm. Therefore, tech-niques of query expansion or query reformulation can be introduced and previous research has shown the effectiveness of those techniques in such applica-tions as information retrieval and question answer-ing (Mannanswer-ing et al., 2008; Riezler et al., 2007). Nevertheless, previous research normally considers query reformulation as a new query for the ranking system, it would be more desirable to form a larger-scale “collaborative” group for the query and make a unified decision based on the group.
Inspired from human collaborative learning in which two or more people form a group and ac-complish work together, we propose a new ranking scheme, collaborative ranking, which aims to imi-tate human collaborative learning and enhance sys-tem ranking performance. The main idea is to seek collaborations for each query from two levels:
(1) query-level: search a group of query collabo-rators, and make the joint decision from the group together with the query using a stand-alone ranking algorithm.
(2) ranker-level: design a group of multiple rankers, and make the joint decision from the entire group on a single query.
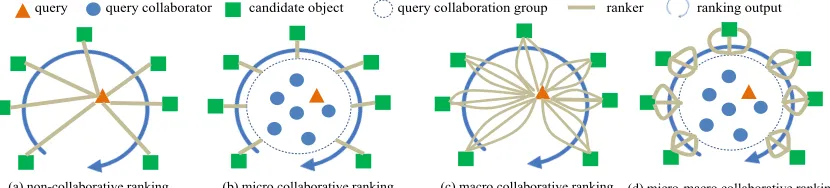
query query collaborator candidate object query collaboration group ranker ranking output
[image:2.612.98.513.78.172.2](a) non-collaborative ranking (b) micro collaborative ranking (c) macro collaborative ranking (d) micro-macro collaborative ranking
Figure 1: Non-collaborative ranking and three collaborative ranking approaches. Figure 1 presents an intuitive illustration of four
ranking approaches, including the traditional non-collaborative ranking and three non-collaborative rank-ing forms: micro collaborative rankrank-ing (MiCR), macro collaborative ranking (MaCR), and micro-macro collaborative ranking (MiMaCR).
Compared with the traditional non-collaborative ranking that only leverages the information con-tained in a single query and only applies one ranking function (Figure 1 (a)), the three collaborative rank-ing approaches have the followrank-ing advantages:
(1)MiCR (corresponding to query-level collabo-ration1) leverages the information contained in the collaborators of a query. Figure 1 (b) demonstrates that 6 query collaborators together with the query form a query collaboration group.
(2)MaCR (corresponding to ranker-level collabo-ration2) integrates the strengths from two or more rankers. Figure 1 (c) demonstrates an example of 3 rankers.
(3)MiMaCR combines the advantages from MiCR and MaCR as shown in Figure 1 (d).
In this paper, we will show the efficacy of collab-orative ranking on the entity linking task defined in the Knowledge Base Population (KBP) track (Ji et al., 2010) at Text Analysis Conference (TAC). Each query in the task is associated with a name string and its context document. Traditional approaches for en-tity linking only made use of the lexical or docu-ment level information contained in the query, how-ever, it may not be sufficient for the task. The intu-ition why query-level collaboration may work is that it leverages more comprehensive information about the entity mention from multiple “collaborators”
(re-1Query is normally expressed by small-scale data structure,
so called micro.
2Ranker is normally implemented by large-scale algorithm,
so called macro.
lated documents containing the name string). Fur-thermore, previous work on this task mainly focused on comparing one ranking algorithm with the oth-ers, however, each ranking algorithm has its own strengths, and therefore, ranker-level collaboration can potentially improve the performance. Last, the combination of query-level and ranker-level collab-oration can lead to further performance gains.
2 Non-collaborative Ranking
Letqdenote a query. Leto(q) = {o(q) 1 , . . . , o
(q)
n(q) }
denote the object set associated withq, wheren(q)
denotes the size of the o(q). The goal of
non-collaborative ranking is to seek a ranking function
f such that it computes ranking scores for the
can-didates in the object set, i.e., y(q) = f(o(q)) =
{
y(1q), . . . , yn(q()q) }
.
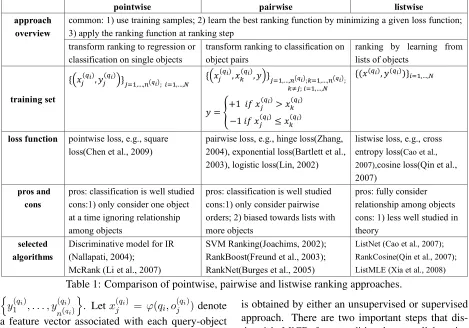
Earlier studies on non-collaborative ranking mainly explored unsupervised approaches, e.g., vec-tor space model, link based algorithm such as PageRank (Page et al., 1998). Unsupervised ap-proaches are based on well-established statistical and probability theory, nevertheless, they suffer from some drawbacks, for example, it is hard to tune parameters. Recently, supervised approaches (named “learning to rank”) that automatically learn ranking functions from training data become the fo-cus of ranking research. In the literature, super-vised approaches are categorized into three classes, namely, pointwise, pairwise, and listwise. We sum-marize a comparison of the three approaches in Ta-ble 1. We use the following notations in the taTa-ble.
LetQ={q1, . . . , qN}denote the set ofNqueries in the training data, each query qi is associated with a set of objects o(qi) =
{
o(qi) 1 , . . . , o
(qi)
n(qi) }
pointwise pairwise listwise approach
overview
common: 1) use training samples; 2) learn the best ranking function by minimizing a given loss function; 3) apply the ranking function at ranking step
transform ranking to regression or classification on single objects
transform ranking to classification on
object pairs
ranking by learning from lists of objects
training set
{ !"(#$),%
"(#$)&}"'*,…,+-.$/; !"#,…,$ {%&' ()*),&
-()*),./}'"#,…,012*3;-"#,…,012*3; -4'; !"#,…,$
. = 5+1 !" #$ (%&)> #
' (%&)
−1 !" #$(%&)≤ #
' (%&)
{(#(%&), .(%&))}
/02,…,3
loss function pointwise loss, e.g., square loss(Chen et al., 2009)
pairwise loss, e.g., hinge loss(Zhang, 2004), exponential loss(Bartlett et al., 2003), logistic loss(Lin, 2002)
listwise loss, e.g., cross entropy loss(Cao et al., 2007),cosine loss(Qin et al., 2007)
pros and cons
pros: classification is well studied cons:1) only consider one object at a time ignoring relationship among objects
pros: classification is well studied cons:1) only consider pairwise orders; 2) biased towards lists with more objects
pros: fully consider relationship among objects cons: 1) less well studied in theory
selected algorithms
Discriminative model for IR (Nallapati, 2004);
McRank (Li et al., 2007)
SVM Ranking(Joachims, 2002); RankBoost(Freund et al., 2003); RankNet(Burges et al., 2005)
[image:3.612.72.541.74.402.2]ListNet (Cao et al., 2007); RankCosine(Qin et al., 2007); ListMLE (Xia et al., 2008)
Table 1: Comparison of pointwise, pairwise and listwise ranking approaches.
{
y(qi) 1 , . . . , y
(qi)
n(qi) }
. Letx(qi)
j = φ(qi, o
(qi)
j ) denote
a feature vector associated with each query-object pair (qi, o(jqi)).
3 Collaborative Ranking
3.1 Micro Collaborative Ranking(MiCR)
Micro collaborative ranking is characterized by inte-grating joint strengths from multiple query collabo-rators and the query itself. It is based on the follow-ing assumptions:
• Expandability: Query is expandable, that is, it is able to find potential collaborators.
• Redundancy: Collaborators and query may
share redundant information.
• Diversity: Collaborators exhibit multifaceted information that may complement the information contained in the query.
•Robustness: Noisy collaborators are allowable, and they could be put under control.
Let cq(q) = {cq1, . . . , cqk} be the k
collabo-rators of a query q. For each object o(jq)
associ-ated withq, we form k+ 1feature vectorsx(jq) =
φ(q, o(jq)), x(cq1)
j = φ(cq1, o
(cq1)
j ), . . . , x
(cqk)
j =
φ(cqk, o(jcqk)) . Let f be a ranking function which
is obtained by either an unsupervised or supervised approach. There are two important steps that dis-tinguish MiCR from traditional non-collaborative ranking approaches:
•Step (1): searching the bestkcollaborators ofq.
•Step (2): simulating the interaction ofk
collab-orators at the ranking step.
Solutions for step (1) can vary from case to case. In our case study presented later, we transform the collaborator searching problem into a clustering problem. Collaborators of a query are then formed by members (excluding the query) in a cluster which contains the query andkis the size of the cluster
mi-nus one.
We transform the problem of step (2) into solv-ing a functiong1 such that a ranking scoreyj(q)can
be computed for each object o(jq). One approach
to computing g1 is to firstly compute the ranking
scores of collaborators and query using the ranking functionf and then combine those ranking scores
in some way (Formula 1). The other approach is to learn a supervised ranking functionf′ which takes
collaborators and query as input (Formula 2).
y(jq)=g1(f
(
yj(q)=g1(•) =f
′(
xj(q), xj(cq1), . . . , x(jcqk)) (2)
We present three specific forms ofg1 in Formula
1, namely, max, min, and weighted. We can also define a special case of weighted, called “average” in whichw0=w1. . .=wk= 1/(k+ 1).
•max: y(jq)=max(f(xj(q)), . . . , f(x(jcqk))) •min: yj(q)=min(f
( x(jq)
)
, . . . , f(x(jcqk)
) )
•weighted: yj(q)=w0f
( x(jq))+
k
∑
i=1
wif
( x(jcqi))
We will discuss three supervised versions of g1
(Formula 2) in section 4.4. A general algorithm for MiCR is presented in Algorithm 1.
Algorithm 1MiCR Algorithm.
Input:
a queryq; a set of objectso(q); a functiong 1 Output:
a set of ranking scoresy(q)
1: Searchkcollaborators ofq: cq(q)={cq
1, . . . , cqk}.
2: forj = 1;j <=n(q);j+ + do 3: Formk+ 1feature vectors:x(jq), x(cq1)
j , . . . , x
(cqk)
j .
4: Compute functiony(jq)=g1(•).
5: end for
6: return y(q)
3.2 Macro Collaborative Ranking(MaCR)
Macro collaborative ranking is characterized by in-tegrating joint strengths from multiple rankers. It is based on the following assumptions:
• Independence: Each ranker can make its own
ranking decisions.
•Diversity: Each ranker has its own strengths in making ranking decisions.
•Collaboration: Rankers in the group could col-laborate to make a consensus decision under some mechanism.
Letx(jq)=φ(q, o(jq))be the feature vector formed from the pair consisting of queryqand an associated
objecto(jq). LetF∗ = {f1, . . . , fm}be m existing
ranking functions. We transform the computation of collaboration among rankers into solving the follow-ing composite functiong2:
yj(q)=g2(f1
(
x(jq)), . . . , fm (
x(jq))) (3)
Similar with MiCR,g2can be expressed by max,
min, weighted (average) respectively: •max: y(jq)=max{fi
( x(jq)
)
}m i=1
•min: y(jq)=min{fi
(
x(jq))}m i=1
•weighted: yj(q)= m
∑
i=1
wifi
( x(jq)
)
It is worth noting that max and min can be use-ful only if the ranking scores produced by various rankers can be compared to each other directly, how-ever, in practice, this can hardly be true.
A special form of ranking problem is that only the best object is required as output. In this case, we have another version ofg2which is called voting:
•voting: y(jq)=
m
∑
i=1
sign(fi
( x(jq)))
in whichsign(•)is an indicator function
sign(•) = {
1 iffioutputso(jq)as the best object
0 otherwise
A general algorithm for MaCR is presented in Al-gorithm 2.
Algorithm 2MaCR Algorithm.
Input:
a queryq; a set of objectso(q); a set ofm
rank-ing functionsF∗; a composite functiong 2 Output:
a set of ranking scoresy(q)
1: forj= 1;j <=n(q);j+ + do 2: Form a feature vectorx(jq).
3: Compute ranking scores:f1(x(jq)), . . . , fm(x(jq)).
4: Compute composite function:y(jq)=g2(•).
5: end for
6: return y(q)
3.3 Micro-Macro Collaborative Ranking (MiMaCR)
The above two ranking approaches can be further integrated into a joint model which is named Micro-Macro Collaborative Ranking (MiMaCR). In order to compute query-level and ranker-level collabora-tion jointly, we solve the following complex com-posite functiong3:
y(jq) =g2(g1(•)) (4)
in which, for each objecto(jq), firstly we computem
m
g1(f1
( x(jq)
) , f1
( x(jcq1)
) , . . . , f1
( x(jcqk)
) )
. . . .
g1(fm
( x(jq)
) , fm
( x(jcq1)
)
, . . . , fm
( x(jcqk)
) )
and secondly, we compute a macro-ranking score usingg2.
We can similarly define g1 and g2 as those in
MiCR and MaCR. A general algorithm for MiMaCR is presented in Algorithm 3.
Algorithm 3MiMaCR Algorithm.
Input:
a queryq; a set of objectso(q); a set of ranking
functionsF∗; functionsg1, g2 Output:
a set of ranking scoresy(q)
1: Searchkcollaborators ofq: cq(q)={cq
1, . . . , cqk}.
2: forj = 1;j <=n(q);j+ + do 3: Formk+ 1feature vectors:x(jq), x(cq1)
j , . . . , x
(cqk)
j .
4: Computemmicro-ranking scores usingF∗andg1. 5: Compute the macro-ranking score usingg2.
6: end for
7: return y(q)
4 A Case Study on Entity Linking
To demonstrate the efficacy of our collaborative ranking scheme, we apply it to the entity linking task defined in the TAC-KBP2010 program (Ji et al., 2010) because there is a large amount of train-ing and evaluation data available and various non-collaborative ranking approaches have been pro-posed, as summarized in (McNamee and Dang, 2009; Ji et al., 2010).
4.1 Task Definition
The entity linking task aims to align a textual men-tion of a named entity (person,organizamen-tion or geo-political) to an appropriate entry in a knowledge base (KB), which may or may not contain the en-tity. More formally, given a large corpusC, letq =
(q.id, q.string, q.text) denote a query in the task
which is a triple consisting of query id (q.id), name
string (q.string) and context document (q.text ∈
C). Leto(q) = {o(1q), . . . , o(q)
n(q) }
denote the candi-date KB entries associated with the query. Each KB entry is a tuple consisting of KB id, KB title, KB
in-fobox (a set of attribute-value pairs that summarize or highlight the key features of the concept or sub-ject of this entry) and KB text. The goal is to rank the KB entries and determine whether the top en-try id should be considered as the answer, otherwise NIL should be returned.
A specific example of the task is as follows, given a name string “Michael Jordan” and its con-text document “...England Youth International goal-keeper Michael Jordan...”. From the name string, we retrieve a set of candidate KB entries includ-ing “Michael Jordan (mycologist)”, “Michael Jor-dan (footballer)”, etc. The entity linking system should return the id of “Michael Jordan (footballer)” as the answer, rather than the id of “Michael Jordan” who is most well known as a basketball player.
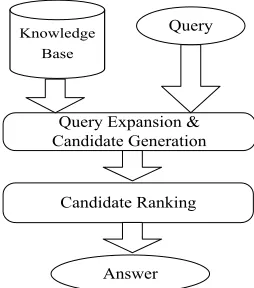
4.2 General Framework
A general framework of entity linking consists of two crucial components, one for candidate gener-ation, the other for candidate ranking, as shown in Figure 2. In this paper, we developed the first component by following the procedures described in (Chen et al., 2010) which extensively leveraged resources mined from Wikipedia. The performance of the first component is 96.8% measured by recall (the percentage of queries in which the candidates cover the true answer). We then focus on the second component.
Knowledge Base
Query Expansion & Candidate Generation
Candidate Ranking
[image:5.612.362.489.478.622.2]Answer Query
Figure 2: A general framework of entity linking sys-tem.
4.3 Baseline Rankers
We developed 8 baseline rankers, including 4 un-supervised rankers (f1, f2, f3, f4) and 4 supervised
•Naive (f1): since the answer for each query can
either be a KB id or NIL, the naive ranker simply outputs NIL for all queries.
•Entity (f2): f2 is defined as weighted
combina-tion of entity similarities in three types (person, or-ganization and geo-political). Name entities are ex-tracted fromq.text and KB text respectively using
Stanford NER toolkit3. The formulas to compute en-tity similarities are defined in (Yoshida et al., 2010). •Tfidf (f3): f3 is defined as cosine similarity
be-tweenq.textand KB text using tfidf weights.
•Profile (f4): f4 is defined as profile similarity
between q.text and KB text (Chen et al., 2010).
We used a slot filling toolkit (Chen et al., 2011) to generate the profile (attribute-value pairs) for each query.
•Maxent (f5): a pointwise ranker implemented
using OpenNLP Maxent toolkit4 which is based on maximum entropy model.
•SVM (f6): a pointwise ranker implemented
us-ingSV Mlight (Joachims, 1999).
•SVM ranking (f7): a pairwise ranker
imple-mented usingSV Mrank (Joachims, 2006).
•ListNet (f8): a listwise ranker presented in (Cao
et al., 2007).
The four supervised rankers apply exactly the same set of features except that SVM ranking (f7)
needs to double expand the feature vector. The tures are categorized into three levels, surface fea-tures (Dredze et al., 2010; Zheng et al., 2010), doc-ument features (Dredze et al., 2010; Zheng et al., 2010), and profiling features (entity slots that are ex-tracted by the slot filling toolkit (Chen et al., 2011)).
4.4 MiCR for Entity Linking
We convert the collaborator searching problem into a clustering problem, i.e., for a given queryq in the
task, we retrieve at mostK = 300documents from the large corpusC, each of which containsq.string;
we then apply a clustering algorithm to generate clusters over the documents, and form query collab-orators (excludingq.text) from the cluster that
con-tainsq.text.
We experimented the following two clustering ap-proaches:
3http://nlp.stanford.edu/software/CRF-NER.shtml 4http://maxent.sourceforge.net/about.html
(1)agglomerative clustering: it iteratively merges clusters from singleton documents until a stop threshold is reached. Document similarity is de-fined as cosine similarity using tfidf weights. We ap-plied group-average linking strategy to merge clus-ters (Manning et al., 2008).
(2)graph-based clustering: it iteratively partitions clusters from one single cluster until a stop threshold is reached. Document similarity is similarly defined as agglomerative clustering. We selected normalized spectral clustering as our clustering algorithm (Shi and Malik, 2000).
We first selected f3 as our basic ranking
func-tion, and investigated whether the ranker can ben-efit from query collaborators formed by either ag-glomerative clustering or graph clustering. We im-plemented three versions of composite functiong1
(max,minandaverage), and experimented their per-formance using three unsupervised rankersf2, f3, f4
respectively.
Last, we implemented three supervised versions of g1 (Maxent, SVM and ListNet respectively) by
adding cluster-level features and retraining the mod-els in three supervised rankers f5, f6, f8
respec-tively. Cluster-level features include maximum, minimum, average tfidf/entity similarities between the candidate and the query collaboration group.
4.5 MaCR for Entity Linking
We implemented two versions of composite func-tion g2, average and voting. Furthermore, we
in-vestigated how the performance can be affected by incrementally adding more rankers into the ranker set F∗. To do so, we first sorted the 8 rankers ac-cording to their performance on thedevelopmentset from the highest to the lowest, and starting with the highest performance ranker, we added one ranker at a time, until we have all the 8 rankers. It is worth noting that, when there are even number of rankers in the setF∗, “ties” could take place using voting function. In order to break the ties, we rank the candidate higher if it is output as the answer from a higher performance ranker.
4.6 MiMaCR for Entity Linking
5 Experiments
5.1 Data and Evaluation Metric
We used TAC-KBP2009 evaluation data as our train-ing (75%) and development set (25%), and used TAC-KBP2010 evaluation data as our blind testing set (shown in Table 2).
Corpus Queries
PER ORG GPE Total
Training&Dev 627 2710 567 3904
Testing 750 750 750 2250
Table 2: Training, development and testing corpus. The reference KB consists of 818,741 entries which are extracted from an October 2008 dump of English Wikipedia. The source text corpus (denoted asCin section 4.1) consists of 1,777,888 documents in 5 genres (mostly Newswire and Web Text).
We used the official evaluation metric for TAC-KBP2010 entity linking task, that is, micro-averaged accuracy. It is computed by
micro-averaged accuracy=#correct answers #queries
An answer is considered as correct if the system output (either a KB entry id or NIL) exactly matches the key.
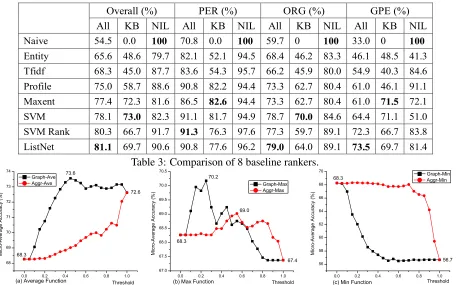
5.2 Performance of 8 Baseline Rankers
Table 3 shows the performance of the 8 baseline rankers in 4 columns: Overallfor all queries, PER
for person queries, ORG for organization queries,
and GPE for geo-political queries. Each column
is further split into All, KB (for Non-NIL queries) andNIL(for NIL queries). It shows that all the four supervised rankers perform better than the four un-supervised rankers. Naive ranker obtains the low-est overall micro-average accuracy (54.5%) but the highest NIL accuracy (100%). Among the four un-supervised rankers,profileranker performs the best, which clearly shows that the extracted attributes of entities are effective for disambiguating confusable names. For example, our data analysis shows that the attribute value of “per:alternative-name” from the context document is particularly useful if a per-son query is only mentioned by its last name. The attribute “per:title” is another important indicator to discriminate one person from the other. For
geo-political queries, if the query is a city name, at-tribute “gpe:state” is useful to distinguish cities with the same name but in different states or provinces. Among the four supervised rankers, ListNet forms SVM ranking and then SVM ranking outper-forms the two pointwise rankers. It may confirm previous research findings that listwise ranking is superior to pairwise ranking and pairwise ranking is superior to pointwise ranking (Cao et al., 2007; Zheng et al., 2010). The best baseline ranker (List-Net) obtains an absolute overall accuracy gain of 26.6% over the naive ranker.
5.3 Impact of MiCR
To study the impact of MiCR, we first select f3
(tfidf ranker) as our ranking function. Figure 3 shows the performance of applying different query collaborator searching strategies (graph or agglom-erative clustering) and different versions of g1
(av-erage, max and min respectively). We intention-ally adjust the meaning of threshold (x-axis) for both graph clustering and agglomerative clustering, such that at threshold 0, both clustering algorithms gen-erate the largest number of clusters (i.e., each doc-ument is a cluster), and at threshold 1, they gen-erate only one cluster. We now take the average
Overall (%) PER (%) ORG (%) GPE (%) All KB NIL All KB NIL All KB NIL All KB NIL
Naive 54.5 0.0 100 70.8 0.0 100 59.7 0 100 33.0 0 100
Entity 65.6 48.6 79.7 82.1 52.1 94.5 68.4 46.2 83.3 46.1 48.5 41.3
Tfidf 68.3 45.0 87.7 83.6 54.3 95.7 66.2 45.9 80.0 54.9 40.3 84.6
Profile 75.0 58.7 88.6 90.8 82.2 94.4 73.3 62.7 80.4 61.0 46.1 91.1
Maxent 77.4 72.3 81.6 86.5 82.6 94.4 73.3 62.7 80.4 61.0 71.5 72.1
SVM 78.1 73.0 82.3 91.1 81.7 94.9 78.7 70.0 84.6 64.4 71.1 51.0
SVM Rank 80.3 66.7 91.7 91.3 76.3 97.6 77.3 59.7 89.1 72.3 66.7 83.8
[image:8.612.81.537.71.356.2]ListNet 81.1 69.7 90.6 90.8 77.6 96.2 79.0 64.0 89.1 73.5 69.7 81.4
Table 3: Comparison of 8 baseline rankers.
0.0 0.2 0.4 0.6 0.8 1.0 68
69 70 71 72 73 74
0.0 0.2 0.4 0.6 0.8 1.0 67.0
67.5 68.0 68.5 69.0 69.5 70.0 70.5
0.0 0.2 0.4 0.6 0.8 1.0 56
58 60 62 64 66 68 70
(c) Min Function (b) Max Function
(a) Average Function
M
ic
ro
-A
v
e
ra
g
e
A
c
c
u
ra
c
y
(
%
)
Threshold Graph-Ave
Aggr-Ave 73.6
72.6
68.3
67.4 70.2
68.3
Threshold
M
ic
ro
-A
v
e
ra
g
e
A
c
c
u
ra
c
y
(
%
)
Graph-Max Aggr-Max
69.0
56.7 68.3
Threshold
M
ic
ro
-A
v
e
ra
g
e
A
c
c
u
ra
c
y
(
%
)
Graph-Min Aggr-Min
Figure 3: MiCR: comparison of average, max, and min functions combined with Graph and Agglomerative (Aggr)-based query collaborator searching strategies (tfidf ranker).
The max function (Figure 3 (b)) leverages the strengths from the strongest collaborator in the group, which can potentially improve KB accuracy, but meanwhile hurt NIL accuracy. As shown in the figure, as more collaborators join in the group, the performance increases first for both graph and ag-glomerative clustering, however, it starts to deterio-rate when arriving at a threshold, and in the end, the performance drops even lower than the baseline of tfidf ranker.
The min function (Figure 3 (c)) leverages the strengths from the weakest collaborator in the group, which can potentially improve NIL accuracy, but meanwhile hurt KB accuracy. Our data analysis shows that the gain in NIL accuracy can not afford the larger loss in non-NIL accuracy, therefore, the performance continues dropping as the threshold in-creases. Min function is a counter example showing that searching query collaborators can not always lead to benefits.
To summarize so far, the best strategy for tfidf
ranker in MiCR approach is graph-ave (applying
graph clustering and using average function) which obtains overall accuracy gain of 5.3% over the
base-line (68.3%). We further validate the performance ofgraph-aveusingf2, f4ranking functions, for
en-tityranker, we obtain accuracy gain of 6.3%, and for
profileranker, we obtain accuracy gain of 3.0%. We then experiment the three supervisedg1
func-tions (ListNet, Maxent, and SVM respectively) using graph clustering as the query collaborator searching strategy. Figure 6 shows that ListNet, Maxent, SVM rankers obtain accuracy gain of 1.4%, 4.6%, 4.2% respectively over the baselines (corre-sponding to those points at threshold 0).
5.4 Impact of MaCR
Figure 4 shows that the MaCR approach obtains absolute accuracy gain of 1.3% (voting function) and 0.5% (average function) over the best baseline ranker (81.1%) when we add the 7th ranker (entity
when there are even number of rankers in the ranker set using voting function, which implies that our tie breaking strategy is not very effective.
We also experimented thevotingfunction on the top 10 KBP2009 entity linking systems (each sys-tem performance is shown in the table embedded in Figure 5, and experiment is similarly done as de-scribed in section 4.5). Figure 5 shows that it can obtain absolute accuracy gain of 4.7% over the top entity linking system (82.2%). The reasons why we achieve relative smaller gains using our own ranker set are as follows: (1) we use the same candidate object set for all rankers, while different KBP2009 systems may use their own set of objects. (2) our top 4 supervised rankers apply almost the same set of features, while different KBP2009 systems may apply more diversified features. Therefore, diversity is a highly important factor that makes MaCR ap-proach effective.
0 1 2 3 4 5 6 7 8 9
[image:9.612.338.510.265.370.2]80.8 81.0 81.2 81.4 81.6 81.8 82.0 82.2 82.4 82.6 81.1 81.6 81.6 81.4 81.2 81.0 80.8 81.7 82.4 81.8 82.2 81.1 81.3 81.7 M ic ro -A v e ra g e A cc u ra c y (% ) #rankers voting average 81.2
Figure 4: MaCR: comparison of voting and average.
0 1 2 3 4 5 6 7 8 9 10 11 82 83 84 85 86 87 83.7 84.6 85 85.9 86.4 85.8 85.1 82.2 M ic ro -A ve ra g e A cc u ra cy ( % ) #systems (rankers)
System ID Performance 1 82.2 2 80.3 3 79.8 4 78.8 5 76.7 6 73.5 7 71.1 8 68.2 9 65.9 10 59.6 82.2 86.9
Figure 5: MaCR: applying voting function to the top 10 KBP2009 entity linking systems.
5.5 Impact of MiMaCR
We applied the following settings in our Mi-MaCR approach: selecting graph clustering as the query collaborator searching strategy, including five rankers (tfidf, entity, Maxent, SVM and ListNet) in the ranker set, using average function to compute micro-ranking scores for the tfidf and entity ranker, using the three corresponding supervised versions
ofg1 to compute micro-ranking scores for Maxent,
SVM and ListNet respectively, and finally apply-ing voting function to compute the macro-ranking score. In Figure 6, the curve of “MiMaCR” shows how the performance of MiMaCR is affected by the threshold in graph clustering. We obtain the best micro-average accuracy of 83.7% at threshold 0.3, which is 2.6 % higher than the best baseline ranker (81.1%). The improvement is statistically significant at a 98.6% confidence level by conduct-ing Wilcoxon Matched-Pairs Signed-Ranks Test on the 10 folds of the testing set. The score reported here is on par with the second best in the KBP2010 evaluation.
0.0 0.2 0.4 0.6 0.8 1.0
77.0 77.5 78.0 78.5 79.0 79.5 80.0 80.5 81.0 81.5 82.0 82.5 83.0 83.5 84.0 82.0 82.3 82.5 77.4 81.1 78.1 M ic ro -A ve ra g e A cc u ra cy ( % ) Threshold MiMaCR ListNet Maxent SVM 83.7 82.3
Figure 6: MiMaCR: Comparison of MiMaCR and three supervised versions of g1 (ListNet, Maxent,
and SVM respectively). 6 Related Work
In the literature of information retrieval, query ex-pansion is a useful technique that involves the pro-cess of reformulating a query, and as a consequence, is capable to extend the ability of a query and im-prove the retrieval performance. Various approaches for query expansion have been proposed, as summa-rized in (Manning et al., 2008). The MiCR presented in this paper is superior to query expansion in two aspects, firstly, we leverage more information con-tained in multiple query collaborators; secondly, we place great emphasis on interactions among mem-bers in the query collaboration group.
[image:9.612.70.300.334.579.2]ranking, we extend it to MiMaCR which integrates the strengths from both MiCR and MaCR.
It is worth noting that “collaborative ranking” pre-sented here should be distinguished from “collabo-rative filtering” in that “collabo“collabo-rative filtering” uses the known preferences of a group of users to gen-erate personalized recommendations while “collab-orative ranking” leverages query collaborators and ranker collaborators to enhance the overall ranking performance.
There has been an increasing amount of research on entity linking, especially through KBP2009 and KBP2010. Various unsupervised or supervised ap-proaches have been proposed, as summarized in (McNamee and Dang, 2009; Ji et al., 2010). How-ever, most of the previous research mainly fo-cused on one or two ranking algorithms on isolated queries. In this paper, we have extended the work by systematically studying the possibility of perfor-mance enhancement through query-level collabora-tion and ranker-level collaboracollabora-tion.
7 Conclusions
We presented a new ranking scheme called collab-orative ranking with three specific forms, MiCR, MaCR and MiMaCR and demonstrated its effective-ness on entity linking task. However, our scheme is not restricted to this specific task and it is generally applicable to many other other applications such as question answering. In MiCR, effective searching of query collaborators and active interplay among members in the query collaboration group are two key factors that make MiCR successful. In MaCR, diversity is a highly important factor to make it suc-cessful. Overall, MiMaCR can bootstrap the per-formance to its maximum if integrating MiCR and MaCR properly. However, the better performance is at the expense of much more computations.
Acknowledgments
This work was supported by the U.S. Army Re-search Laboratory under Cooperative Agreement Number W911NF-09-2-0053, the U.S. NSF CA-REER Award under Grant IIS-0953149 and PSC-CUNY Research Program. The views and con-clusions contained in this document are those of the authors and should not be interpreted as repre-senting the official policies, either expressed or
im-plied, of the Army Research Laboratory or the U.S. Government. The U.S. Government is authorized to reproduce and distribute reprints for Govern-ment purposes notwithstanding any copyright nota-tion hereon.
References
P. L. Bartlett, M. I. Jordan and J. D. McAuliffe. 2003. Convexity, classification, and risk bounds. Technical Report 638, Statistics Department, University of Cali-fornia, Berkeley.
C. Burges, T. Shaked, E. Renshaw, A. Lazier, M. Deeds, N. Hamilton, and G. Hullender. 2005. Learning to Rank Using Gradient Descent. InProceedings of the 22th International Conference on Machine Learning (ICML 2005).
Z. Cao, T. Qin, T.-Y. Liu, M.-F. Tsai and H. Li. 2007. Learning to rank: from pairwise approach to listwise approach In Proceedings of the 24th International Conference on Machine Learning (ICML 2007), pages 129-136.
E. Charniak and M. Johnson. 2005. Coarseto-fine-grained n-best parsing and discriminative reranking. InACL-05, pages 173-180.
W. Chen, T.-Y. Liu, Y. Lan, Z. Ma, and H. Li. 2009. Ranking measures and loss functions in learning to rank. InAdvances in Neural Information Processing Systems 22 (NIPS 2009), pages 315-323.
Z. Chen, S. Tamang, A. Lee, X. Li, W.-P. Lin, M. Snover, J. Artiles, M. Passantino and H. Ji. 2010. CUN-YBLENDER TAC-KBP2010 Entity Linking and Slot Filling System Description. InProceedings of Text An-alytics Conference (TAC2010).
Z. Chen, S. Tamang, A. Lee and H. Ji. 2011. A Toolkit for Knowledge Base Population. InSIGIR.
M. Collins. 2000. Discriminative reranking for natural language parsing. InProceedings of the 17th Interna-tional Conference on Machine Learning (ICML 2000), pages 175-182.
M. Dredze, P. McNamee, D. Rao, A. Gerber and T. Finin. 2010. Entity Disambiguation for Knowledge Base Population. InProc. COLING 2010.
Y. Freund, R. Iyer, R. Schapire, and Y. Singer. 2003. An efficient boosting algorithm for combining pref-erences. In Journal of Machine Learning Research, 4:933-969.
S. Hoi and R. Jin. 2008. Semi-supervised ensemble ranking. InProc. of the 23rd AAAI Conf. on Artificial Intelligence.
H. Ji, R. Grishman, H. T. Dang and K. Griffit. 2010. An Overview of the TAC2010 Knowledge Base Popula-tion Track. InProceedings of Text Analytics Confer-ence (TAC2010).
T. Joachims. 1999. Making large-Scale SVM Learn-ing Practical. Advances in Kernel Methods - Support Vector Learning, B. Sch¨olkopf and C. Burges and A. Smola (ed.), MIT-Press, 1999.
T. Joachims. 2002. Optimizing search engines us-ing clickthrough data. In Proceedings of the 8th ACM SIGKDD International Conference on Knowl-edge Discovery and Data Mining(KDD 2002). T. Joachims. 2006. Training Linear SVMs in Linear
Time. In Proceedings of the ACM Conference on Knowledge Discovery and Data Mining (KDD). Y. Lan, T.-Y. Liu, T. Qin, Z. Ma, and H. Li. 2008.
Query-level stability and generalization in learning to rank. In Proceedings of the 25th International Conference on Machine Learning (ICML 2008), pages 512-519. P. Li, C. Burges, and Q. Wu. 2007. Mcrank:
Learn-ing to rank usLearn-ing multiple classification and gradient boosting InAdvances in Neural Information Process-ing Systems 20 (NIPS2007).
Y. Lin. 2002. Support vector machines and the bayes rule in classification. InData Mining and Knowledge Discovery, pages 259-275.
C. D. Manning, P. Raghavan and H. Sch¨utze. 2008 . In-troduction to Information Retrieval. Cambridge Uni-versity Press.
P. McNamee and H. Dang. 2009. Overview of the TAC 2009 Knowledge Base Population Track. In Proceed-ings of TAC.
R. Nallapati. 2004. Discriminative models for informa-tion retrieval. InSIGIR.
F. J. Och. 2002. Statistical Machine Translation: From Single-Word Models to Alignment Templates. Ph.D. thesis, Computer Science Department, RWTH Aachen, Germany, October.
L. Page, S. Brin, R. Motwani, and T. Winograd. 1998. The PageRank Citation Ranking: Bringing Order to the Web. Technical report, Stanford Digital Library Technologies Project.
T. Qin, X.-D. Zhang, M.-F. Tsai, D.-S. Wang, T.-Y. Liu and H. Li. 2007. Query-level loss functions for infor-mation retrieval. InInformation Processing and Man-agement.
T. Qin, T.-Y. Liu, X.-D. Zhang,D.-S. Wang, and H. Li. 2008. Global Ranking Using Continuous Conditional Random Fields. In Advances in Neural Information Processing Systems 21 (NIPS 2008).
D. Ravichandran, E. Hovy and F. J. Och. 2003. Statis-tical QA - Classifier vs. Re-ranker: What’s the differ-ence? InProceedings of the ACL Workshop on Multi-lingual Summarization and Question Answering.
S. Riezler, A. Vasserman, I. Tsochantaridis, V. Mittal and Y. Liu. 2007. Statistical Machine Translation for Query Expansion in Answer Retrieval. InProceedings of ACL.
L. Rokach. 2009. Ensemble-based classifiers. Artif In-tell Rev DOI 10.1007/s10462-009-9124-7.
L. Shen, A. Sarkar, and F. J. Och. 2005. Discriminative reranking for machine translation. InProceedings of HLT-NAACL.
J. Shi and J. Malik. 2000. Normalized Cuts and Image Segmentation. InMachine Intelligence, vol. 22, no. 8, pages 888-905.
F. Wei, W. Li and S. Liu. 2010. iRANK: A learn-combine framework for unsupervised ensemble rank-ing. In Journal of the American Society for Infor-mation Science and Technology,61: 1232C1243. doi: 10.1002/asi.21296.
X. Yang and J. Su and C.L. Tan 2008. A Twin-Candidate Model for Learning-based Anaphora Resolution. In Computational Linguistics, vol. 34, no. 3, pages 327-356.
M. Yoshida, M. Ikeda, S. Ono, I. Sato, and H. Nakagawa. 2010. Person name disambiguation by boostrapping. InSIGIR.
T. Zhang. 2004. Statistical analysis of some multicate-gory large margin classification methods. InJournal of Machine Learning Research, 5, 1225-1251. W. Zhang, J. Su, C. L. Tan and W.T. Wang. 2010. Entity
Linking Leveraging Automatically Generated Annota-tion. InProc. COLING 2010.