Automatically Evaluating Content Selection in Summarization without
Human Models
Annie Louis
University of Pennsylvania
Ani Nenkova University of Pennsylvania
Abstract
We present a fully automatic method for content selection evaluation in summariza-tion that does not require the creasummariza-tion of human model summaries. Our work capi-talizes on the assumption that the distribu-tion of words in the input and an informa-tive summary of that input should be sim-ilar to each other. Results on a large scale evaluation from the Text Analysis Con-ference show that input-summary compar-isons are very effective for the evaluation of content selection. Our automatic meth-ods rank participating systems similarly to manual model-based pyramid evalua-tion and to manual human judgments of responsiveness. The best feature, Jensen-Shannon divergence, leads to a correlation as high as 0.88 with manual pyramid and 0.73 with responsiveness evaluations.
1 Introduction
The most commonly used evaluation method for summarization during system development and for reporting results in publications is the auto-matic evaluation metric ROUGE (Lin, 2004; Lin and Hovy, 2003). ROUGE compares system sum-maries against one or more model sumsum-maries by computing n-gram word overlaps between the two. The wide adoption of such automatic mea-sures is understandable because they are conve-nient and greatly reduce the complexity of eval-uations. ROUGE scores also correlate well with manual evaluations of content based on compar-ison with a single model summary, as used in the early editions of the Document Understanding Conferences (Over et al., 2007).
In our work, we take the idea of automatic evaluation to an extreme and explore the feasi-bility of developing a fully automatic evaluation
method for content selection that does not make use of human model summaries at all. To this end, we show that evaluating summaries by comparing them with the input obtains good correlations with manual evaluations for both query focused and up-date summarization tasks.
Our results have important implications for fu-ture development of summarization systems and their evaluation.
High correlations between system ranking pro-duced with the fully automatic method and manual evaluations show that the new eval-uation measures can be used during system development when human model summaries are not available.
Our results provide validation of several features that can be optimized in the development of new summarization systems when the objec-tive is to improve content selection on aver-age, over a collection of test inputs. However, none of the features is consistently predictive of good summary content for individual
in-puts.
We find that content selection performance on standard test collections can be approximated well by the proposed fully automatic method. This result greatly underlines the need to re-quire linguistic quality evaluations alongside content selection ones in future evaluations and research.
2 Model-free methods for evaluation
Proposals for developing fully automatic methods for summary evaluation have been put forward in the past. Their attractiveness is obvious for large scale evaluations, or for evaluation on non-standard test sets for which human models are not available.
For example in Radev et al. (2003), a large scale fully automatic evaluation of eight summa-rization systems on 18,000 documents was per-formed without any human effort. A search engine was used to rank documents according to their rel-evance to a given query. The summaries for each document were also ranked for relevance with re-spect to the same query. For good summariza-tion systems, the relevance ranking of summaries is expected to be similar to that of the full docu-ments. Based on this intuition, the correlation be-tween relevance rankings of summaries and orig-inal documents was used to compare the different systems. The approach was motivated by the as-sumption that the distribution of terms in a good summary is similar to the distribution of terms in the original document.
Even earlier, Donaway et al. (2000) suggested that there are considerable benefits to be had in adopting model-free methods of evaluation involv-ing direct comparisons between the original docu-ment and its summary. The motivation for their work was the considerable variation in content se-lection choices in model summaries (Rath et al., 1961). The identity of the model writer signifi-cantly affects summary evaluations (also noted by McKeown et al. (2001), Jing et al. (1998)) and evaluations of the same systems can be rather dif-ferent when difdif-ferent models are used. In their experiments, Donaway et al. (2000) demonstrated that the correlations between manual evaluation using a model summary and
a) manual evaluation using a different model summary
b) automatic evaluation by directly comparing input and summary1,
are the same. Their conclusion was that such au-tomatic methods should be seriously considered as an alternative to model based evaluation.
In this paper, we present a comprehensive study of fully automatic summary evaluation without any human models. A summary’s content is judged for quality by directly estimating its close-ness to the input. We compare several probabilistic and information-theoretic approaches for charac-terizing the similarity and differences between in-put and summary content. A simple information-theoretic measure, Jensen Shannon divergence be-tween input and summary, emerges as the best
fea-1They used cosine similarity to perform the input-summary comparison.
ture. System rankings produced using this mea-sure lead to correlations as high as 0.88 with hu-man judgements.
3 TAC summarization track
3.1 Query-focused and Update Summaries
Two types of summaries, query-focused and up-date summaries, were evaluated in the summariza-tion track of the 2008 Text Analysis Conference (TAC)2. Query-focused summaries were produced from input documents in response to a stated user information need. The update summaries require more sophistication: two sets of articles on the same topic are provided. The first set of articles represents the background of a story and users are assumed to be already familiar with the informa-tion contained in them. The update task is to pro-duce a multi-document summary from the second set of articles that can serve as an update to the user. This task is reminiscent of the novelty de-tection task explored at TREC (Soboroff and Har-man, 2005).
3.2 Data
The test set for the TAC 2008 summarization task contains 48 inputs. Each input consists of two sets of 10 documents each, called docsets A and B. BothA and B are on the same general topic but B contains documents published later than those inA. In addition, the user’s information need as-sociated with each input is given by a query state-ment consisting of a title and narrative. An exam-ple query statement is shown below.
Title: Airbus A380
Narrative: Describe developments in the pro-duction and launch of the Airbus A380.
A system must produce two summaries: (1) a query-focused summary of docsetA, (2) a compi-lation of updates from docsetB, assuming that the user has read all the documents in A. The max-imum length for both types of summaries is 100 words.
There were 57 participating systems in TAC 2008. We use the summaries and evaluations of these systems for the experiments reported in the paper.
3.3 Evaluation metrics
Both manual and automatic evaluations were con-ducted at NIST to assess the quality of summaries
2
manual score R-1 recall R-2 recall Query Focused summaries
pyramid score 0.859 0.905 responsiveness 0.806 0.873
Update summaries
[image:3.595.103.261.70.132.2]pyramid score 0.912 0.941 responsiveness 0.865 0.884
Table 1: Spearman correlation between manual scores and ROUGE-1 and ROUGE-2 recall. All correlations are highly significant with p-value < 0.00001.
produced by the systems.
Pyramid evaluation: The pyramid evaluation method (Nenkova and Passonneau, 2004) has been developed for reliable and diagnostic assessment of content selection quality in summarization and has been used in several large scale evaluations (Nenkova et al., 2007). It uses multiple human models from which annotators identify seman-tically defined Summary Content Units (SCU). Each SCU is assigned a weight equal to the number of human model summaries that express that SCU. An ideal maximally informative sum-mary would express a subset of the most highly weighted SCUs, with multiple maximally infor-mative summaries being possible. The pyramid score for a system summary is equal to the ratio between the sum of weights of SCUs expressed in a summary (again identified manually) and the sum of weights of an ideal summary with the same number of SCUs.
Four human summaries provided by NIST for each input and task were used for the pyramid evaluation at TAC.
Responsiveness evaluation: Responsiveness of a
summary is a measure of overall quality combin-ing both content selection and lcombin-inguistic quality: summaries must present useful content in a struc-tured fashion in order to better satisfy the user’s need. Assessors directly assigned scores on a scale of 1 (poor summary) to 5 (very good sum-mary) to each summary. These assessments are done without reference to any model summaries. The (Spearman) correlation between the pyramid and responsiveness metrics is high but not perfect: 0.88 and 0.92 respectively for query focused and update summarization.
ROUGE evaluation: NIST also evaluated the
summaries automatically using ROUGE (Lin, 2004; Lin and Hovy, 2003). Comparison between a summary and the set of four model summaries
is computed using unigram (R1) and bigram over-laps (R2)3. The correlations between ROUGE and manual evaluations is shown in Table 1 and varies between 0.80 and 0.94.
Linguistic quality evaluation: Assessors scored
summaries on a scale from 1 (very poor) to 5 (very good) for five factors of linguistic quality: gram-maticality, non-redundancy, referential clarity, fo-cus, structure and coherence.
We do not make use of any of the linguistic quality evaluations. Our work focuses on fully au-tomatic evaluation of content selection, so man-ual pyramid and responsiveness scores are used for comparison with our automatic method. The pyramid metric measures content selection exclu-sively, while responsiveness incorporates at least some aspects of linguistic quality.
4 Features for content evaluation
We describe three classes of features to compare input and summary content: distributional simi-larity, summary likelihood and use of topic signa-tures. Both input and summary words were stop-word filtered and stemmed before computing the features.
4.1 Distributional Similarity
Measures of similarity between two probability distributions are a natural choice for the task at hand. One would expect good summaries to be characterized by low divergence between proba-bility distributions of words in the input and sum-mary, and by high similarity with the input.
We experimented with three common measures: KL and Jensen Shannon divergence and cosine similarity. These three metrics have already been applied for summary evaluation, albeit in differ-ent contexts. In Lin et al. (2006), KL and JS di-vergences between human and machine summary distributions were used to evaluate content selec-tion. The study found that JS divergence always outperformed KL divergence. Moreover, the per-formance of JS divergence was better than stan-dard ROUGE scores for multi-document summa-rization when multiple human models were used for the comparison.
The use of cosine similarity in Donaway et al. (2000) is more directly related to our work. They show that the difference between evaluations
based on two different human models is about the same as the difference between system ranking based on one model summary and the ranking pro-duced using input-summary similarity. Inputs and summaries were compared using only one metric: cosine similarity.
Kullback Leibler (KL) divergence: The KL
di-vergence between two probability distributions P andQis given by
D(P||Q) =X
w
pP(w) log2ppP(w)
Q(w) (1)
It is defined as the average number of bits wasted by coding samples belonging toP using another distribution Q, an approximate ofP. In our case, the two distributions are those for words in the input and summary respectively. Since KL di-vergence is not symmetric, both input-summary and summary-input divergences are used as fea-tures. In addition, the divergence is undefined when pP(w) > 0 but pQ(w) = 0. We perform simple smoothing to overcome the problem.
p(w) = NC++δ∗δB (2)
Here C is the count of word w and N is the number of tokens; B = 1.5|V|, where V is the input vocabulary and δ was set to a small value of 0.0005 to avoid shifting too much probability mass to unseen events.
Jensen Shannon (JS) divergence: The JS
diver-gence incorporates the idea that the distance be-tween two distributions cannot be very different from the average of distances from their mean dis-tribution. It is formally defined as
J(P||Q) = 12[D(P||A) +D(Q||A)], (3)
where A = P+2Q is the mean distribution of P and Q. In contrast to KL divergence, the JS dis-tance is symmetric and always defined. We use both smoothed and unsmoothed versions of the di-vergence as features.
Similarity between input and summary: The
third metric is cosine overlap between thetf∗idf vector representations (with max-tf normalization) of input and summary contents.
cosθ=||vvinp.vsumm
inp||||vsumm|| (4)
We compute two variants:
1. Vectors contain all words from input and summary
2. Vectors contain only topic signatures from the input and all words of the summary
Topic signatures are words highly descriptive of the input, as determined by the application of log-likelihood test (Lin and Hovy, 2000). Using only topic signatures from the input to represent text is expected to be more accurate because the reduced vector has fewer dimensions compared with using all the words from the input.
4.2 Summary likelihood
The likelihood of a word appearing in the sum-mary is approximated as being equal to its proba-bility in the input. We compute both a summary’s unigram probability as well as its probability un-der a multinomial model.
Unigram summary probability:
(pinpw1)n1(pinpw2)n2...(pinpwr)nr (5)
where pinpwi is the probability in the input of word wi, ni is the number of times wi appears in the summary, andw1...wr are all words in the summary vocabulary.
Multinomial summary probability:
N!
n1!n2!...nr!(pinpw1) n1(p
inpw2)n2...(pinpwr)nr (6)
whereN =n1+n2+...+nris the total number of words in the summary.
4.3 Use of topic words in the summary
Summarization systems that directly optimize for more topic signatures during content selection have fared very well in evaluations (Conroy et al., 2006). Hence the number of topic signatures from the input present in a summary might be a good indicator of summary content quality. We experi-ment with two features that quantify the presence of topic signatures in a summary:
1. Fraction of the summary composed of input’s topic signatures.
2. Percentage of topic signatures from the input that also appear in the summary.
4.4 Feature combination using linear regression
We also evaluated the performance of a linear re-gression metric combining all of the above fea-tures. The value of the regression-based score for each summary was obtained using a leave-one-out approach. For a particular input and system-summary combination, the training set consisted only of examples which included neither the same input nor the same system. Hence during training, no examples of either the test input or system were seen.
5 Correlations with manual evaluations
In this section, we report the correlations between system ranking using our automatic features and the manual evaluations. We studied the predictive power of features in two scenarios.
MACRO LEVEL;PER SYSTEM: The values of fea-tures were computed for each summary submitted for evaluation. For each system, the feature values were averaged across all inputs. All participating systems were ranked based on the average value. Similarly, the average manual score, pyramid or responsiveness, was also computed for each sys-tem. The correlations between the two rankings are shown in Tables 2 and 4.
MICRO LEVEL; PER INPUT: The systems were ranked for each input separately, and correlations between the summary rankings for each input were computed (Table 3).
The two levels of analysis address different questions: Can we automatically identify sys-tem performance across all test inputs (macro level) and can we identify which summaries for a given input were good and which were bad (mi-cro level)? For the first task, the answer is a
defi-nite “yes” while for the second task the results are mixed.
In addition, we compare our results to model-based evaluations using ROUGE and analyze the effects of stemming the input and summary vo-cabularies. In order to allow for in-depth discus-sion, we will analyze our findings only for query focused summaries. Similar results were obtained for the evaluation of update summaries and are de-scribed in Section 7.
5.1 Performance at macro level
Table 2 shows the Spearman correlation between manual and automatic scores averaged across the
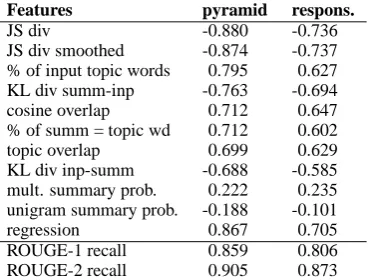
Features pyramid respons.
JS div -0.880 -0.736
[image:5.595.310.495.62.202.2]JS div smoothed -0.874 -0.737 % of input topic words 0.795 0.627 KL div summ-inp -0.763 -0.694 cosine overlap 0.712 0.647 % of summ = topic wd 0.712 0.602 topic overlap 0.699 0.629 KL div inp-summ -0.688 -0.585 mult. summary prob. 0.222 0.235 unigram summary prob. -0.188 -0.101 regression 0.867 0.705 ROUGE-1 recall 0.859 0.806 ROUGE-2 recall 0.905 0.873
Table 2: Spearman correlation on macro level for the query focused task. All results are highly sig-nificant with p-values<0.000001except unigram and multinomial summary probability, which are not significant even at the 0.05 level.
48 inputs. We find that both distributional simi-larity and the topic signature features produce sys-tem rankings very similar to those produced by hu-mans. Summary probabilities, on the other hand, turn out to be unpredictive of content selection performance. The linear regression combination of features obtains high correlations with manual scores but does not lead to better results than the single best feature: JS divergence.
JS divergence outperforms other features in-cluding the regression metric and obtains the best correlations with both types of manual scores, 0.88 with pyramid score and 0.74 with responsiveness. The regression metric performs comparably with correlations of 0.86 and 0.70. The correlations ob-tained by both JS divergence and the regression metric with pyramid evaluations are in fact better than that obtained by ROUGE-1 recall (0.85).
The best topic signature based feature— percentage of input’s topic signatures that are present in the summary—ranks next only to JS di-vergence and regression. The correlation between this feature and pyramid and responsiveness eval-uations is 0.79 and 0.62 respectively. The propor-tion of summary content composed of topic words performs worse as an evaluation metric with cor-relations 0.71 and 0.60. This result indicates that summaries that cover more topics from the input are judged to have better content than those in which fewer topics are mentioned.
sum-mary probabilities do not correlate significantly with manual scores.
5.2 Performance on micro level
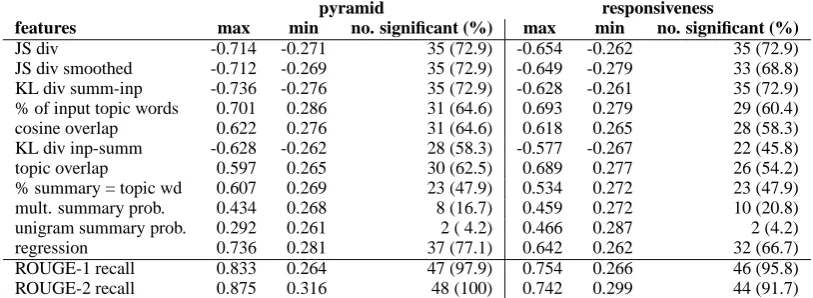
On a per input basis, the proposed metrics are not that effective in distinguishing which summaries have better content. The minimum and maximum correlations with manual evaluations across the 48 inputs are given in Table 3. The number and per-centage of inputs for which correlations were sig-nificant are also reported.
Now, JS divergence obtains significant correla-tions with pyramid scores for 73% of the inputs but for particular inputs, the correlation can be as low as 0.27. The results are worse for other features and for comparison with responsiveness scores.
At the micro level, combining features with re-gression gives the best result overall, in contrast to the findings for the macro level setting. This re-sult has implications for system development; no single feature can reliably predict good content for a particular input. Even a regression combination of all features is a significant predictor of content selection quality in only 77% of the cases.
We should note however, that our features are based only on the distribution of terms in the in-put and therefore less likely to inform good con-tent for all input types. For example, a set of documents each describing different opinion on a given issue will likely have less repetition on both lexical and content unit level. The predictiveness of features like ours will be limited for such in-puts4. However, model summaries written for the specific input would give better indication of what information in the input was important and inter-esting. This indeed is the case as we shall see in Section 6.
Overall, the micro level results suggest that the fully automatic measures we examined will not be useful for providing information about summary quality for an individual input. For averages over many test sets, the fully automatic evaluations give more reliable and useful results, highly correlated with rankings produced by manual evaluations.
4In fact, it would be surprising to find an automatically computable feature or feature combination which would be able to consistently predict good content for all individual in-puts. If such features existed, an ideal summarization system would already exist.
5.3 Effects of stemming
The analysis presented so far is on features com-puted after stemming the input and summary words. We also computed the values of the same features without stemming and found that diver-gence metrics benefit greatly when stemming is done. The biggest improvements in correlations are for JS and KL divergences with respect to re-sponsiveness. For JS divergence, the correlation increases from 0.57 to 0.73 and for KL divergence (summary-input), from 0.52 to 0.69.
Before stemming, the topic signature and bag of words overlap features are the best predictors of responsiveness (correlations are 0.63 and 0.64 respectively) but do not change much after stem-ming (topic overlap—0.62, bag of words—0.64). Divergences emerge as better metrics only after stemming.
Stemming also proves beneficial for the likeli-hood features. Before stemming, their correlations are directed in the wrong direction, but they im-prove after stemming to being either positive or closer to zero. However, even after stemming, summary probabilities are not good predictors of content quality.
5.4 Difference in correlations: pyramid and responsiveness scores
Overall, we find that correlations with pyramid scores are higher than correlations with respon-siveness. Clearly our features are designed to compare input-summary content only. Since re-sponsiveness judgements were based on both con-tent and linguistic quality of summaries, it is not surprising that these rankings are harder to repli-cate using our content based features. Neverthe-less, responsiveness scores are dominated by con-tent quality and the correlation between respon-siveness and JS divergence is high, 0.73.
pyramid responsiveness
features max min no. significant (%) max min no. significant (%)
JS div -0.714 -0.271 35 (72.9) -0.654 -0.262 35 (72.9) JS div smoothed -0.712 -0.269 35 (72.9) -0.649 -0.279 33 (68.8) KL div summ-inp -0.736 -0.276 35 (72.9) -0.628 -0.261 35 (72.9) % of input topic words 0.701 0.286 31 (64.6) 0.693 0.279 29 (60.4) cosine overlap 0.622 0.276 31 (64.6) 0.618 0.265 28 (58.3) KL div inp-summ -0.628 -0.262 28 (58.3) -0.577 -0.267 22 (45.8) topic overlap 0.597 0.265 30 (62.5) 0.689 0.277 26 (54.2) % summary = topic wd 0.607 0.269 23 (47.9) 0.534 0.272 23 (47.9) mult. summary prob. 0.434 0.268 8 (16.7) 0.459 0.272 10 (20.8) unigram summary prob. 0.292 0.261 2 ( 4.2) 0.466 0.287 2 (4.2) regression 0.736 0.281 37 (77.1) 0.642 0.262 32 (66.7) ROUGE-1 recall 0.833 0.264 47 (97.9) 0.754 0.266 46 (95.8) ROUGE-2 recall 0.875 0.316 48 (100) 0.742 0.299 44 (91.7)
Table 3: Spearman correlations at micro level (query focused task). Only the minimum, maximum values of the significant correlations are reported together with the number and percentage of significant correlations.
update input only avg. update & background
features pyramid respons. pyramid respons.
JS div -0.827 -0.764 -0.716 -0.669 JS div smoothed -0.825 -0.764 -0.713 -0.670 % of input topic words 0.770 0.709 0.677 0.616 KL div summ-inp -0.749 -0.709 -0.651 -0.624 KL div inp-summ -0.741 -0.717 -0.644 -0.638 cosine overlap 0.727 0.691 0.649 0.631 % of summary = topic wd 0.721 0.707 0.647 0.636 topic overlap 0.707 0.674 0.645 0.619 mult. summmary prob. 0.284 0.355 0.152 0.224 unigram summary prob. -0.093 0.038 -0.151 -0.053 regression 0.789 0.605 0.699 0.522
ROUGE-1 recall 0.912 0.865 . .
ROUGE-2 recall 0.941 0.884 . .
regression combining features comparing with background and update inputs (without averaging)
[image:7.595.93.500.63.212.2]correlations = 0.8058 with pyramid, 0.6729 with responsiveness
Table 4: Spearman correlations at macro level for update summarization. Results are reported separately for features comparing update summaries with the update input only or with both update and background inputs and averaging the two.
6 Comparison with ROUGE
For manual pyramid scores, the best correlation, 0.88, we observed in our experiments was with JS divergence. This result is unexpectedly high for a fully automatic evaluation metric. Note that the best correlation between pyramid scores and ROUGE (for R2) is 0.90, practically identical with JS divergence. For ROUGE-1, the correlation is 0.85.
In the case of manual responsiveness, which combines aspects of linguistic quality along with content selection evaluation, the correlation with JS divergence is 0.73. For ROUGE, it is 0.80 for R1 and 0.87 for R2. Using higher order n-grams is obviously beneficial as observed from the differences between unigram and bigram ROUGE scores. So a natural extension of our features would be to use distance between bigram
distri-butions. At the same time, for responsiveness, ROUGE-1 outperforms all the fully automatic fea-tures. This is evidence that the model summaries provide information that is unlikely to ever be ap-proximated by information from the input alone, regardless of feature sophistication.
At the micro level, ROUGE does clearly better than all the automatic measures. The results are shown in the last two rows of Table 3. ROUGE-1 recall obtains significant correlations for over 95% of inputs for responsiveness and 98% of inputs for pyramid evaluation compared to 73% (JS diver-gence) and 77% (regression). Undoubtedly, at the input level, comparison with model summaries is substantially more informative.
sum-maries are not available, our features can provide reliable estimates of system quality when averaged over a set of test inputs. For predictions at the level of individual inputs, our fully automatic features are less useful.
7 Update Summarization
In Table 4, we report the performance of our fea-tures for system evaluation on the update task. The column, “update input only” summarizes the cor-relations obtained by features comparing the sum-maries with only the update inputs (set B). We also compared the summaries individually to the update and background (set A) inputs. The two sets of features were then combined by a) averag-ing (“avg. update and background”) and b) linear regression (last line of Table 4).
As in the case of query focused summarization, JS divergence and percentage of input topic sig-natures in summary are the best features for the update task as well. The overall best feature is JS divergence between the update input and the summaries—correlations of 0.82 and 0.76 with pyramid and responsiveness.
Interestingly, the features combining both up-date and background inputs do not lead to better correlations than those obtained using the update input only. The best performance from combined features is given by the linear regression metric. Although the correlation of this regression feature with pyramid scores (0.80) is comparable to JS di-vergence with update inputs, its correlation with responsiveness (0.67) is clearly lower. These re-sults show that the term distributions in the update input are sufficiently good predictors of content for update summaries. The role of the background input appears to be negligable.
8 Discussion
We have presented a successful framework for model-free evaluations of content which uses the input as reference. The power of model-free eval-uations generalizes across at least two tion tasks: query focused and update summariza-tion.
We have analyzed a variety of features for input-summary comparison and demonstrated that the strength of different features varies considerably. Similar term distributions in the input and the sum-mary and diverse use of topic signatures in the summary are highly indicative of good content.
We also find that preprocessing like stemming im-proves the performance of KL and JS divergence features.
Very good results were obtained from a corre-lation analysis with human judgements, showing that input can indeed substitute for model sum-maries and manual efforts in summary evaluation. The best correlations were obtained by a single feature, JS divergence (0.88 with pyramid scores and 0.73 with responsiveness at system level).
Our best features can therefore be used to eval-uate the content selection performance of systems in a new domain where model summaries are un-available. However, like all other content evalua-tion metrics, our features must be accompanied by judgements of linguistic quality to obtain whole-some indicators of summary quality and system performance. Evidence for this need is provided by the lower correlations with responsiveness than the content-only pyramid evaluations.
The results of our analysis zero in on JS diver-gence and topic signature as desirable objectives to optimize during content selection. On the macro level, they are powerful predictors of content qual-ity. These findings again emphasize the need for always including linguistic quality as a component of evaluation.
Observations from our input-based evaluation also have important implications for the design of novel summarization tasks. We find that high cor-relations with manual evaluations are obtained by comparing query-focused summaries with the en-tire input and making no use of the query at all. Similarly in the update summarization task, the best predictions of content for update summaries were obtained using only the update input. The uncertain role of background inputs and queries expose possible problems with the task designs. Under such conditions, it is not clear if query-focused content selection or ability to compile up-dates are appropriately captured by any evaluation.
References
J. Conroy and H. Dang. 2008. Mind the gap: Dangers of divorcing evaluations of summary content from linguistic quality. In Proceedings of the 22nd
Inter-national Conference on Computational Linguistics (Coling 2008), pages 145–152.
J. Conroy, J. Schlesinger, and D. O’Leary. 2006. Topic-focused multi-document summarization using an approximate oracle score. In Proceedings of
R. Donaway, K. Drummey, and L. Mather. 2000. A comparison of rankings produced by summarization evaluation measures. In NAACL-ANLP Workshop
on Automatic Summarization.
H. Jing, R. Barzilay, K. Mckeown, and M. Elhadad. 1998. Summarization evaluation methods: Experi-ments and analysis. In In AAAI Symposium on
Intel-ligent Summarization, pages 60–68.
M. Lapata and R. Barzilay. 2005. Automatic evalua-tion of text coherence: Models and representaevalua-tions. In IJCAI’05.
C. Lin and E. Hovy. 2000. The automated acquisition of topic signatures for text summarization. In
Pro-ceedings of the 18th conference on Computational linguistics, pages 495–501.
C. Lin and E. Hovy. 2003. Automatic evaluation of summaries using n-gram co-occurance statistics. In
Proceedings of HLT-NAACL 2003.
C. Lin, G. Cao, J. Gao, and J. Nie. 2006. An information-theoretic approach to automatic evalu-ation of summaries. In Proceedings of the Human
Language Technology Conference of the NAACL, Main Conference, pages 463–470.
C. Lin. 2004. ROUGE: a package for automatic eval-uation of summaries. In ACL Text Summarization
Workshop.
K. McKeown, R. Barzilay, D. Evans, V. Hatzivas-siloglou, B. Schiffman, and S. Teufel. 2001. Columbia multi-document summarization: Ap-proach and evaluation. In DUC’01.
A. Nenkova and R. Passonneau. 2004. Evaluating content selection in summarization: The pyramid method. In HLT/NAACL.
A. Nenkova, R. Passonneau, and K. McKeown. 2007. The pyramid method: Incorporating human con-tent selection variation in summarization evaluation.
ACM Trans. Speech Lang. Process., 4(2):4.
P. Over, H. Dang, and D. Harman. 2007. Duc in con-text. Inf. Process. Manage., 43(6):1506–1520.
D. Radev, S. Teufel, H. Saggion, W. Lam, J. Blitzer, H. Qi, A. C¸ elebi, D. Liu, and E. Drabek. 2003. Evaluation challenges in large-scale multi-document summarization: the mead project. In Proceedings of
ACL 2003, Sapporo, Japan.
G. J. Rath, A. Resnick, and R. Savage. 1961. The formation of abstracts by the selection of sentences: Part 1: sentence selection by man and machines.
American Documentation, 2(12):139–208.
I. Soboroff and D. Harman. 2005. Novelty detec-tion: the trec experience. In HLT ’05: Proceedings