were Rtted with a monochromator, utilized ultra-violet light and measured in the reSection mode, which has advantages over the transmission mode.
In 1976 theRrst experimental set-up for evaluation of planar chromatograms by video technology was described by Devenyi. In the following years instru-ments originally designed for the evaluation of elec-trophoresis gels were adapted for use in TLC. TLC-speciRc video systems have been available since 1988 (Uniscan, Analtech).
Modern scanning densitometersas well as state-of-the-art video densitometry are discussed in the section on Thin-layer (planar) chromatography}instrumentation.
See Colour Plate 29.
See also: II/Chromatography: Thin-Layer (Planar): Densitometry and Image Analysis; Instrumentation; Layers; Modes of Development: Conventional; Modes of Development: Forced Flow, Overpressured Layer Chromatography and Centrifugal; Spray Reagents; The-ory of Thin-Layer (Planar) Chromatography.
Further Reading
Geiss F (1987)Fundamentals of Thin Layer Chromatogra-phy. Heidelberg: Huethig.
Glajch JG, Kirkland JJ, Squire KM and Minor JM (1980)
Journal of Chromatography199: 57}79.
Kirchner JG (1978)Thin Layer Chromatography, 2nd edn. New York: Wiley.
Sabate C and Thomas X (1984)Journal of High Resolution Chromatography & Chromatography Communications
7: 104}106.
Sherma J and Fried B (eds) (1996)Handbook of Thin Layer Chromatography. New York: Dekker.
Stahl E (1967)Thin Layer Chromatography}A Laborat-ory Handbook, 2nd edn. Berlin: Springer.
Wang Q-S and Wang N-Y (1990) Journal of Planar Chromatography3: 15}19.
Windhorst G, Kelder J and De Kleijn JP (1990)Journal of Planar Chromatography3: 300}306.
Wintermayer U (1986) The Roots of Chromatography:
Historical Outline of the Beginning to Thin-layer Chromatography. Darmstadt: GIT.
Instrumentation
D. E. Jaenchen and E. Reich, Camag, Muttenz, Switzerland
Copyright^ 2000 Academic Press
Introduction
At the end of the 1950s thin-layer chromatography was introduced as a rapid, simple technique for quali-tative investigations, and it is still widely used in this capacity. With the introduction of high performance plate material (HPTLC) and the availability of dedi-cated densitometers, thin-layer chromatography has gained increasing acceptance as a quantitative ana-lytical tool. However, to unlock its full potential as an accurate and reliable technique, HPTLC demands the use of instrumentation for the entire process includ-ing sample application, chromatogram development and chromatogram evaluation. Since analytical procedures are only as good as their weakest step, additional operations such as in situ pre- or post-chromatographic derivatization, as well as sample preparation, require instrumentation for increased reproducibility.
Although several attempts have been made to auto-mate fully the complete TLC process, it seems ques-tionable whether such automation would increase the overall performance of the method. It has proved very difRcult to design a device, at a reasonable cost, that
is essentially an automated online system, but at the same time retains the extremeSexibility of the tradi-tional ofSine design of TLC. One of the many distinct advantages of TLC}the fact that each step can be separated in time and location from all other steps}is very likely to be lost in a fully automated design. Automation of each individual step, perhaps linked by suitable software, appears to be the better choice.
Sample Application
As theRrst step of planar chromatography, sample application largely determines the overall quality of the separation. All analytes and standards are chromatographed and compared with each other on the same plate, generally by means of migration dis-tance orRFvalue. Therefore, exact positioning of the sample during application is crucial for both qualitat-ive and quantitatqualitat-ive TLC. Quantitatqualitat-ive work also requires exact reproducibility of applied volumes. Furthermore, in order to utilize fully the separation power of the layer, it is important to restrict the dimension of the sample origin in the direction of chromatography. The advantage of instrumentation is mainly derived from a much higher reproducibility of all these parameters.
Figure 1 Camag Nanomat.
Figure 2 Camag Linomat IV.
application technique depends on factors such as the nature of the analytical task, the type of sample matrix, workload and time constraints, the type of separation layer, and the sample volumes to be applied.
Sample volumes that can be applied as spots de-livered in one stroke are 0.5}5L on conventional layers and 0.1}1L on HPTLC layers. Larger vol-umes may be applied either as spots by using a device with controllable delivery speed, or by spraying them on in the form of narrow bands.
Sample Application as Spots
The simplest technique to apply samples as spots is to use aRxed volume pipette thatRlls by capillary action and delivers its content when it touches the layer. Variable volumes can be applied with a syringe, pre-ferably one with micrometer control. Instruments for sample application should ensure two things: Rrst, that the spots are precisely positioned and second, that the layer is not damaged during application. The Camag Nanomat is a mechanized spotting device using Rxed volume glass capillaries, which are lowered onto the layer with reproducible contact pressure (Figure 1). The exact position of the spot is mechanically controlled. An instrument designed for the use of microlitre syringes is the Desaga PS 01 Sample Applicator.
Sample Application as Bands
Sample application in the form of narrow bands pro-vides the highest resolution attainable with a given chromatographic separation method. The sample is typically contained in a syringe, which is emptied by a motor. Delivery speed and volume are electronically controlled. A stream of an inert gas such as nitrogen
around the tip of the syringe atomizes the sample and creates a band on the TLC plate if either the syringe or the plate is moving linearly. Because large sample volumes can be applied, this technique is able to lower dramatically the determination limits with re-spect to analyte concentration in the sample solution, e.g. in trace analysis. Another beneRt of the spray-on technique for quantitative analysis is the possibility of applying different volumes of the same calibra-tion standard instead of equal volumes of different standard concentrations. The spray-on technique also allows unknowns to be simply over-sprayed with ‘spiking’ solutions for the standard-addition method. The Linomat (Figure 2) allows sample application in narrow bands of variable length by a multipassage spray-on technique. The instrument can be used to apply sample volumes of 2}100L onto HPTLC plates or conventional layers. By employing the Linomat spray-on technique, the gain in precision of quantitative TLC analysis can be expected to be in the range of 30%, i.e. from 1.5% relative standard devi-ation to 1.0%, provided that chromatographic res-olution is not a problem. If samples are complex, ‘dirty’, tend to tailing, or are otherwise ‘difRcult’, the choice between band application and spot application may determine whether or not a meaningful quantit-ative result will be obtained at all.
Automated Sample Application
Sample application in quantitative TLC analysis can take up as much as one third of the time needed for the entire analysis. When carried out manually, this is pure labour time. Therefore, attempts to automate or otherwise rationalize this step have been made since the early days of TLC.
Figure 3 Camag horizontal development chambers.
However, none of the multicapillary or multisyringe devices were truly suitable for the smaller dimensions of HPTLC. Applying samples sequentially proved to be a more appropriate approach to solving the prob-lem of automated sample application without sacriR -cing precision.
The Camag Automatic TLC Sampler III is aSexible computer-controlled device that can apply samples automatically from a rack of sample vials. The sam-ples are transferred from the vials onto the plate with a steel capillary either as spots by contact or as bands using a multipassage spray-on technique. The sample-dispensing speed, sample volumes and application pattern are freely selectable. Each application step is followed by a programmable rinsing cycle to avoid cross-contamination of samples. Because the ware of the instrument is compatible with the soft-ware for densitometric chromatogram evaluation, all calibration data need to be entered only once. An-other advantage of this automated system is its Good Laboratory Practice/Good Manufacturing Practice (GLP/GMP) compliance.
The Desaga TLC Applicator AS 30 also applies samples to a planar chromatography surface in the form of spots or bands. The differences between the two applicators are that spots are applied by spraying and that a one-passage spray-on process produces bands. The AS 30 Applicator can be coupled with a typical HPLC autosampler. The functionality of such a combination is comparable to that of the ATS III.
Chromatogram Development
Although chromatogram development is the most decisive step in the TLC procedure, important para-meters are often not given the attention they deserve. Even as part of quantitative analytical procedures, most planar chromatograms are still developed with rather primitive equipment.
The classical way to develop a planar chromato-gram is to place the plate with its lower edge immer-sed in the developing solvent contained in a tank. While the solvent ascends the plate, the layer interacts with the vapour phase in the tank. Since developing tanks of different manufacturers vary considerably in size, chromatograms developed in one device cannot generally be duplicated in another. It is customary to line the inside of the tank with Rlter paper soaked with the developing solvent. Although this can be often advantageous, it is not always the case.
A counter plate arranged at a small distance oppo-site to the layer can largely suppress interaction be-tween the dry or wetted layer and the gas phase. This is called a ‘sandwich conRguration’. Although sand-wich chambers tend to improve the reproducibility of
the separation, secondary fronts, caused by partial solvent de-mixing of complex mobile phases, are often produced and may interfere with resolution of samples. A limited degree of inSuence over the gas phase parameters during chromatographic development is offered by the twin-trough chamber. A special ad-vantage of this chamber is the possibility of affecting the separation through preconditioning.
The horizontal developing chamber (HDC; Figure 3) allows a planar chromatogram to be de-veloped in both the sandwich and tank conRguration with or without solvent vapour saturation. For devel-opment in the HDC, samples can be applied parallel to both opposing edges of the plate, which is then developed from both sides towards the middle. In this way the number of samples per plate can be doubled. However, when used for one-directional develop-ment, the HDC also offers advantages in that chromatographic conditions can be standardized. This type of chamber uses very small amounts of developing solvent (2;5 mL for a 20 cm;10 cm plate) and offers, therefore, an economical alternative to the conventional developing tank.
Automatic Chromatogram Development
Figure 4 (See Colour Plate 30) Camag automated multiple development chamber AMD 2.
Computer-Controlled Multiple Development of Planar Chromatograms
Automated multiple development, more particularly when performed as a gradient technique, achieves the maximum resolution feasible within the limited sep-aration distance available on a HPTLC plate. In terms of peak capacity it compares with HPLC while retain-ing the inherent beneRts of planar chromatography. The automated multiple developing system (AMD; Figure 4) serves for this type of chromatogram devel-opment. A step gradient of decreasing eluotropic strength and changing selectivity is created and each development proceeds to a higher migration distance than the one before. A typical standard gradient changes the developing solvent from methanol to dichloromethane to hexane in 25 steps over a Rnal migration distance of 65 mm. Between each step the plate is dried under vacuum. The software allows the composition of developing solvent to be speciRed as well as the developing distance for each step. Solvent volumes are measured with syringes and migration distance of the solvent front is measured with sensors. Preconditioning through the gas phase prior to devel-opment is possible.
Forced Flow Layer Chromatography
Several attempts have been made to accelerate the solvent Sow in planar chromatography. Applying pressure in the linear or radial direction or using
centrifugal forces have been described. The only tech-nique that has survived is the so-called ‘over-pressure layer chromatography’ (OPLC), which is described in detail elsewhere in this volume.
Densitometric Chromatogram
Evaluation
Principle
During densitometric evaluation of a planar chrom-atogram, its separation tracks are scanned with a light beam in the form of a slit adjustable in length and width. The photosensor of the densitometer measures diffusely reSected light. The difference between the optical signal from the sample-free back-ground and that from a sample zone (fraction) is correlated with the amount of the respective fractions of calibration standards chromatographed on the same plate. Densitometric measurements of planar chromatograms can be made by absorbance or by
Suorescence.
As an alternative to classical densitometry, a planar chromatogram can be evaluated by video technology.
Comparison of Video Technology with Classical Densitometry
Classical densitometry uses the spectral range from 190 to 800 nm with high spectral selectivity. Absorp-tion spectra for substance identiRcation can be re-corded within this whole span. In contrast, video technology functions only in the visible range. The UV region}exceptionally productive for planar chro-matography } is only indirectly accessible through the use of an UV indicator embedded in the layer and in cases where samplesSuoresce. In this respect video technology parallels the human eye.
Spectral selectivity, a strong point of the classical densitometer, is not accessible with a video system. The greater the absorbance of the analyte at or near the excitation maximum of the UV indicator (254 nm), the higher are the sensitivity and accuracy of video quantiRcation. In certain cases they may even become comparable to those of classical den-sitometry.
In Suorescence mode video and classical den-sitometry are comparable in respect to detection of emissions in the visible region, caused by long-wave UV light (366 nm). However, video technology lacks the variable-excitation-based selectivity of classical densitometry.
Figure 5 Light path diagram of the TLC scanner. Key: 1, lamp selector; 2, entrance lens system; 3, monochromator entry slit; 4, monochromator grating; 5, mirror; 6, slit aperture disc; 7, lens system; 8, mirror; 9, beam splitter; 10, reference photomultiplier; 11, scanning object; 12, measuring photomultiplier; 13, photodiode (transmission).
wavelength.In situspectroscopy is only possible with the classical densitometer.
Features of a Modern Chromatography Densitometer
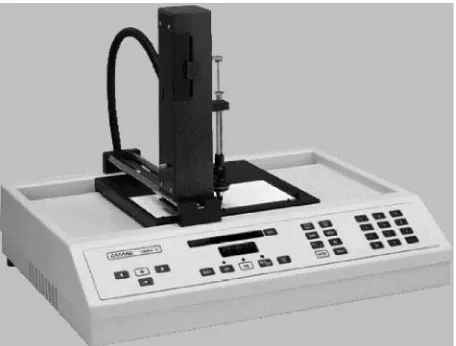
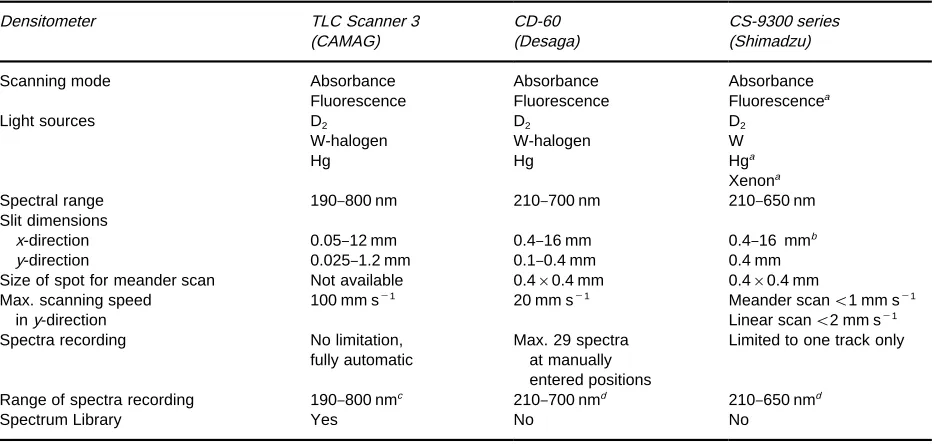
The Camag TLC Scanner 3 may be used to illustrate typical features of a modern densitometer (see Figure 5). Some particulars of other densitometers are also discussed. Technical data for a number of densitometers are given inTable 1.
Two continuum lamps, a deuterium and a tung-sten}halogen lamp, in combination with a mono-chromator generate light of 5}20 nm bandwidths in the spectral range from 190}800 nm. A third, high pressure mercury vapour lamp provides high energy for scanning bySuorescence. The lamps are selected and positioned automatically. Plates up to 20 cm;20 cm are placed on a stage that is mechan-ically operated in the x- and y-directions. The scanning speed is variable to a max of 100 mm s\1. Several cutoff Rlters can be selected forSuorescence scanning.
All functions of the scanner as well as generation and processing of data are controlled by a personal computer using dedicated software. A typical se-quence of quantitative evaluation of a chromatogram includes raw data acquisition, data integration, cali-bration and calculation of results, and generation of the analysis report.
Raw data are sampled by scanning the chromato-gram plate in the direction of chromatography, track by track. Integration is performed from the raw data after all the tracks on a plate have been measured. The system automatically deRnes and corrects the baseline and sets fraction limits. The operator can accept these or can override the automatic process by manual integration.
In the calibration routine, peak data of the un-knowns are related to those of the calibration stan-dards. From several calibration functions, including single- or multi-level with linear or polynomial re-gression, the most suitable for the task is chosen.
Table 1 Technical data for some planar chromatography densitometers
Densitometer TLC Scanner 3 CD-60 CS-9300 series
(CAMAG) (Desaga) (Shimadzu)
Scanning mode Absorbance Absorbance Absorbance
Fluorescence Fluorescence Fluorescencea
Light sources D2 D2 D2
W-halogen W-halogen W
Hg Hg Hga
Xenona
Spectral range 190}800 nm 210}700 nm 210}650 nm
Slit dimensions
x-direction 0.05}12 mm 0.4}16 mm 0.4}16 mmb
y-direction 0.025}1.2 mm 0.1}0.4 mm 0.4 mm
Size of spot for meander scan Not available 0.4;0.4 mm 0.4;0.4 mm Max. scanning speed
iny-direction
100 mm s\1 20 mm s\1 Meander scan(1 mm s\1
Linear scan(2 mm s\1
Spectra recording No limitation,
fully automatic
Max. 29 spectra at manually entered positions
Limited to one track only
Range of spectra recording 190}800 nmc 210}700 nmd 210}650 nmd
Spectrum Library Yes No No
aOptional.
bSlit scanning simulated by spot scanning at high speed with selectable swing. cSpectra recording across lamp boundary with lamps stabilized.
dSpectra recording across lamp boundary, lamps not stabilized.
and time of the last change, plus a unique system-generated identiRcation number for GMP/GLP recognition.
Modern scanners are usually able to do more than just quantify the substances on a plate. The following is a selection of other capabilities.
Multiwavelength scanning This expression is often misinterpreted as scanning at selectable wavelengths, a very basic feature of any densitometer Rtted with a monochromator. Multiwavelength scanning means that initially acquired raw data of up to ten different wavelengths can be separately processed post-run in the integration and calibration routine. Therefore, each substance can be quantiRed at the wavelength of its maximum absorbance (see Figure 6). Dual-wavelength scanning, which may be used for example to eliminate matrix effects, is a simple variation of multiwavelength scanning.
Recordingin situ spectra Absorption spectra across the entire range of the monochromator can be mea-sured and, within certain restrictions, so canS uores-cence excitation spectra. In the Camag scanner both deuterium and halogen}tungsten lamps remain pow-ered the whole time and are therefore well stabilized. The spectral data can be processed post-run for vari-ous purposes:
E to determine the optimum wavelength(s) for quan-titative scanning;
E to identify individual fractions by comparison with spectra of authentic standards co-chromato-graphed on the same plate or stored in a spectrum library; E to check identity by superimposing the spectra of
all fractions within the sameRFwindow;
E to check the purity of fractions by superimposing the spectra from different positions within a spot.
Scanner validation Automatic instrument valida-tion is available as an opvalida-tion of the software. In the scanner validation procedure the following checks are performed: wavelength adjustment of the mono-chromator, correct stage positioning; condition and alignment of lamps, condition and alignment of the optical system; and functioning of the electronics. The results, together with the target values, are printed as a validation report.
Figure 6 (See Colour Plate 31) Multiwavelength scan of a pesticide mixture after AMD separation.
HPTLC separation material, and unfavourable error propagation, when data of sampling points from dif-ferent positions are averaged.
Chromatogram Evaluation with Video Technology
A video imaging system typically consists of a lighting module such as Reprostar 3 featuring short-wave UV, long-wave UV and visible light, a charge-coupled device (CCD) camera with zoom objective, computer with frame grabber, and imaging and evaluation soft-ware such as VideoStore/VideoScan). Most software allows the user to annotate and manipulate the im-ages. VideoStore image data are archived under ob-servation of GMP/GLP. They can be retrieved any time for quantiRcation with the VideoScan software. Multiple images can be opened and their analogue curves can be compared.
The beneRts of chromatogram evaluation by video technology are speed, easy and intuitive operation, and the fact that saved chromatograms can be evalu-ated at any time if required.
Post-Chromatographic Derivatization
It is an inherent advantage of planar chromatography that fractions are stored on the plate and can readily be derivatized after chromatography in order to ren-der them detectable, to improve detection limit, or to change selectively properties of sample components.
Liquid derivatizing agents can be transferred onto the plate by spraying or dipping. Provided the reagent is suitable, dipping is the preferred technique.
The Chromatogram Immersion device by Camag is an example of an instrument that allows proper ex-ecution of the dipping technique. The chromato-graphic plate must be immersed and withdrawn at a uniform speed to avoid tide marks, which could interfere with densitometric evaluation. By maintain-ing a deRned immersion time, derivatization condi-tions can be standardized.
Spraying has to be used when two reagent solutions have to be applied in sequence without intermediate drying. Diazotization followed by coupling is an example. There are several sprayers on the market, from simple laboratory atomizer to electropneumatic TLC sprayers.
Whenever reagents are sprayed onto a plate, an efRcient dust and mist-removing device should be used to protect laboratory personnel against poison-ous or irritating sprays and solvent vapours. Com-merical equipment ensures the complete removal of excess spray from the atomizer and spray particles rebounding from the TLC plate. There is no deS ec-tion of the spray jet before it reaches the chromato-gram, an effect often occurring in a normal laborat-ory fume hood.
chromatogram plate uniformly and reproducibly at the desired temperature can be accomplished with a heater speciRcally designed for this purpose.
Combination of Planar
Chromatography with Other
Techniques
Combination of planar chromatography and various chromatographic or non-chromatographic methods has been reported frequently. Such combinations in-clude HPLC-TLC, FTIR, Raman, TLC-SERS and TLC-MS. Most devices to effect these com-binations have been custom-built and only a few are commercially available.
Coupling HPLC with Planar Chromatography
Combining separation techniques that utilize differ-ent mechanisms to a multidimensional approach in-creases the potential of the individual techniques by an order of magnitude. HPLC in reversed-phase mode is one of the most powerful separation tech-niques available for nonvolatile substances. Online coupling of HPLC with a multiple development sys-tem using normal-phase chromatography results in peak capacities of around 500.
A device for mass transfer from HPLC to planar chromatography consists of a sample spray-on device that is connected to the column outlet. Since the maximum quantity of liquid that can be sprayed on a silica layer without washing it away is limited to 10}60L min\1, depending on the mobile phase, a microbore HPLC unit is the most appropriate for this technique.
FTIR Evaluation of Planar Chromatograms
The combination of planar chromatography with Fourier transform infraredin situevaluation is a use-ful method for the identiRcation of complex mixtures and their constituents. Although determination limits (1}10g per fraction) are higher than those forin situ
UV spectroscopy, the method can be used for the quantiRcation of substances that exhibit no suitable UV response and are not amenable to derivatization. A major drawback of in situ FTIR is the strong absorption of silica gel between 3700}3100 and 1650}800 cm\1. Spectral correction can be achieved by background subtraction of data recorded from an empty track.
Combination of Planar Chromatography with Raman Spectroscopy
Regular Raman spectroscopy as well as the SERS technique (surface enhanced Raman scattering) is
suitable for the identiRcation of substances on a TLC plate.In situRaman generates spectra that are more or less identical with published Raman spectra mea-sured on solids. Detection limits are comparatively poor, i.e. in the range of 0.5}5g per fraction. SERS is suitable for detection and identiRcation of com-pounds in the picogram range, if the layer is treated with a colloidal silver solution. The user must record a custom library of SERS spectra from a similar layer in order to perform an identiRcation of a totally unknown material.
A multidimensional combination of outstanding separation power is that of HPLC coupled with auto-mated multiple development planar chromatography featuring evaluation by a special SERS technique em-ploying silver deposition via the gas phase.
Combination of Planar Chromatography with Mass Spectrometry (MS)
For thein situidentiRcation of compounds separated on a TLC plate, molecules must be desorbed from the layer and then introduced into the ion source of the mass spectrometer. Such desorption can be accomp-lished by laser ablation or particle beam sputtering techniques. Ionization methods include conventional chemical ionization (CI), fast atom bombardment (FAB), liquid secondary-ion mass spectrometry (liquid-SIMS), and matrix-assisted laser desorp-tion/ionization (MALDI). Mass analysers are either sectorReld, quadrupole or time ofSight (TOF) instru-ments. The principal limitation of the interesting TLC-MS hyphenation is that there is no MS instru-ment available that takes 10 cm;10 cm or larger plates.
Future Trends
See Colour Plates 30, 31.
See also: II/Chromatography: Thin-Layer (Planar): Densitometry and Image Analysis; Mass Spectrometry; Modes of Development: Conventional; Modes of Develop-ment: Forced Flow, Overpressured Layer Chromatogra-phy and Centrifugal; Spray Reagents. III/Flame Ioniz-ation Detection: Thin-Layer (Planar) Chromatography. Thin-Layer Chromatography-Vibration Spectroscopy. Appendix 2 / Essential Guides to Method Development in Thin-Layer (Planar) Chromatography.
Further Reading
Bertsch W, Hara S, Kaiser RE and Zlatkis A (eds) (1980)
Instrumental HPTLC. Heidelberg: HuKthig.
Frey H-P and Zieloff K (1993) Qualitative and Quan-titative Thin Layer Chromatography (in German). Weinheim: VCH Publishers.
Geiss F (1987)Fundamentals of Thin Layer Chromatogra-phy. Heidelberg: HuKthig.
Grinberg N (ed.) (1990)Modern Thin Layer Chromatogra-phy. New York: Marcel Dekker.
Jork H, Funk W, Fischer W and Wimmer H (1990)
Thin Layer Chromatography. Reagents and Detec-tion Methods, vols 1a and 1b. Weinheim: VCH Publishers.
Sherma J and Fried B (eds) (1998) Handbook of Thin Layer Chromatography. New York: Marcel Dekker.
Ion Pair Thin-Layer (Planar) Chromatography
I. D. Wilson, AstraZeneca Pharmaceuticals, Macclesfield, Cheshire, UK
Copyright^ 2000 Academic Press
Introduction
The separation of polar, ionizable substances can cause problems for simple partition- or adsorption-based chromatographic systems and this is as true in thin-layer, or planar, chromatography (TLC) as for any of the other liquid chromatographic techniques. Often the problem can be dealt with by the simple expedient of controlling the pH of the solvent used for chromatography, in order to suppress the ioniz-ation of the solute and thereby reduce its polarity. However, with very polar compounds this is not always a successful strategy and in such circumstan-ces it may be more practical to employ an ion pair (IP) reagent (often referred to as soap chromatography in the early literature). A further beneRt of using such an approach is that a hydrophobic IP reagent may, in addition to masking the ionizable group, usefully modify the overall polarity of the complex and thus cause a dramatic change in chromatographic proper-ties. Whilst IP-TLC has not been as widely employed as IP-high performance liquid chromatography (IP-HPLC: described elsewhere in this encyclopedia), there have been sufRcient examples of the technique to demonstrate its utility for both acids and bases.
In addition to simply using IP reagents in order to obtain suitable chromatographic separations for sub-stances that are too polar to chromatograph in any other way, this type of TLC has other uses. For example, faced with a mixture of neutral and ioniz-able compounds, an IP reagent may enioniz-able the
ana-lyst to introduce additional selectivity into the system. This can enable theRF of more acidic or basic com-pounds to be altered whilst leaving those of neutral solutes unchanged and thereby effecting a separation. The addition of an IP reagent to a system can also provide a rapid indication of which compounds in a mixture are ionizable. There have also been several examples of the use of chiral IP reagents for the separation of enantiomers.
The scope and practice of IP-TLC are described below.
Practical Aspects of IP-TLC
Suitable Ion Pair Reagents for IP-TLC
A range of IP reagents have been used for TLC and high performance TLC (HPTLC). These include both the conventional IP reagents used in other forms of liquid chromatography, such as heptanesulfonic acid, triethanolamine dodecylbenzene sulfonate and sodium dodecyl sulfate for bases and quaternary ammonium salts including tetramethyl, tetrabutylam-monium and cetrimide for acids. Some limited work has been performed using ‘bolaform’ bisquaternary ammonium compounds where two such groups are separated by an alkyl chain of varying length which acts as a spacer.
In addition to these IP reagents, it is arguable that in cases where strong organic acids such as
tri-Suoroacetic acid have been used to enable good chromatography of bases to be obtained, a form of IP chromatography is being performed.