ISSN Online: 2331-4249 ISSN Print: 2331-4222
DOI: 10.4236/wjet.2018.63039 Jul. 31, 2018 631 World Journal of Engineering and Technology
Research on Geometric Errors Measurement of
Machine Tools Using Auto-Tracking Laser
Interferometer
Jr-Rung Chen
*, Bing-Lin Ho, Hau-Wei Lee, Shan-Peng Pan, Tsung-Han Hsieh
Center for Measurement Standards, ITRI, Hsinchu City, Taiwan
Abstract
For the development of the aviation industry, machine tools are becoming large and travel long distances, making optical alignment setup difficult. An auto-tracking laser interferometer (ATLI) is proposed and researched in this paper for the squareness error measurement of machine tools or coordi-nate-measuring machines (CMMs). The procedure involves measurement of only one line of an axis, and the measurement results provide us information about not only the positioning errors but also the squareness errors. This spe-cially designed interferometer instrument can be useful in checking industrial machine tools in a short time.
Keywords
ATLI, CMMs, Laser Interferometer, Machine Tool
1. Introduction
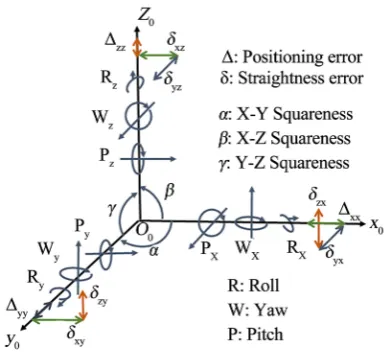
Machine tools and coordinate measuring machines (CMMs) with 3 - 5 axes have played fundamental roles in industrial development. As seen in Figure 1, a total of 21 geometric errors affect the volumetric accuracy of three-dimensional ma-chine tools and CMMs [1]. These errors include translation, rotation, and squareness errors. Calibration and compensation of these geometric errors are necessary to improve the positioning accuracy of machine tools. When consi-dering the mechanical accuracy of coordinate measuring devices, three primary sources of quasi-static errors can be identified. Geometric errors are due to the limited accuracy of individual machine components, such as guideways and measuring systems. Errors related to the final stiffness of these components mainly arise from the moving parts. Thermal errors originate as a result of ex-How to cite this paper: Chen, J.-R., Ho,
B.-L., Lee, H.-W., Pan, S.-P. and Hsieh, T.-H. (2018) Research on Geometric Errors Measurement of Machine Tools Using Au-to-Tracking Laser Interferometer. World Journal of Engineering and Technology, 6, 631-636.
https://doi.org/10.4236/wjet.2018.63039
Received: May 1, 2018 Accepted: July 28, 2018 Published: July 31, 2018
Copyright © 2018 by authors and Scientific Research Publishing Inc. This work is licensed under the Creative Commons Attribution International License (CC BY 4.0).
http://creativecommons.org/licenses/by/4.0/
DOI: 10.4236/wjet.2018.63039 632 World Journal of Engineering and Technology pansion and bending of guideways due to temperature gradients.
Geometric errors are caused by straightness errors of the guideways [2], im-perfect alignment of the axis, and flatness errors of the manufactured surfaces. In particular, squareness error of machine tools may arise due to installation, shipping, or heavy cutting. The squareness error between linear motions of two axes can be estimated using diagonal displacement (ISO 230-6) tests. The linear positioning accuracy and the repeatability of the x- , y- , and z-axes and the xy, xz, yz, and xyz diagonal lines can be determined according to the ISO 230-2 and -6 standards [3] [4]. ISO 230-2 defined the minimum measuring point numbers while measuring x, y or z axis and ISO 230-6 defined the minimum point num-bers when x-y, x-z, y-z z-x or x-y-z diagonal line is measured.
A laser interferometer and an auto-tracking laser interferometer (ATLI) can be used to perform the seven lines tests. However, the time consumed when us-ing a laser interferometer is approximately three times that when an ATLI is used. The laser tracker [5] [6] and LaserTRACER (LT) [7] are both ATLI types. Dr. Lee [8] has discussed the relationship between ISO 230-2/-6 test results and the positioning accuracy of machine tools using LT. This paper will further dis-cuss the trend of the measurement result when only one ATLI is used for the squareness measurement of machine tools or CMM.
2. Method
2.1. Test Procedure
[image:2.595.275.468.527.704.2]The first step in using ATLI, following ISO 230-2 and 230-6, is to fix the ATLI onto the machine tool carriage [8]. The next step is to determine the ATLI’s lo-cation with respect to the home/reference point of the machine tool. The mea-surement points for each test line are computed when the ATLI’s location is de-termined. Numerical control (NC) codes are also generated. Users import these NC codes into the machine tool controller. The seven lines test is then per-formed. Subsequently, a test report can be generated after analyzing the test data.
DOI: 10.4236/wjet.2018.63039 633 World Journal of Engineering and Technology
2.2. Determination of ATLI Coordinate
The second step in the ISO 230-2 and 230-6 test procedures, as mentioned in Section 2.1, is determining the ATLI’s coordinates on the machine tool, which can be calculated using a six-point measurement and the following formula:
2 2 2 2
1 1 1 1 1 1 1 1
2 2 2 2
2 2 2 2 2 2 2 2
2 2 2 2
3 3 3 3 3 3 3 3
2 2 2
4 4 4 4 4 4 4 4
0
5 5 5 5
6 6 6 6
2 2 2 2 1
2 2 2 2 1
2 2 2 2 1
2 2 2 2 1
2 2 2 2 1
2 2 2 2 1
t
t
t
x y z L x y z L
x
x y z L x y z L
y
x y z L x y z L
z
x y z L x y z L
L
x y z L
x y z L
ξ + ∆ − + + − ∆ ∆ − + + − ∆ ∆ − + + − ∆ = ∆ − + + − ∆ ∆ − ∆ − 2
2 2 2 2
5 5 5 5
2 2 2 2
6 6 6 6
x y z L
x y z L
+ + − ∆ + + − ∆ (1)
where the residual measurement errors are 2 2 2 2 0
t t t
x y z L
ζ = + + − and the “+” symbol represents the pseudo-inverse operator. The six stop points (p=1, 2, ,6 ) of the cat’s eye reflector are (xp, yp, zp). These points are inde-pendent and should be known. (xt, yt, zt) is the LT coordinate to be determined. L0 is the initial distance from the LT to the cat’s eye reflector, which is unknown. ΔLi is the measured distance deviation from the LT.
2.3. ATLI Measurement Principle and Effects of Positioning and
Angular Error
The measurement of ATLI requires only the length information. The motion of a three-axis machine tool comprising 21 error terms results in the ideal and ac-tual distance differences in the ATLI’s coordinate determination. Figure 2 illu-strates how the influence of ISO 230-2/-6 tests on the x-axis motion with squareness error is estimated.
In Figure 2, the solid horizontal and vertical lines represent the x- and y-axes of the machine tool, respectively. The dotted lines represent the variation in the straightness deviation of θx in the x-axis motion (i.e., its trajectories), which is recorded as the long the axis length. Δx, Δy, and Δz are the shift distances be-tween the actual and estimated location coordinates of the LT determined from Equation (1). The measurement points are (xi, yi, zi) at different times, i. The length measured by the LT is Lt and t indicates the measuring point at each time. As shown in Equations (2) to (3), ΔLi+1 and ∆Li′+1 indicate the ideal and actual distance differences, respectively, at the durations of ti and ti+1, respectively.
(
2 2 2) (
2 2 2)
1, 1 1 1
i i i i i i i i
L+ x+ y+ z+ x y z
∆ = + + − + + (2)
(
2 2 2) (
2 2 2)
1, 1 1 1
i i i i i i i i
L′+ x′+ y′+ z′+ x′ y′ z′
∆ = + + − + + (3)
For the effects of positioning and angular error, we consider Figure 2 as a gantry structure. The rigid-body kinematic model of the gantry structure is shown in Figure 3. This gantry is constructed from a moving table as the x-axis and a fixed gantry that represents the y- and z-axes.
DOI: 10.4236/wjet.2018.63039 634 World Journal of Engineering and Technology
Figure 2. Influence of ISO 230-2/-6 test results on squareness of machine tools using an ATLI.
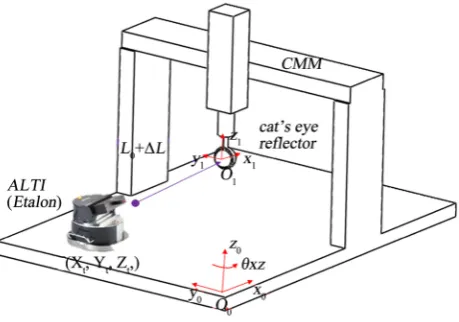
Figure 3.CMM appearance and each coordinate frame of the
structure.
the reference ball inside the instrument. L0 + ΔL is the measured distance be-tween the ranging instrument and the moving target because, here, incremental interferometer is considered.
Let [sxsysz]T be the ideal position and LV be the measuring line along the dis-tance on the V-axis; subsequently, the simulated position [ŝx ŝy ŝz]T with errors can be expressed as
ˆ ˆ ˆ
x x xx
y y yx
z z zx
s s
s s
s s
δ δ δ +
= +
+
(4)
Considering a coordinate position shift [εxεyεz]T and scale errors gx of the po-sition errors, the movement can be described as follows:
ˆ ˆ ˆ
x x x x x xx
y y y yx
z z z zx
s g s g
s s
s s
ε δ
ε δ
ε δ
+ +
= + +
+ +
(5)
[image:4.595.260.490.262.423.2]DOI: 10.4236/wjet.2018.63039 635 World Journal of Engineering and Technology
cos 0 sin cos sin 0
0 1 0 sin cos 0 0 0
sin 0 cos 0 0 1 0 0
xx x x x x x x
yx x x
zx x x
s s
δ β β γ γ
δ γ γ
δ β β
−
= −
−
(6)
here, γx is the squareness error of the x-y axis and βx is the squareness angle of the x-z axis.
3. Experimental Results and Discussion
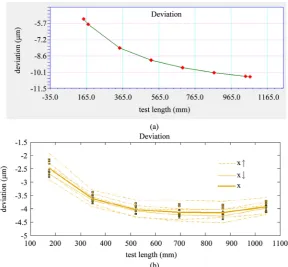
[image:5.595.230.519.436.703.2]The experimental setup was based on a three-axis CMM (Leitz PMM-C) in the National Measurement Laboratory in Taiwan; it is a gantry structure with an x-axis of 1400 mm, a y-axis of 700 mm, and a z-axis of 600 mm. The simulation software was developed in VB.NET. Considering Equations (5) and (6), we set the squareness error of the x-y axis to 0.1˚, which is a common scale for squareness in machine tools or CMM assembly lines. The simulated and experimental results are plotted in Figure 4. The plotted line shows an exponential curve because the squareness error will lead to a misalignment error between the ATLI location and measurement path. As shown in Figure 4, the curve of the experimental result is 1.5 μm in the range of −2.5 μm to −4 μm, and the estimated accuracy is 4.5 μm, which is only slightly different from the simulated result. This offset was due to the deviation between the actual and estimated ATLI location coordinates. Thus, we can confirm the ATLI location from the initial measuring point, which is at t1. As shown in Figure 4(b), when the linear positioning errros and squareness errors are simultaneously generated, the deviation first decreases and subsequently increases with the increasing test length.
DOI: 10.4236/wjet.2018.63039 636 World Journal of Engineering and Technology
4. Conclusion
This research focused on simulating the measurement results of an auto-tracking ranging system and analyzing trends in the deviation results. The experimental results indicated a significant difference between positioning and squareness er-ror when only one axis was measured using an ATLI. From the plotted trends in the simulated and experimental results, we can identify and quantify linear and squareness errors, and thus ensuring that ATLIs can be used to perform machine tool inspection more easily and conveniently. Compared with traditional inter-ferometers, auto-tracking facilitates easier optic alignment setup, especially for diagonal line measurements of machine tools.
Acknowledgements
The work was supported by the standard maintenance and services project from Bureau of Standards, Metrology and Inspection (BSMI), Ministry of Economic Affairs (MOEA).
Conflicts of Interest
The authors declare no conflicts of interest regarding the publication of this pa-per.
References
[1] Zhang, G., Ouyang, R., Lu, B., Hocken, R., Veale, R. and Donmez, A. (1988) A Dis-placement Method for Machine Geometry Calibration. CIRP Annals-Manufacturing Technology, 37, 515-518. https://doi.org/10.1016/S0007-8506(07)61690-4
[2] Ptaszyñski, W., Gessner A., Frąckowiak P. and Staniek, R. (2011) Straightness Mea-surement of Large Machine Guideways. Metalurgija, 50, 281-284.
[3] International Organization for Standardization (2002) ISO 230: Test Code for Ma-chine Tools, in Part 6 Determination of Positioning Accuracy on Body and Face Diagonals.
[4] International Organization for Standardization (2012) ISO 230: Test Code for Ma-chine Tools, in Part 2: Determination of Accuracy and Repeatability of Positioning Numerically Controlled Axes.
[5] Lau, K., Hocken, R.J. and Haight, W.C. (1986) Automatic Laser Tracking Interfe-rometer System for Robot Metrology. Precision Engineering, 8, 3-8.
https://doi.org/10.1016/0141-6359(86)90002-4
[6] Muralikrishnan, B., Phillips, S. and Sawyer, D. (2016) Laser Trackers for Large-Scale Dimensional Metrology: A Review. Precision Engineering, 44, 13-28.
https://doi.org/10.1016/j.precisioneng.2015.12.001
[7] Physikalisch-Technische, B. (2004) Laser Interferometer for Spacing Measurement has Reference Sphere Positioned on Post and Base Plate Made of Thermally Inva-riant Material (TRACER). German Patent No. 202004007647U1.