731
A SUITABILITY ANALYSIS OF ELEMENTARY SCHOOLS -
BASED GEOGRAPHIC INFORMATION SYSTEM (GIS)
A CASE STUDY OF MUKALLA DISTRICTS IN YEMEN
1
WALEED LAGRAB, 2NOURA AKNIN
Information Technology and Modeling Systems Research Unit Computer Science, Operational Research, and Applied Statistics Laboratory
Abdelmalek Essaadi University, Tetouan 93000, Morocco 1
[email protected], [email protected]
ABSTRACT
Equitable-spatial distribution is a significant component of urban planning which should be guided by sustainable development strategies. This paper presents the suitability analysis for elementary school (ES) in Mukalla city; it measures the accessibility of educational services, and the different between the residential requirements and supply offered of ES. It has also proposed a GIS model based on suitability analysis to figure out the suitable location for a new ES and the alternative site for existing ESs, to make it more suitable. The results have shown that overall districts have suffered a shortage of schools. As well as spatial inequity in services provision. It would also be inappropriate distribution because its proximity from land uses (i.e. Fuel station, highway, industrial area) which pose a risk to the health and safety of pupils.
Keywords: Spatial Distribution, Suitability Analysis, Equitable, proper location, Elementary School.
1. INTRODUCTION
In developing countries, many patterns and trends dominate the population growth. Over the last year, many of urban regions have experienced considerable growth where the majority live in urban settlements. This increase requires Infrastructure development and provide adequate services for residential[1]. Consequently, this would lead to spatial inequality in service provision. However, distribution services to residential settlements have to be provided by planning and take into account a spatial multi-criteria. Spatial equity assesses and measures the relationship between neighborhood demographic and population need and neighborhood accessibility to services. Equity evidence would provide if neighborhoods with high need had better access to this services[2]. The assessment of spatial equity is useful for urban planners and decision makers to uncover the area of under-provision, to assess the effectiveness of existing urban services-provision policies [3]. Spatial equity has implemented through the geographical distribution in combination with multi-criteria decision system (MCDS) based on geographic information system (GIS). GIS is using for presenting the maps associated with an attribute as spatial information that is spatially referenced
to the Earth's surface[4], the spatial information (SI) is the hearth of GIS, where storing and manipulating the enormous amount of data [5]. GIS is applied in many developed countries, the trend towards for use in educational facilities mapping to support decision-making, especially in Ministries of Education[6]. The GIS could also be used for many different purposes in educational service planning and management; it is powerful tools for determining the accessibility variables [7],[8].
732 and land use. Also taking into account the urban expansion in those areas and assessment of needs the future population in respect of educational services[11]. Spatial data analysis problems usually involve a broad range of possible alternatives and same evaluation criteria. Alternatives often evaluated by some individual’s decision-maker, managers and stakeholders[12].
1.1 RELATED Works
The spatial distribution has attracted considerable attention in recent years. More recent research in spatial analysis techniques. Taleai et al. [2], this study has introduced an Integrated Spatial Equity Evaluation (ISEE) framework based on spatial multi-criteria analysis to assess spatial equity; it measured the balance between demands generated by residential areas and supply offered by civil services at various spatial scales. Al-Rasheed et al. [13], it utilized the GIS and spatial analysis to inventory, map, and analyze the Ministry of educational facilities in Kuwait. moreover, unoccupied land reservations with a goal of improved planning and decision making, this work showed the huge percent of districts that have no schools failing to meet the minimum standard of population needs of educational facilities. Olubadewo et al. [14], this paper also analyzed the spatial distribution of Primary schools in KANO state in NIGERIA, this work aimed to create an inventory of the schools in the study area. It analyzed the pattern of the schools in the area and created a geodatabase for the primary schools in the study area. The spatial analysis showed that the distribution of primary schools in the area is more concentrated in many districts, and the buffer zones showed that many schools are closer to the main roads. Ahmad [15], he aimed to use a GIS-based case study approach and spatial accessibility measures, derive from fine spatial resolution datasets, to characterize and reveal spatial variations in access to health care facilities and identify disadvantaged locations / local communities in a selected urban fringe area in Melbourne, Australia. Lotfi et al. [16], this work targeted two important goals. First, it attempted to create a new methodology for measuring physical accessibility to public places such the park, school, and shop at the neighborhood scale and the second is investigated the distribution of such spaces by examining the socio-economic status of citizens. Oh and Jeong [17], they analyzed pedestrian accessibility to urban parks in Seoul and the subsequent serviceability of the parks.
Almost all previous studies have contributed to solving the spatial equity distribution of public services. Some of them introduced a spatial data analysis of public service locations (Educational facility, Healthcare facility, Parks) and others measured the accessibility to those services. There are various studies in the different field be concerned to the suitability analysis such [18], it has proposed a method to analyze the suitability of land based on soil and water resource and predicts the yield.
Our study delivers a distinct assessment of ES. It introduces a GIS Model based on the suitable location of educational facilities. This paper also measures the accessibility based on network analyst that calculates the actual distance that the pupil needs to access into nearest school. As well as, the terrain's surface Digital Elevation Model (DEM) has been carried out in this study as a major criterion in suitability analysis. Finally, this work involves descriptive and spatial analysis of ESs in the study area.
1.1 Problem And Motivation
Since the establishment of schools in the study area over the past years, which focus on hustle and paralyzed traffic in many main streets, due to the lack of geographical distribution of schools. More populated areas have not had enough schools to accommodate the growing number of pupils. Also, the existing facilities do not take into account multi-criteria analysis, especially new ones. Wherefore, spatial equity principle could have been implemented in the distribution of educational services, in order to extend to all residents in urban and rural regions. Besides that, schools have to be far from highways and industries risk. This study will be assisted the decision-maker to determine the most suitable sites for publishing educational building. Consequently, the spatial equity of educational services distribution will be reached. The suitability analysis for school locations probably limits or reduces the school drop-out. Especially, the Yemen, famous for working children[19]. This study considers the first survey in the spatial distribution of ES based on a geographic information system in Hadramout province[20]. We have also implemented a similar study for kindergarten in the Mukalla city[9].
1.2 Study Area
Mukalla City is a capital of Hadramout province, it is located on the Arabian Sea coast in the south of Yemen, as shown in
733 fishing centers as well as many fishery factories. Many public markets and beautiful coasts where the people can enjoy swimming and lying down under the sun. It is located between latitude 140 25.843’N to latitude 140 34.460’N and longitude 49 1.469’E to longitude 49 14.355’E. After the reunification of North and South Yemen in 1990, Mukalla city witnessed a major change, especially with the distribution of land in the four-year period between 1990 and 1994. In the year 1994, the city’s population was about 116000 which have increased to present populations of 180000 (estimates of the year 2004) with an annual growth rate of 3.8%[21]. Around 16% of the total population in Hadramout lives within this city. After 1994, the city observed a significant construction boom, financed mainly by Yemeni expatriates and local investors, as well as Saudis with Yemeni origins. The Mukalla city has developed over the years in a linear fashion along the coastline in an east-west direction, covering a distance of 161,749 km2 between Fowah to the west and Rayan to the east, but with only 5% of the population. Still, it is estimated that over 80% of the population live in the city center [22].
1.2 Data Type Collected
1) Raster layer: Image satellite for the study area, with extension “.TIF” in 2013 with Geographic Coordinate System (WGS) 1984, UTM Zone 39N.
2) Vector layer: includes schools and land use as (Points), network roads as (Lines), districts and zone boundary as (Polygons).
3) Digital Elevation Model: NASA, ASTER GLOBAL Digital Elevation Model V002,
acquisition date: 2011/10/17 with 300m resolution, entity ID: ASTGDEMV2 0N14E049
2. EDUCATIONAL SERVICES PLANNING
Educational services planning includes a broad range of educational planning and management issues; it relates the resource allocation and efficiency in the provision of services to improve the effectiveness of education. Therefore, spatial analysis is a tool commonly used to detect relationships among schools and pupils distribution in the particular area[23].
In Yemen, the schooling is divided into three stages before university education (kindergarten, elementary, secondary); the elementary education is important at the age 7-16, this period configures the child’s personality. Unquestionably, the skills and information are gained in this age. Table 1 presents the standard criteria for ES (i.e., each 800-pupil must receive at least one’s school with an area of 110,000M2; this area includes buildings, recreational spaces, and services).
2.1 MCDS OF ESTABLISHING THE ES
734
Figure 1. Political Map Of The Republic Of Yemen, And Study Area Districts.
Source: General Authority For Land Survey And Urban Planning – Hadramout.
[image:4.612.89.302.525.675.2]Here, we will address the spatial and quantitative conditions that must be available in schools. Making a site of educational facilities on the main road for vehicles makes students at risk at any moment as a result of the wrong choice of the school site, especially when they came out motivated. In addition to obstruction of traffic vehicles, consequently, the school locations should be in a suitable location spatially and compliance with specific criteria for construction and equip each educational facility. Table 1 illustrates some of the standard criteria of the ESs [27],[28],[29].
Table 1: describes the international standard criteria for ESs
Criterion ES Aged (7-16)
Distance from residence to school
(Kilometer) 0.4-0.8 Distance from residence to school
(Minute) 8-16
# Pupils / school(student) 800-1200
# Classroom / school (Class) 30-40
# Student / Class (Student) 27
# of Levels (Level) 9
School Area (1000M2) 110
Area for each Student / Area (Meter) 8 (M2)
3. GIS MODEL-BASED LOCATION
SUITABILITY OF EDUCATIONAL FACILITIES
A GIS Model-Based suitable Location of Educational Facilities (GIS-SLEF) that assimilates acquired data could be implemented to identify most proper locations for schools. This identification of prospective locations is a prerequisite to assess multiple aspects such distance, time, cost, and perils dependent on multicriteria. The GIS_SLEF methodology involves modeling with the ArcMap 10.x Model Builder (MB) to identify most suitable locations in the study areas based on a proximity of existing schools, Land use, space area, and Landsat thematic mapper imagery of the DEM.
3.1 Input Data Layer For The GIS-SLEF Model
735 3.2 GIS-SLEF Model Analysis
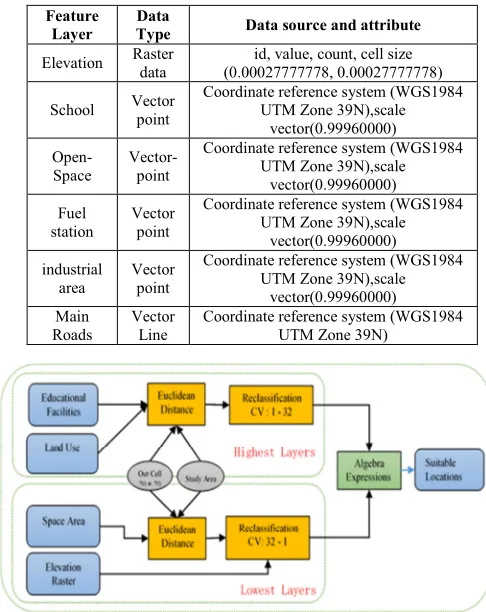
[image:5.612.313.550.306.408.2]The vector data layer should be converted to cells data raster either by using the ED tool or using kernel density(KD) with output grid cell size (20m×20m), We prefer ED tool which enables the combination of layers by delivering value to every location. The generated grids (raster) need to reclassify with the same class range, for instance, range value from one to ten for all grids. A higher value for grids indicates a higher suitability. Thus, our model involves two groups of grid layers, the first called Highest layers that are reclassified from 1 to 10 (Low-high) respectively, and the second named Lowest Layers have been classified by range from 10 to 1 (high-low). Therefore, the suitability site in the Highest layers is the farthest location from the grid layer (i.e., Fuel station, existing schools, industrial area), and the suitability site in the Lowest layers is the closest location from the grid layer (i.e., Elevation, open space). Figure 2. Illustrates the workflow of GIS-SLEF model, starting with data entry and ending with applying the algebra expression to produce the most suitable locations.
Table 2. Describe The Fundamental Data Type Of GIS-SLEF Model
Feature Layer
Data
Type Data source and attribute
Elevation Raster data
id, value, count, cell size (0.00027777778, 0.00027777778)
School Vector point
Coordinate reference system (WGS1984 UTM Zone 39N),scale
vector(0.99960000)
Open-Space
Vector-point
Coordinate reference system (WGS1984 UTM Zone 39N),scale
vector(0.99960000) Fuel
station
Vector point
Coordinate reference system (WGS1984 UTM Zone 39N),scale
vector(0.99960000) industrial
area
Vector point
Coordinate reference system (WGS1984 UTM Zone 39N),scale
vector(0.99960000) Main
Roads
Vector Line
[image:5.612.63.306.395.701.2]Coordinate reference system (WGS1984 UTM Zone 39N)
Figure 2. Workflow of GIS-SLEF Model
3.3 Model Builder Environment
ArcGIS’s Spatial Analyst includes various kinds of powerful spatial analysis modeling. It could derive many geospatial data such as terrain analysis, spatial relationships, suitable locations, and the accumulated cost of the accessibility (Ahmed and Asmael 2009). One of the most significant contributions of this study is to identify the most suitable areas where new schools can be established. The GIS-SLEF model implemented through the ESRI’s Model Builder environment and spatial analyst tools. The GIS-SLEF model involves the problem definition, criteria selection, multicriteria’s weights, grid data transformation, spatial data analysis implementation, and selected area. Figure 4 4 explains the implementation process of GIS-SLEF model.
Figure 3. Model Builder ArcGIS 10.X Workflow Based On GIS-SLEF Model
4. SPATIAL ANALYSIS OF ELEMENTARY SCHOOLS
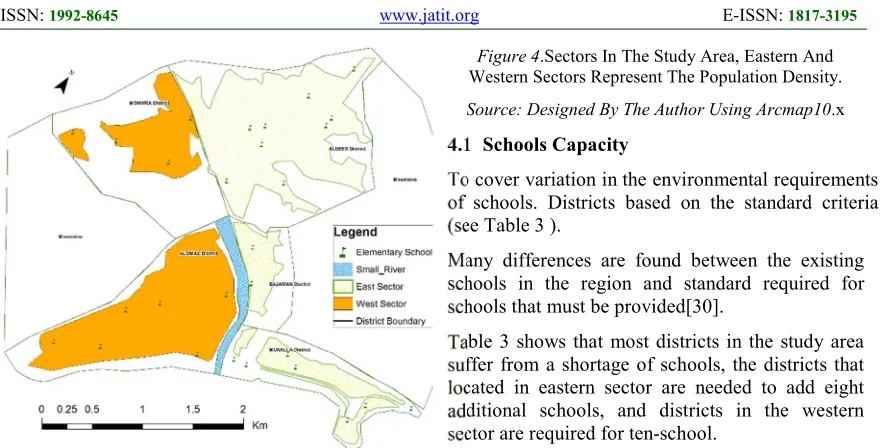
The study area has been divided into two sectors (Eastern sector and Western sector) as shown in Figure 4; each sector contains many districts. The quantitative analysis and spatial analysis are implemented in this sectors, through analysis the absorptive of schools, distribution style, accessibility, and land uses by using the Spatial Statistics tools (Spatial Analyst and Analysis Tools) that are available in ArcMap10.x
736
Figure 4.Sectors In The Study Area, Eastern And
Western Sectors Represent The Population Density.
Source: Designed By The Author Using Arcmap10.x
4.1 Schools Capacity
To cover variation in the environmental requirements of schools. Districts based on the standard criteria (see Table 3 ).
Many differences are found between the existing schools in the region and standard required for schools that must be provided[30].
[image:6.612.88.527.324.434.2]Table 3 shows that most districts in the study area suffer from a shortage of schools, the districts that located in eastern sector are needed to add eight additional schools, and districts in the western sector are required for ten-school.
Table 3: School Distribution And Population Density According To Census 2004
Sector District Existing Schools
Standard Required Schools N/Sa
Needs remain of schools
Population
2014b N:=Aged 7-16 (23%)b
Eastern Sector
Mukalla 7 11 4 47933 11025
Aldees 9 12 3 49998 11500
Bajaman 2 3 1 12032 2767
Western Sector
Alomal 6 16 10 68573 15772
Monwra 4 4 0 15708 3613
Total 28 46 18 194244 44677
a: #. of pupils per school, as in table1 from (800-1000) pupils.
b: Sources: According to the Censusin 2004 and an annual increase of 3.8%(see the section of the study area)
4.2 Accessibility
To know the distance traveled and time among schools and pupils resident, we used spatial analysis tools that are available in ArcGIS (i.e. Point Distance and Network analysis).
Point Distance tool helps to measure the distance as straight-line and the distance as an area scope depending on the road tracks. Network Analysis is used in this work to calculate the actual distance that the pupil needs to access into nearest school based on the road network.
4.2.1 Network analysis
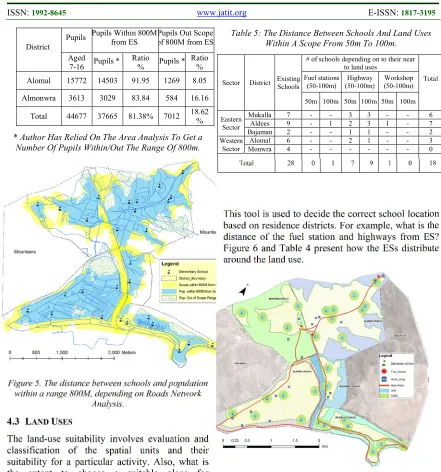
The Euclidean Distance using to measure the distances traveled of students to their schools based on the Euclidean distance. In other words, it measures with straight-line distances between home and nearest school, and not the actual distance traveled. Estimating accurate distances using roads network analysis would be possible. The distances traveled to schools have to be between 400-800 meters (see Table 1). However,
[image:6.612.311.517.629.727.2]the parents cannot determine exactly the location of the school for their child, especially that each school has only a certain number of places available[31]. Figure 5 shows many places are far from ES in all districts, although the number of schools needs to increase as shown in Table 3. The distance between schools and pupil housing was determined with 800-meter based on roads; we found around 18.62% are a disadvantaged area, and the reason being that the populated area far away from the existing schools. In the other word, there are 7012 pupils outside of this range as shown in Table 4, these pupils need more than 16 minutes to reach the nearest school.
Table 4: Pupils within a range and out range scope 800m
District
Pupils Pupils Within 800M from ES
Pupils Out Scope of 800M from ES Aged
7-16 Pupils * Ratio
% Pupils * Ratio % Mukalla 11025 8882 80.56 2143 19.44
Aldees 11500 8704 75.69 2796 24.31
737 District
Pupils Pupils Within 800M from ES
Pupils Out Scope of 800M from ES Aged
7-16 Pupils * Ratio
% Pupils * Ratio % Alomal 15772 14503 91.95 1269 8.05
Almonwra 3613 3029 83.84 584 16.16
Total 44677 37665 81.38% 7012 18.62 %
* Author Has Relied On The Area Analysis To Get a
Number Of Pupils Within/Out The Range Of 800m.
Figure 5. The distance between schools and population within a range 800M, depending on Roads Network
Analysis.
4.3 LAND USES
The land-use suitability involves evaluation and classification of the spatial units and their suitability for a particular activity. Also, what is the extent to choose a suitable place for residential neighborhoods and public service? The land uses mapping and analysis is one of the most useful applications of GIS for spatial planning and management[32],[33],[34]. Multiple Ring Buffer tool was used to make a spatial analysis of some of the land uses, especially, that may adversely affect the educational services.
4.3.1 Multiple ring buffer (MRB)
[image:7.612.83.524.66.538.2]MRB tool Creates multiple buffers at specified distances around the input features; these buffers could be merged and dissolved using the buffer distance values to create non-overlapping buffers[35],[36].
Table 5: The Distance Between Schools And Land Uses Within A Scope From 50m To 100m.
Sector District Existing Schools
# of schools depending on to their near to land uses
Total Fuel stations
(50-100m)
Highway (50-100m)
Workshop (50-100m)
50m 100m 50m 100m 50m 100m
Eastern Sector
Mukalla 7 - - 3 3 - - 6 Aldees 9 - 1 2 3 1 - 7 Bajaman 2 - - 1 1 - - 2 Western
Sector
Alomal 6 - - 2 1 - - 3 Monwra 4 - - - 0 Total 28 0 1 7 9 1 0 18
This tool is used to decide the correct school location based on residence districts. For example, what is the distance of the fuel station and highways from ES? Figure 6 and Table 4 present how the ESs distribute around the land use.
Figure 6. Shows the school's scope between 50m-100m.
Source: Designed by the Author, using ArcMap10.
5. PRACTICAL APPLICATION OF GIS-SLEF MODEL IN ES FACILITY
738 needs reclassification based on the importance of proximity and far away from existing schools.
Table 6. Presents distances of main class criteria
Class Value
Main Class Distance (meter)
Elevation Schools Fuel Station Space Area Workshop 1 353-393 0-179 0 - 370 2355-26216 0 - 260 2 314-353 179-359 370 - 740 2093-2355 260 - 521 3 275-314 359-539 740 - 1110 1831-2093 521 - 782 4 235-275 539-719 1110-1480 1570-1831 782 - 1043 5 196-235 719-989 1480-1850 1803-1570 1043-1304 6 157-196 989-1078 1850-2221 1046-1803 1304-1565 7 117-157 1078-258 2221-2591 785-1046 1565-1826 8 78 - 117 1258-1438 2591-2961 523-785 1826-2087 9 39-78 1438 - 1617 2961 - 3331 261-523 2087-2348 10 0-39 1617-1797 3331-3701 0-261 2348-2608
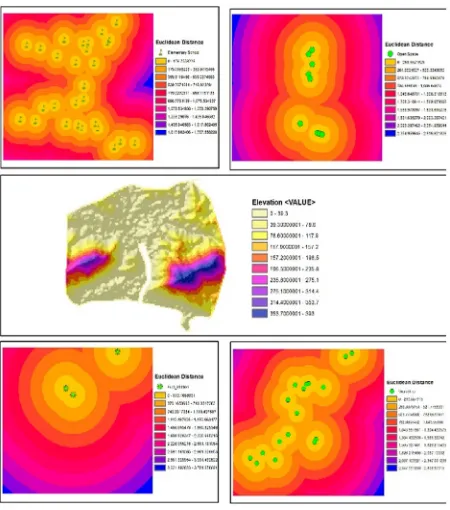
[image:8.612.76.301.328.583.2]We have classified the distance and elevation with a range number from 1 to 10 as shown in Table 6, whereas the high value is the best value.
Figure 7: Raster dataset of straight line distance for feature class distribution and study area elevation.
Source: designed by the author using ArcMap10.
The conditions also have standard weights; these weights represent one hundred percent, as shown in Table 7.
Table 7: The Criteria To Be Pursued To Decide The Most Suitable Site For A New Elementary School.
Conditions / Criteria
Euclidean Distance
Classification Value
Weight * Near – far Unsuitable Location
– Suitable Location
Elevation 10 - 1 1 - 10 45 %
ES 1 - 10 1 - 10 15 %
Open Space 10 - 1 1 - 10 15 % Fuel station 1 - 10 1 - 10 12.5 %
Workshop
area 1 - 10 1 - 10 12.5 %
(*): The weights were distributed according to the Author’s viewpoint, depending on the importance of criteria.
The ratios of weights were determined according to Author’s viewpoint depending on the importance of these criteria and their impact on educational establishment.
5.1 Data Visualization And Evaluation
The process of data visualization allows to examine data from all possible sides and to place images in context with their surroundings. In most cases helps to establish the link between abstract imagery and real places[26]. ArcGIS Spatial Analyst includes advanced map algebra functions that can be combining several maps, performing suitability analysis and assigning weights.
To presentation the data visualizing, we need to apply the equation of suitability that is given by:
∶
∶
∶
Whereas the total of should be equal 1 or hundred percent, for example:
70.45 ∗ = > ? 0.15 ∗ @ ? 0.15
∗ A B ? 0.25 ∗ = D
Restrictions represents limitations of criteria for instance:
7
GHIJK∗
LMNOPQRSTU∗
VHWXKYHZ739 The Map Algebra (MA) expression consist of classified raster(s) which represent the criteria or conditions to select the suitable locations for establishment of new schools as follows:
7^R
ECLASS_E
LEVATIONj
∗
0.45
?
^R
ECLASS_
E
LEMENTARY_
SCHOOLj
∗
0.15
?
^R
ECLASS_O
PEN_S
PACEj
∗
0.15
?
^R
ECLASS_F
UEL_
STATIONj
∗
0.125
?
^R
ECLASS_
W
ORKSHOPj
∗
0.125D
The finding of this expression is a heat map illustrates high and low density. Therefore, the hinge value represents the best locations as shown in Figure 8, and it is easy-to-understand and intuitively appealing to decision-makers.
[image:9.612.308.523.148.341.2]The new raster specifies the best area with high value as identified (see Figure 8), it must be closer to the 10. However, the value outcome between 2.75 and 8.25, this indicates that there is no typical fit area could verify all previous conditions. However, the density area with high value considers the available best locations to build a new elementary school in the study area.
Figure 8: Heat Map illustrates the best locations in the high-density area.
Source: designed by the author using ArcMap10.x
6. PROPOSED ALTERNATIVE SITES.
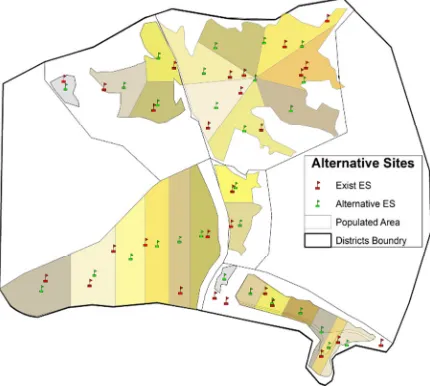
The ES in the study area have often been distributed spatially with an inequity, where it was observed, during data collection that many of ES’s buildings in study area either have been rented or ancient buildings, they have not been maintained for a long time. For this reason, we attempted to propose a novel pattern would improve the spatial redistribution for existing ES. This pattern based on the subdivision of the populated area into equal sub-area using three methods: (1) Centrally (2) Horizontally (3)
Vertically, and determine the population center (centroid) as the best alternative site-see Figure 9. This pattern could also be rotated to obtain a model fits with reality.
Figure 9. Proposed Alternative Suites for Exist ES
7. RESULTS
The Results of the spatial data analysis showed that the elementary schools available in the study area are 28 schools, they distributed on two sectors; the eastern sector includes 18 ES, and the western sector includes ten ES, noted that there is a shortage in the required ES. The area needs around 18 new ESs, as shown in Table 3, these requirements were considered of the census in 2014, when looking forward into 2025 with an annual increase 3.8%, the schools needed to be 69 ES. The transfer time of pupils from their home to the nearest school as shown in Table 4, observed that around 18.62 of the populated area have deprived of accessibility to ES, whereas the distance between this area and school exceed of 800m. Hence, the pupil needs more than 20 minutes to reach the nearest school, according to Table 1 that the time does not exceed 16 minutes. In additional, many schools have been located close to land use, such as (fuel station, main road and workshop). As shown inTable 5, there are 18 schools located close to the land uses with a range (1-100) meter. Aldees district located one school close to the fuel station in the range of 100 meters. Almonwra district is the only far from all land uses that are a danger and inconvenience to the pupils.
[image:9.612.78.302.380.534.2]740 specified the most suitable locations with high value as identified (see Figure 8), it must be closer to the 10, whereas the value outcome between 2.04 and 8.76, this indicates that there is no typical location could achieve all previous criteria. Nevertheless, the density area with high value considers the available most suitable locations to build a new KG in the study area. Finally, the geographic database was created in this study that can be referenced in the future by researchers to improve public service in Mukalla city.
8.
RECOMMENDATIONS:
Numerous challenge of schooling facing the local authority. Although, we have not found standard criteria are relied upon to establish schools, the regional, and international multi-criteria were adopted in the analysis and assessment of the study area. This work probably assists to make the right decision. It makes a set of recommendations in that regard:
1) Reserving open spaces, especially that is located in most suitable locations.
2) Search for alternative sites for schools that situated in unsuitable locations.
3) Acquire the spatial and non-spatial data for all demographics and public services in the study area.
4) Build a geographic database involves all acquired data and drop it on a computer system-based GIS.
5) Rehabilitation a specialized staff in GIS applications within Ministry of Planning and GALSUP.
6) Adoption of standardized criteria for the establishment of educational facilities and circulated to the competent authorities.
7) Replanning for unsigned land’s plan and take into account the multicriteria-based GIS and remote sensing application.
9. CONCLUSION
GIS has powerful tools are used for spatial analysis of educational services patterns. It helps to identify the spatial pattern of equitable distribution for many services. It would be supported the decision-maker to make deliberate scientific decisions. Whereas the Yemen is a developing country that has a rapid urbanization growth rate of 3.8% annually, according to the ministry of statistic, which require an efficient planning for infrastructure to meet the population
growth, that also has need of an urgent plan to resolve this critical problem. This paper proposed a GIS-SLEF model that probably be used to improve and monitor the suitability analysis for many services industry (i.e., health care facility, fire station, worship places, community center, etc.), whereas each sector has different special multi-criteria. However, the study area that requires developing a planning strategy must have a geographic and non-geographic database about demographics by (i.e., gender, age, spatial distribution, urban and rural region, etc.), and sufficient information about the relevant sector and the target audience. The GIS-SLEF application model demonstrates the efficiency of GIS in the suitability analysis and the assessment of land use suitability, wherefore, the educational facilities have to be located in positions far from land uses that would have an influence on the pupil health, pupil safety, and quality of education. This phase was begun with acquiring, repair and analysis data to find out the weaknesses in the prior distribution. The proposed GIS-SLEF model presented a solution for identifying the most suitable location for constructing the new schools to stop making the same mistakes in the distribution of new schools, also suggest an alternative location for existing schools. Nevertheless, the proposed model has some limitations and can be promoted from further enhancement. The area that located with elevations below sea level will be considered most suitable, this issue is a rare occurrence, and these areas can not be excluded because it is possible to be certainly suitable sites. Furthermore, the blocks or districts in the study area should be close together without large distance. Finally, the Euclidean distance of a polygon would not be sufficiently accurate. Therefore, need to be converted to a point, it often gives better outcomes.
This work deserves the future research. Thus, it demands to focus towards for further expansion and acquiring more descriptive and spatial data about the public service and community centers, to implement a knowledge discovery in database framework-based suitability system and validation of the systems through interaction with MCDS.
REFERENCES:
[1] Cohen B. Urbanization in developing countries: Current trends, future projections, and key challenges for sustainability. Technol Soc 2006;28:63–80.
doi:10.1016/j.techsoc.2005.10.005.
741 analysis. Cities 2014;40, Part A:56–69. doi:10.1016/j.cities.2014.04.006.
[3] Smoyer-Tomic KE, Hewko JN, Hodgson MJ. Spatial accessibility and equity of playgrounds in Edmonton, Canada. Can Geogr Gographe Can 2004;48:287–302. doi:10.1111/j.0008-3658.2004.00061.x. [4] ERAY O. Application of Geographic
Information System (GIS) in Education. J Tech Sci Technol 2013;1:53–58.
[5] Iyengar J. Application of geographical information systems. J Int Inf Manag 1998;7.
[6] Korucu MG. GIS and Types of GIS Education Programs. Procedia - Soc Behav
Sci 2012;46:209–15.
doi:10.1016/j.sbspro.2012.05.095.
[7] Attfield I, Tamiru M, Parolin B. Improving Micro-Planning in Education through a Geographical Information System: Studies on Ethiopia and Palestine. UNESCO; 2001. [8] Kong F, Yin H, Nakagoshi N. Using GIS
and landscape metrics in the hedonic price modeling of the amenity value of urban green space: A case study in Jinan City, China. Landsc Urban Plan 2007;79:240–52. doi:10.1016/j.landurbplan.2006.02.013. [9] Lagrab W, Aknin N. Analysis of
Educational Services distribution-Based Geographic Information System (GIS). Int J Sci Technol Res 2015;4.
[10] Shquair H. Distribution and Planning of the Educational Services in Salfeet Governorate Using Geographical Information Systems (GIS). An-Najah National University-Nablus, 2009.
[11] Mörtberg UM, Balfors B, Knol WC. Landscape ecological assessment: A tool for integrating biodiversity issues in strategic environmental assessment and planning. J Environ Manage 2007;82:457–70. doi:10.1016/j.jenvman.2006.01.005. [12] Malczewski J. GIS‐based multicriteria
decision analysis: a survey of the literature. Int J Geogr Inf Sci 2006;20:703–26. doi:10.1080/13658810600661508.
[13] Al-Rasheed K, El-Gamily H. GIS as an Efficient Tool to Manage Educational Services and Infrastructure in Kuwait. J Geogr Inf Syst 2013;05:75–86. doi:10.4236/jgis.2013.51008.
[14] Olubadewo OO, Abdulkarim IA, Ahmed M. The Use Of GIS As Educational Decision Support System (EDSS) for Primary
Schools in Fagge Local government Area of Kano State, Nigeria. 2013.
[15] Ahmad S. A GIS based investigation of spatial accessibility to health care facilities by local communities within an urban fringe area of Melbourne 2012.
[16] Lotfi S, Koohsari MJ. Measuring objective accessibility to neighborhood facilities in the city (A case study: Zone 6 in Tehran, Iran).
Cities 2009;26:133–40.
doi:10.1016/j.cities.2009.02.006.
[17] Oh K, Jeong S. Assessing the spatial distribution of urban parks using GIS. Landsc
Urban Plan 2007;82:25–32.
doi:10.1016/j.landurbplan.2007.01.014.
[18] Parimala M, Lopez D. Decision Making in Agriculture Based on Land Suitability – Spatial Data Analysis Approach 1 2012.
[19] International Labour Organization. Working children in the Republic of Yemen: The results of the 2010 National Child Labour Survey. 2010.
[20] MOE. Ministry of Education - Hadhramout 2014.
[21] The World Bank. Second Port Cities Development Project in Yemen 2010.
[22] National Information Center - Yemen 2015. http://www.yemen-nic.info/english_site/ (accessed December 1, 2014).
[23] Olubadewo OO, Abdulkarim IA, Ahmed M. The Use of Gis as Educational Decision Support System (EDSS) For Primary Schools In Fagge Local Government Area of Kano State, Nigeria 2013;4:614–24.
[24] Janssen R, Rietveld P. Multicriteria analysis and geographical information systems: an application to agricultural land use in the netherlands. In: Scholten HJ, Stillwell JCH, editors. Geogr. Inf. Syst. Urban Reg. Plan., Springer Netherlands; 1990, p. 129–39. doi:10.1007/978-94-017-1677-2_12.
[25] Jiang H, Eastman JR. Application of fuzzy measures in multi-criteria evaluation in GIS. Int J Geogr Inf Sci 2000;14:173–84. doi:10.1080/136588100240903.
[26] Malczewski J. Integrating multicriteria analysis and geographic information systems: the ordered weighted averaging (OWA) approach. Int J Environ Technol Manag 2006;6:7–19. doi:10.1504/IJETM.2006.008251.
742 [28] Sayed-Ahmed M, Shehata E, Sennah K.
Development of creep model for structural insulated timber-foam sandwich walls under sustained soil pressure in basements of residential buildings. Proc Al-Azhar Univ. Eng. Conf., vol. 5, 2010, p. 603–614. [29] Wang J-J, Jing Y-Y, Zhang C-F, Zhao J-H.
Review on multi-criteria decision analysis aid in sustainable energy decision-making. Renew Sustain Energy Rev 2009;13:2263– 78. doi:10.1016/j.rser.2009.06.021.
[30] General Authority for Land Survey and Urban Planning (GALSUP) n.d. http://www.cso-yemen.org/ (accessed December 6, 2014).
[31] Harris R, Johnston R, Burgess S. Neighborhoods, Ethnicity and School Choice: Developing a Statistical Framework for Geodemographic Analysis. Popul Res
Policy Rev 2007;26:553–79.
doi:10.1007/s11113-007-9042-9.
[32] Malczewski J. GIS and multicriteria decision analysis. New York: J. Wiley & Sons; 1999.
[33] De Groot R. Function-analysis and valuation as a tool to assess land use conflicts in planning for sustainable, multi-functional landscapes. Landsc Urban Plan 2006;75:175–86.
doi:10.1016/j.landurbplan.2005.02.016. [34] Malczewski J. Ordered weighted averaging
with fuzzy quantifiers: GIS-based multicriteria evaluation for land-use suitability analysis. Int J Appl Earth Obs Geoinformation 2006;8:270–7. doi:10.1016/j.jag.2006.01.003.
[35] ESRI (Environmental Systems Research Institute). Calculation of Polygon Main 2014.
[36] Sutton T, Dassau O, Sutton M. A gentle introduction to GIS. Chief Dir Spat Plan Inf East Cape 2009.