ROAD NETWORK ANALYSIS IN VECTOR ENVIRONMENTS ON CHENNAI CITY USING GIS
1
Vasanthi, R.,
2Vanaraju
1
Department of Industries and Earth Sciences, Tamil University, Thanjavur
2
Department of Geology, School of Geosciences, Bharathidasan University,
Tiruchirappalli
ARTICLE INFO ABSTRACT
The study area is one of the Network analysis in vector environments on Chennai City. Chennai district covers an area of 178.2
the north Bengal
Survey of India Toposheet No 66 C/4 the northern
above
analysis is used for identifying the most efficient routes or paths for allocation of services. This involves finding the shortest or least
network. Route
include highways, railways, city streets, rivers and utility systems (electricity, telephone, water, sewage). Networks are an important part of our everyday lives and analy
improves the movement of people, goods, services and the flow of resources . To find out the shortest path in a complex road network in the aspects of specified impedance To make the service area analysis on the location with roads of
facility on the road network. one location on the network dataset.
INTRODUCTION
The Cities in India are growing considerably at a faster rate with the suburbs thriving at a rapid rate. Chennai is also exception for such development. The problems of congestion and over crowding are common predicament in urban life. This situation force the planners to evolve with new strategies and ideas for meeting the requirements of the population which is steadily increasing quantitatively and also having a rapid shift in the cultural pattern which influence much on the living style of the people. Chennai, formerly known as is the capital city of the Indian state of Tamil Nadu. Chennai is the fourth most populous metropolitan area and the fifth most populous city in India. The application of GIS to a diverse range of problems in Transportation engineering is now well established. It is a powerful tool for the analysis of both spatial and non-spatial data and for solving important problems of networking. Define time-critical logistics (TCL) as the time sensitive procurement, processing and distribution activities. Transportation networks that contain these logistic systems act as a confounding factor. This paper reports on the development of a GIS-based decision support system for dynamic modeling of congestion and routing in a TCL scenario Miller, Wu and Hung (1999).
*Corresponding author: [email protected]
ISSN: 0975-833X
Article History:
Received xxxxxxxxxxxxxxx Received in revised form xxxxxxxxxxxxxxxx Accepted xxxxxxxxxxxxxxxx Published online xxxxxxxxxxxxxxx
Key words: Network analysis Environments, Coramandel coast, Highways, railways, city streets, Rivers, Utility systems.
RESEARCH ARTICLE
ROAD NETWORK ANALYSIS IN VECTOR ENVIRONMENTS ON CHENNAI CITY USING GIS
Vanaraju, G.,
1Baskaran, R. and
2Anbazhagan
Industries and Earth Sciences, Tamil University, Thanjavur – 613010, Tamil Nadu, India
Department of Geology, School of Geosciences, Bharathidasan University,
Tiruchirappalli – 620 024, Tamil Nadu, India
ABSTRACT
The study area is one of the Network analysis in vector environments on Chennai City. Chennai district covers an area of 178.2 km2 located on the Eastern Coastal Plains
the north-eastern corner of Tamil Nadu along the Coramandel coast Bengal and is surrounded inland by the districts of Tiruvallur and
Survey of India Toposheet No 66 C/4 and 66 D/1 of 1:50,000 scale. It lies between 12°9' and 13°9' of the northern latitude and 80°12' and 80°19' of the eastern longitude
above sea level. Its coastline is about 25.60 km (2.5% of the total
analysis is used for identifying the most efficient routes or paths for allocation of services. This involves finding the shortest or least-cost manner in which to visit a location or a set of locations in a network. Routes and networks are the interconnected features that are used for transportation and include highways, railways, city streets, rivers and utility systems (electricity, telephone, water, sewage). Networks are an important part of our everyday lives and analy
improves the movement of people, goods, services and the flow of resources . To find out the shortest path in a complex road network in the aspects of specified impedance To make the service area analysis on the location with roads of study area based on the impedance. To find out the closest facility on the road network. To find out the origin-destination matrix cost for many location from one location on the network dataset.
Copy Right, IJCR, 2012, Academic Journals
The Cities in India are growing considerably at a faster rate with the suburbs thriving at a rapid rate. Chennai is also no exception for such development. The problems of congestion and over crowding are common predicament in urban life. This situation force the planners to evolve with new strategies and ideas for meeting the requirements of the population y increasing quantitatively and also having a rapid shift in the cultural pattern which influence much on the , formerly known as Madras is the capital city of the Indian state of Tamil Nadu. Chennai is pulous metropolitan area and the fifth most The application of GIS to a diverse range of problems in Transportation engineering is now well established. It is a powerful tool for the analysis of both spatial d for solving important problems of critical logistics (TCL) as the time-sensitive procurement, processing and distribution activities.
these logistic systems paper reports on the based decision support system for dynamic modeling of congestion and routing in a TCL
Present a spatial decision support
heuristics to solve the vehicle routing problem. The architecture of the SDSS integrates a relational database management system within a GIS (ARC/INFO of ESRI) framework (Tarantilis and Kiranoudis 2002).
overview on GIS-interacted logistics and has developed a new three dimensional GIS distance based delivery and tracking system. The same work also contains comparative research on the vehicle routing problem based on various distance metrics within a GIS framework (Hwan
Have developed a hierarchical location model for locating bank branches in a competitive environment. The authors have combined demand-covering models with a GIS to capture various geographical, social and economic criteria as well as local competition concerning the demand for banking services The hierarchical location model involves first solving a location set covering model to determine the minimum number of bank branches followed by solving a maximal covering location problem to maximiz
individual branches (Miliotis, Dimopoulou, and Gianniskos 2002). Contains a review of existing work that forms the interface between GIS and location science and discusses future research directions involving both GIS and site locatio The author concludes that demand for better location model functionality in GIS software will grow and the success of
Available online at http://www.journalcra.com
International Journal of Current Research
Vol. 4, Issue, 09, pp.027-031, September,2012
INTERNATIONAL
ROAD NETWORK ANALYSIS IN VECTOR ENVIRONMENTS ON CHENNAI CITY USING GIS
Anbazhagan, G.
613010, Tamil Nadu, India
Department of Geology, School of Geosciences, Bharathidasan University,
The study area is one of the Network analysis in vector environments on Chennai City. Chennai Eastern Coastal Plains of India. It is situated on Coramandel coast, a region bounded by the Bay of and Kanchipuram. The area covered by and 66 D/1 of 1:50,000 scale. It lies between 12°9' and 13°9' of longitude at an average altitude of 6 meters km (2.5% of the total coastline of Tamil Nadu). Network analysis is used for identifying the most efficient routes or paths for allocation of services. This cost manner in which to visit a location or a set of locations in a s and networks are the interconnected features that are used for transportation and include highways, railways, city streets, rivers and utility systems (electricity, telephone, water, sewage). Networks are an important part of our everyday lives and analysis of these networks improves the movement of people, goods, services and the flow of resources . To find out the shortest path in a complex road network in the aspects of specified impedance To make the service study area based on the impedance. To find out the closest destination matrix cost for many location from
, Academic Journals. All rights reserved.
Present a spatial decision support system (SDSS) which uses heuristics to solve the vehicle routing problem. The architecture of the SDSS integrates a relational database management system within a GIS (ARC/INFO of ESRI) (Tarantilis and Kiranoudis 2002). Contains an interacted logistics and has developed a new three dimensional GIS distance based delivery and tracking system. The same work also contains comparative research on the vehicle routing problem based on various distance metrics
(Hwang, 2004).
Have developed a hierarchical location model for locating bank branches in a competitive environment. The authors have covering models with a GIS to capture various geographical, social and economic criteria as well as competition concerning the demand for banking services.
many site location applications in the future will be intimately
linked to GIS(Church, 2002).
METHODOLOGY
Study area
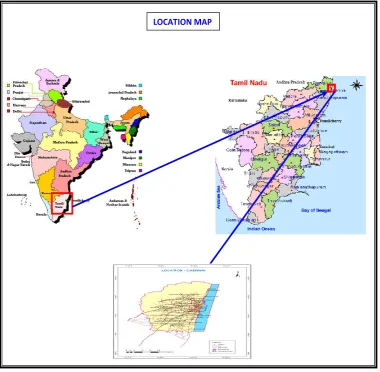
Chennai district covers an area of 178.2 km2 located on the Eastern Coastal Plains of India. It is situated on the north-eastern corner of Tamil Nadu along the Coramandel coast, a region bounded by the Bay of Bengal and is surrounded inland by the districts of Tiruvallur and Kanchipuram. The area covered by Survey of India Toposheet No 66 C/4 and 66 D/1 of 1:50,000 scale. It lies between 12°9' and 13°9' of the northern latitude and 80°12' and 80°19' of the eastern longitude at an average altitude of 6 meters above sea level. Its coastline is about 25.60 km (2.5% of the total coastline of Tamil Nadu). Because of its strategic location and economic importance, it is referred to as the "Gateway of South India." The drainage system includes two rivers, namely, Cooum (flowing in the northern part) and Adyar (flowing in the southern part), a canal (the Buckingham), and a stream (the Otteri Nullah) slicing the district into several islands. The district falls under Seismic Zone III indicating a moderate risk of earthquake. Geologically the district is divided into three regions, namely, sandy, clayey and hard-rock regions. The soil comprises clay, shale and sandstone.
In this study Survey of India topographic sheets were used to delineate the base map and landmarks. The city guide map also used to prepare road map with location. The IKONOS image was used in this study. The satellite image was geometrically registered with SOI Toposheet (1:50,000). The road networks and landmarks were vectorized from this image. GIS software has been used for digitization, analysis and computational purpose and also for output generation. With the help of GIS software the base map, road map, landmark map and network analysis map have been prepared. Then with the help of shapefile the network analysis is carried in Visual Basic language further customization tool for the related parameters are developed in ArcObjects.
NETWORK ANALYSIS
[image:2.595.111.492.381.753.2]Network consists of well connected linear features. Roads, railway line, water distribution system, Sewer line, streams are some of the examples of networks. These networks consist of nodes and arcs with designated directions and connection with other linear features. Networks arc topology based with attributes for the flow of objects like traffic. Road network will be considered for explaining network analysis. Road map is digitized with nodes and arcs. Signals, accidents are represented as points. Road is represented as line and two or more roads intersect at nodes. Attributes are added to the nodes and lines. Dynamic segmentation model is used for
Fig. 1. Study area
Fig.1. Possible turns in a road
network analysis. It is built on lines of network. In road network analysis, attributes for travel time, one way street, two way street, right turn, and impedance are added to the nodes and arcs. A link is the line running between two nodes. Link impedance is the cost of passing through the link. Travel time is different in links in cities due to varying traffic at
different locations. Time taken to pass through a known length of link may give the cost but the travel time in a link is not uniform because of varying speed designated in the link as 20 km per hour and 30 km per hour. Hence it is important to consider the length of link and also the travel time. If the speed limit is 20 miles per hour for a length of 2 miles, then the travel time is 6 minutes (2/20x60 minutes). Also tuning in the network is considered. A road may have a maximum of 12 possible turns excluding U turns. There are right turn, left turn, and straight way for each road. Also U turn is possible. This turning takes different time depending on the signal. Straight way takes less time but left and right turn may require some more time. If signals are available then signal time should also be taken into account. Fig.1. shows the possible turns in a road. One way, closed roads, two ways, overpass, underpass, are represented in road network for effective analysis. If two roads intersect, a node is created but when an overpass passing above road, no node is present. In the same way, when an underpass passing below a road do not have a node.
[image:3.595.47.283.62.244.2]
Professional GIS programs offer users advanced tools to make network analysis. From among four accessible network analysis options, the most often used in a city plan are two of them: finding the best route and finding the closest facilities. The first one allows finding the best way to get from one location to another or the best way to visit several locations.
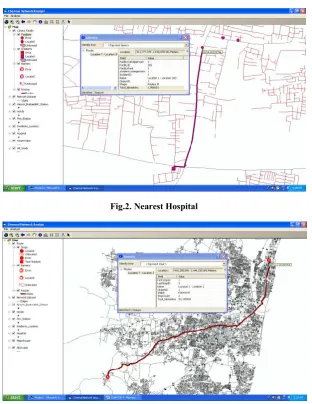
Fig.2. Nearest Hospital
[image:3.595.144.457.275.680.2] [image:3.595.147.455.283.465.2]Network locations are features used as input during network analysis, such as stops and barriers. The locations can be specified interactively by placing points on the screen, by entering an address, or by using points in an existing feature class or feature layer. The best route can be determined for the order of locations as specified by the user. Creating this type of route can mean finding the quickest, shortest, or most scenic route, depending on the impedance chosen. For example, if the impedance is time, then the best route is the quickest route. The second option is finding the closest facilities. It allows the user to find the closest facilities and specify how many can be found and whether the direction of travel is towards or away from them. The user can display this route to or from them, return the travel cost for each route, and display directions to each facility. What is more, the user can specify a cutoff cost beyond which program should not search for a facility. For instance, the user can set up the closest facility problem to search for hospitals within a 10-minute drive time of the site of an accident. Any hospitals that take
longer than 10 minutes to reach will not be included in the results. The hospitals are referred to as facilities, and the accident is referred to as an incident.
Finding Closest Facilities
This is a special type of optimal routing problem where you are trying to find the closest points to a given location. Typically the points are called facilities and the given location is called an event location. In this project the hospitals were taken as facilities and accident place were taken as incident (Fig. 2).
Shortest Path Analysis
[image:4.595.117.492.59.293.2]As part of the ranking process, travel time on alternative was identified for roads to be constructed. The travel time on alternate routes was used to calculate travel time saving gained from construction of the proposed project. An alternative route
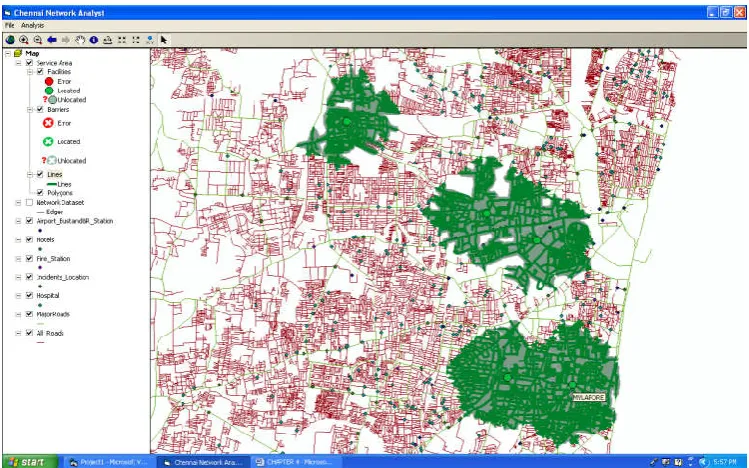
[image:4.595.116.491.71.503.2]Fig. 4. Service Area
is based on the identification of the shortest path between end points where the new roads are to be constructed. Path Finding Module of Arc/info can be used to generate the shortest route between points of the proposed project interactively. The statistical reports of link travel time and link-ids would be generated and used to evaluate the project's potential in reducing congestion within the impact area. This can be a done using the link impedance attribute table which contains link's travel time calculated in GIS based on speed, length and access penalty factors. GIS is used to identify links for projects where Vehicle Miles Traveled (VMT) is used as variable for analysis. Arc identifiers can then be used to join the network links in GIS to the VMT data obtained from the travel model output. For this analysis the hospitals were implementing as origin and destination (Fig. 3).
Service Area Analysis
This is a type of network analysis for determining the spatial distribution of resources through a network. Resources in allocation studies often refer to public facilities, such as fire station or schools, whereas the distribution of resources defines service zones. The main objectives of Service Area analysis are to measure the efficiency of public facilities.A common measure of efficiency in the case of emergency service is the response distance. Figure 4.9, shows areas in Chennai covered by four existing five stations within a 2 kilometers response distance. The map shows a large portion of city is between four fire stations the more than response 2 km distance. If places of Chennai demand that the response distance to any part of the city be after 2 km then the options are either to relocate the fire stations or, more likely, to build new fire stations. A new fire station should be located to cover the largest portion of the city unreachable in two 2 km by the existing fire stations (Fig. 4).
OD cost matrix
The GIS extensions can solve a number of network analyses based on finding the best route among a set of resources or finding the closest target points. In case of this example, spatial analysis is used for calculating the service area and creating the Origin-Destination (OD) cost matrix. The OD cost matrix is represented by a series of the connection lines in Fig. 5 The matrix is used as the input for the transportation problem. Each connection line includes a number of attributes. In this analysis were execute Railway stations, Airport as Origins and hotels as Destinations.
Conclusion
The network analysis method of this thesis is a vector based approach, using existing roads since there is a greater weightage given to higher category roads and since, all
categories of roads are selected for use in the network analysis. The total length continues to stay under control. Furthermore, the impedance for each road segment is calculated by using the length of the segment as a multiplier, thus the “total route length” continues to play an important role, although not the dominant one. This way, the vehicle- kilometers continue to be accounted for. For this case-study in particular, where it is mandated that, “no new roads should be created, upgrading of existing roads is allowed”, the final route can only’ follow existing roads. Therefore only a vector-based network analysis can serve the purpose. Another advantage of this method is that the final routes generated continue to be polyline shapes: hence they can be used for further analysis (as required) without requiring any additional processing.
The Developed Package Has The Following Capabilities
Finding shortest path based on distance
Finding closest facility and its path based on distance
OD cost matrix based on distance
Search radius of service Zone for Fire station and its path based on distance
The developed package can be used in the following areas to give information to the travelers and ambulance.
Bus stands
Railway stations
Airports
Hospitals
Fire Station
REFERENCES
Church, R. L.2002. Geographical information systems and location science.Computers and Operations Research, 29:541–562.
Hwang, H. 2004. An overview of GIS in Logistics/SCM system. In Proceedings of the Fifth Asia Pacific Industrial Engineering and Management Systems Conference, Gold
Coast, Australia.
Miliotis, M. Dimopoulou, and I. Gianniskos, 2002. A hierarchical location model for locating bank branches in a competitive environment. International Transactions in
Operational Research, 9:549–565.
Miller, Y. Wu, H. and M Hung , 1999. A GIS-based dynamic traffic congestion modeling to support time-critical logistics. In Proceedings of the Hawaii International
Conference on SystemScience, Maui, Hawaii.
Tarantilis, C. D. and C. T. Kiranoudis, 2002. Using a spatial decision support system for solving the vehicle routing
problem. Information and Management, 39:359–375.