To evaluate the phosphorus supply in soils, dif-ferent soil tests have been used for a long time; however they differ markedly in extractants and extraction methods. Nevertheless, the result of the test is generally reported as phosphorus avail-able to plants. In the beginnings of soil tests, i.e. approximately after World War I (Matula 2009a), it was phosphorus extraction from soils with ag-gressive single-nutrient agents. The use of strong extractants was motivated by a low content of extractable phosphorus forms in the beginnings of more intensive fertilization of agricultural soils with commercial fertilizers and by the analytical phosphorus detection limits.
With developments of chemical analytical tech-niques and their automations, a requirement ap-peared for multi-nutrient extractants of soil tests to determine as many as possible nutrients in one extract so that modern analytical instruments will
be utilized as well as possible (Houba et al. 1994, Jones 1998).
Colorimetry by means of the phosphomolyb-denum blue complex has always been the most widespread analytical method of phosphorus de-termination; it assumes that mainly inorganic phosphorus, i.e. orthophosphate ions, is detected. Phosphorus determination on ICP instruments where total phosphorus, including inorganic and organic phosphorus, should be detected has been used more and more frequently in recent years.
The history of phosphorus determination by help of molybdenum blue chemistry has under-went developments in the use of various reduct-ants from e.g. hydrazine sulphate through tin (II) chloride to the most frequent use of ascorbic acid and antimony catalyst that was standardized by Murphy and Riley (1962). The formation of the blue-coloured complex of the reduced
phos-Differences in available phosphorus evaluated by soil
tests in relation to detection by colorimetric and ICP-AES
techniques
J. Matula
Crop Research Institute, Prague, Czech Republic
ABSTRACT
Differences in the evaluation of soil phosphorus status by three soil tests (Mehlich 3, extraction with NH4-acetate and water extraction) were tested on 63 agricultural soils with different agrochemical characteristics from the terri-tory of the Czech Republic. Differences between the colorimetric determination of phosphorus and ICP technique were studied. The median of the values of phosphorus supply in soils determined by soil tests was considerably different. Compared to the colorimetric detection of water extraction of soils the median of the NH4-acetate test showed 2.2 times higher values and in Mehlich 3 test the values were 34.8 times higher. The largest difference be-tween the end-point analytical techniques of phosphorus determination, colorimetry and ICP-AES, was observed in the soil test of water extraction. The median of the values determined by ICP-AES was higher by 47%. In NH4 -acetate extraction of soils the median of the measured values of phosphorus was higher by 12% and in Mehlich 3 extraction by 7%. Differences in phosphorus concentrations determined by colorimetry and by ICP-AES increased as the phosphorus supply in soils decreased. When the supply of ‘available’ phosphorus in soil is given, it is always necessary to specify the used soil test including the end-point analytical technique of phosphorus determination to avoid the misleading interpretation of results. The problem of phosphorus in agriculture and in the environment requires thorough revision and methodical standardization.
Keywords: Mehlich 3; NH4-acetate extraction; water extraction; phosphorus; colorimetry; ICP-AES technique
phomolybdenum blue is related with pH of the medium, time of the reaction of developing the blue colour and temperature. The automation of determination by the techniques of continuous flow analysis (CFA) and flow injection analysis (FIA) contributed to standardization of the blue colour development and to more accurate results of determination compared to manual determination because in the manual procedure of determina-tion it is not possible to observe in a standard way the time from the reagent addition to the time of absorbance measurement on a colorimeter, es-pecially in larger series of samples. The acid pH value (pH < 2) is a condition of the blue colour development. However, the hydrolysis of less stable esters of phosphorus may take place at this acid-ity of the medium. It may cause an augmentation of the assumed determination of inorganic P by phosphorus from the organic component of soil. Baldwin (1998) reported such a case. Kowalenko and Babuin (2007) described further interferen-tial components influencing the formation of the blue-coloured complex. They demonstrated the influence of Al, Mn, Fe, K, Ca, Mg, Na, NO3– and EDTA, i.e. of common components in soil extracts and plant material mineralizates.
In agronomic interpretation, it will be necessary to respect potential differences in the determi-nation of extracted phosphorus by the classical colorimetric method and by modern ICP detection of phosphorus because the preceding calibration of soil test P was based on colorimetric determina-tion of phosphorus. Mallarino (2003) accentuated the need of different interpretation in Mehlich 3 soil test according to the method of analytical detection of phosphorus although he observed a very good correlation between colorimetry and ICP technique.
The objective of our study was to verify differ-ences in the determination of so-called available phosphorus by three soil tests (Mehlich 3, extrac-tion with NH4-acetate and water extraction) on a manifold set of soils with large differences in the agrochemical characteristics. We also aimed to determine the impact of classical colorimetric determination of phosphorus and currently ex-panding ICP-technique on the results of extracted phosphorus determination by soil tests.
MATERIAL AND METHODS
Research was conducted on 63 soil samples taken from the surface profile of agricultural lands from
different localities of the Czech Republic. After air-drying the soil samples were homogenized by screening through a 2-mm sieve.
The basic agrochemical characteristics of soils were determined in soil samples: pH, CEC value and content of oxidizable soil organic matter. The pH value was determined in a soil suspension with 0.2M KCl solution at a 1:1 ratio (w/v) with a microprocessor pH-mV meter with pH combined electrode. The CEC value was determined accord-ing to Matula (1996). The content of oxidizable soil organic matter was determined according to Sims and Haby (1971).
To evaluate the phosphorus supply in soil, three soil tests were used similarly like in Matula (2009b): Mehlich 3 (Zbíral 2002), water extraction at 1:5 w/v (SPAC 1999) and ammonium acetate extrac-tion with the addiextrac-tion of ammonium fluoride (Matula 1996). The phosphorus concentration in soil extracts was determined by means of the reduced phosphomolybdenum blue on a SKALAR auto-analyzer (Skalar 1992) and by the ICP-AES technique on a Thermo Jarrell Ash Trace Scan analyser. The Skalar automated procedure of phos-phate determination is based on the following reaction: ammonium heptamolybdate and potas-sium antimony (III) oxide tartrate react in an acid medium with diluted solutions of phosphate to form an antimony-phosphomolybdate complex. This complex is reduced to an intensely blue-col-oured complex by L(+)ascorbic acid. The complex is measured at 880 nm.
In addition, in soil extraction with water the suspension was centrifuged at relative centrifugal force 12 680 g for 10 min before filtration. The cooling of ultracentrifuge was kept at 20°C. The filter paper Filtrak, grade 389, was used for the filtration of all extracts from soil tests.
Experimental results were evaluated by statistical programmes GraphPad PRISM, Ca., USA, version 3 and Microsoft Excel 2007.
RESULTS AND DISCUSSION
of soils. The highest frequency of the content of oxidizable soil organic matter was in the range of 1.5–2.5% C. The most frequent value of soil acid-ity in the set of soils was in the range of 5–6 pH (0.2M KCl). In the set of soils, medium-textured
soils were represented the most frequently with the CEC value 120–160 mmol(+)/kg.
[image:3.595.64.531.79.302.2]The term ‘available phosphorus’ is generally used for extracted phosphorus by all tests. Differences among the soil tests (Table 2) indicate that this Table 1. Column statistics of basic soil charakteristics (63 analyzed soils)
Statistic parameters Oxidized organic matter (% C) CEC (mmol(+)/kg) pH (0.2M KCl)
Minimum 0.850 59 3.55
25% percentile 1.63 124 5.08
Median 2.02 137 5.47
75% percentile 2.57 153 5.92
Maximum 5.13 305 6.97
Mean 2.24 140 5.50
Standard deviation 0.886 39.9 0.606
Standard error 0.112 5.02 0.076
Lower 95% (confidence interval) 2.01 130 5.35
Upper 95% (confidence interval) 2.46 150 5.65
Coefficient of variation (%) 39.61 28.41 11.01
Geometric mean 2.09 136 5.47
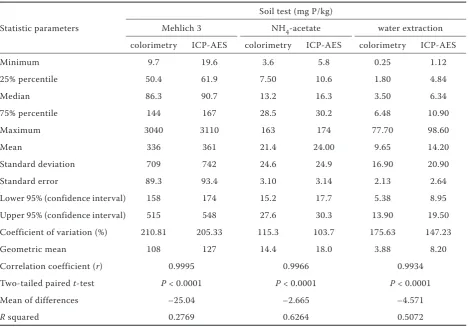
Table 2. Statistics of P-soil test of 63 soils measured by phosphoantimonyl blue colorimetry and by inductevely coupled argon plasma atomic emission spectrophotometry (ICP-AES)
Statistic parameters
Soil test (mg P/kg)
Mehlich 3 NH4-acetate water extraction colorimetry ICP-AES colorimetry ICP-AES colorimetry ICP-AES
Minimum 9.7 19.6 3.6 5.8 0.25 1.12
25% percentile 50.4 61.9 7.50 10.6 1.80 4.84
Median 86.3 90.7 13.2 16.3 3.50 6.34
75% percentile 144 167 28.5 30.2 6.48 10.90
Maximum 3040 3110 163 174 77.70 98.60
Mean 336 361 21.4 24.00 9.65 14.20
Standard deviation 709 742 24.6 24.9 16.90 20.90
Standard error 89.3 93.4 3.10 3.14 2.13 2.64
Lower 95% (confidence interval) 158 174 15.2 17.7 5.38 8.95
Upper 95% (confidence interval) 515 548 27.6 30.3 13.90 19.50
Coefficient of variation (%) 210.81 205.33 115.3 103.7 175.63 147.23
Geometric mean 108 127 14.4 18.0 3.88 8.20
Correlation coefficient (r) 0.9995 0.9966 0.9934
Two-tailed paired t-test P < 0.0001 P < 0.0001 P < 0.0001
Mean of differences –25.04 –2.665 –4.571
[image:3.595.64.534.433.760.2]term is not correct and can be misleading for farmers. Table 2 also documents the impact of the used end-point analytical technique on the result of the soil test even though a close correlation was observed within one soil test. However, the pair test demonstrated a highly significant difference between the sets of both end-point analytical techniques in all three soil tests.
If we make a comparison of the used soil tests and if we take the soil test of water extraction with colorimetric detection of phosphorus as the basic test, the median of the values obtained by NH4-acetate extraction reached 2.2 times higher values of phosphorus. In Mehlich 3 extraction even 34.8 times higher values of extracted phos-phorus were reached. Apparently, it is a result of the strength of Mehlich 3 extractant given by the pH value below 2.9.
The largest difference between the end-point analytical techniques of colorimetry and ICP-AES was observed in the soil test with water extraction (Table 2). The values of the median determined by ICP-AES were higher by 47%. In soil extraction with NH4-acetate the median of the measured phosphorus values was higher by 12%, and in Mehlich 3 extraction by 7%.
From the environmental point of view, in aquatic systems, phosphorus is determined on the colori-metric reaction of phosphate with an acidified molybdate reagent to yield phosphomolybdate heteropolyacid, which is then reduced to an in-tensely coloured blue compound and is specified as ‘dissolved reactive phosphorus’ (Robards et al. 1994, Worsfold et al. 2005, Soldat et al. 2009, Regan et al. 2010) or as ‘dissolved molybdate-reactive phosphorus’ (Styles and Coxon 2006). It is supposed that the molybdate-reactive phosphorus should
be mainly equal to the inorganic orthophosphate. Phosphorus detected by ICP-technique is defined as ‘total phosphorus’. The difference between total phosphorus and reactive phosphorus is termed ‘unreactive phosphorus’. The dissolved unreac-tive phosphorus represents mainly organic form of phosphorus and P fixed into an organic and an inorganic particles (‘particulate phosphorus’) which passed procedure of filtration (Worsfold et al. 2005, Styles and Coxon 2006, Blackwell et al. 2009). In our case of water extract of soils, the great difference between the colorimetric and ICP phosphorus in comparison with Mehlich 3 and NH4-acetate extracts indicates a possibility of a significant part of ‘particulate phosphorus’ due to limited aggregation of soil particles in the low ionic strength of water extract (Ebeling and Davis 2009).
Differences between phosphorus concentrations revealed by colorimetry and ICP-AES increased as 0
5 10 15 20
0.0 0.5 1.0 1.5 2.0 2.5 3.0 3.5 4.0 4.5 5.0 5.5
Fr
equ
en
cy
d
is
tr
ib
ut
io
n
(%
)
[image:4.595.69.311.65.223.2]Soil organic matter, oxidizable C (%)
Figure 1. Frequency distribution of soil organic matter in the set of 63 soils
0 2 4 6 8 10 12 14 16
3 3.5 4 4.5 5 5.5 6 6.5 7 7.5
Fr
equ
en
cy
d
is
tr
ib
ut
io
n
(%
)
[image:4.595.260.526.67.234.2]Soil acidity, pH (0.2M KCl)
Figure 2. Frequency distribution of pH (0.2M KCl) value in the set of 63 soils
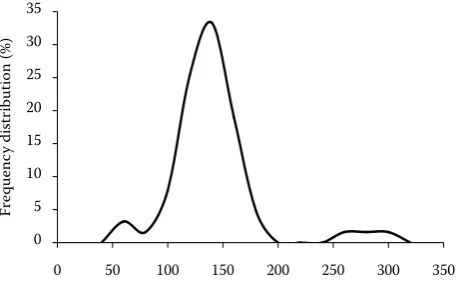
0 5 10 15 20 25 30 35
0 50 100 150 200 250 300 350
Fr
equ
en
cy
d
is
tr
ib
ut
io
n
(%
)
Cation exchange capacity of soils (mmol+/kg)
[image:4.595.303.533.566.712.2]Figure 4. Percentage of spec-trophotometrically determined phosphorus from ICP-AES P-detection in the case of Meh-lich 3 soil test by the colorimetric detection of phosphorus
Figure 5. Percentage of spec-trophotometrically determined phosphorus from ICP-AES P-detection in the case of Meh-lich 3 soil test by the ICP-AES detection of phosphorus
Figure 6. Percentage of spec-trophotometrically determined phosphorus from ICP-AES P-detection in the case of NH4 -acetate soil test by the colorimet-ric detection of phosphorus y= 5.055ln(x) + 64.1
R² = 0.2125
0 20 40 60 80 100 120
0 500 1000 1500 2000 2500 3000 3500
Pe
rc
en
tage
of
moly
bden
um
blue
phosphor
us
fro
m
IC
P-A
ES
p
ho
sp
ho
ru
s
Soil test Mehlich 3, colorimetry (mg P/kg)
� y= 2.8678ln(x) + 73.88
R² = 0.0598
0 20 40 60 80 100 120
0 500 1000 1500 2000 2500 3000 3500
Pe
rc
en
tage
of
moly
bden
um
blue
phosphor
us
fr
om
IC
P-A
ES
p
ho
sp
ho
ru
s
Soil test Mehlich 3, ICP-AES (mg P/kg)
y= 14.386ln(x) + 43.021 R² = 0.6482
0 20 40 60 80 100 120
0 10 20 30 40 50 60 70 80 90
Pe
rc
en
tage
of
moly
bden
um
blue
phosphor
us
fr
om
IC
P-A
ES
p
ho
sp
ho
ru
s
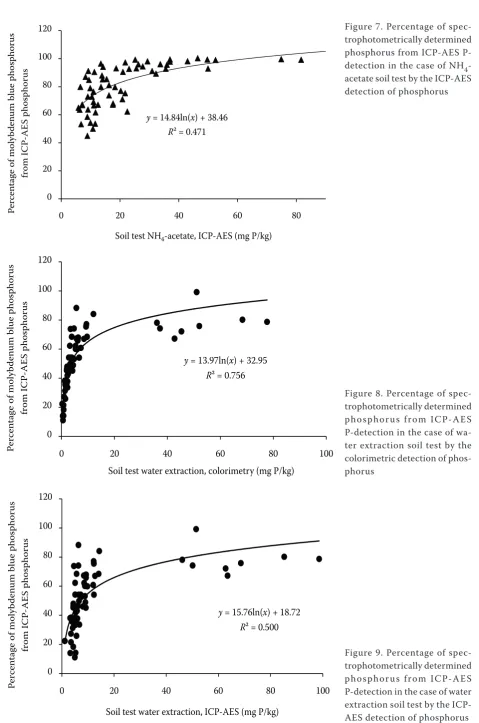
Figure 8. Percentage of spec-trophotometrically determined phosphorus from ICP-AES P-detection in the case of wa-ter extraction soil test by the colorimetric detection of phos-phorus
[image:6.595.59.539.39.763.2]Figure 9. Percentage of spec-trophotometrically determined phosphorus from ICP-AES P-detection in the case of water extraction soil test by the ICP-AES detection of phosphorus Figure 7. Percentage of spec-trophotometrically determined phosphorus from ICAES P-detection in the case of NH4 -acetate soil test by the ICP-AES detection of phosphorus
y= 14.84ln(x) + 38.46 R² = 0.471
0 20 40 60 80 100 120
0 20 40 60 80
Pe
rc
en
tage
of
moly
bden
um
blue
phosphor
us
fr
om
IC
P-A
ES
p
ho
sp
ho
ru
s
Soil test NH4-acetate, ICP-AES (mg P/kg)
y= 13.97ln(x) + 32.95 R² = 0.756
0 20 40 60 80 100 120
0 20 40 60 80 100
Pe
rc
en
tage
of
moly
bden
um
blue
phosphor
us
fr
om
IC
P-A
ES
p
ho
sp
ho
ru
s
Soil test water extraction, colorimetry (mg P/kg)
y = 15.76ln(x) + 18.72 R² = 0.500
0 20 40 60 80 100 120
0 20 40 60 80 100
Pe
rc
en
tage
of
moly
bden
um
blue
phosphor
us
fr
om
IC
P-A
ES
p
ho
sp
ho
ru
s
the phosphorus level in soils decreased (Table 2). This relation is clearly obvious from the graphical representation of the relative proportion of colori-metrically determined phosphorus in ICP-AES phosphorus (y-axis) in relation to the soil test (x-axis) (Figures 4–9). In other words, at a decrease in the phosphorus level in soil an increase in the proportion of probably organic phosphorus that is detected by the ICP-AES technique compared to colorimetry can be assumed in the extracts of soil tests.
In the soil tests Mehlich 3 and NH4-acetate ex-traction it is possible to expect the precipitation of the fine colloidal fraction of ‘particulate phos-phorus’ of both mineral and organic form by a high concentration of ions of these extractants (Ebeling and Davis 2009).
Meanwhile, in the water extraction of soils the fine colloidal fractions of unreactive phosphorus with phosphoantimonyl blue colorimetry may still be present after centrifugation and filtration of the solution. In our case of the soil test by water extraction in the area of a higher phosphorus level (above 10 mg P/kg) the undetected component of soluble phosphorus by colorimetry accounted for more than 20% of the determined soluble phos-phorus by the ICP-AES technique (Figures 8–9). Obviously, at colorimetric detection of phosphorus when its soil level decreases, there arises a pos-sibility of underestimating the content of mobile phosphorus in soil compared to ICP-AES detec-tion (Figures 4–9). It is however quesdetec-tionable to what extent this soluble phosphorus detected by ICP-AES, probably organic phosphorus, is utiliz-able for plant nutrition. From the environmental aspect it is an easily mobile component. It may be a source of soluble phosphorus release to the environment.
Phosphorus supply in soils has been evaluated for a long time by means of different soil tests that are however hardly mutually comparable from the aspect of the control and formation of efficient P level in soil. Therefore it is always nec-essary to describe the method of determination of phosphorus extraction including the end-point analytical technique. For the above reason the general designation of phosphorus reserve in soil by the term ‘available’ is incorrect, misleading and confounding for farmers. The possibility of reached differences by using the same soil test in a different laboratories without exact specifica-tion of procedure can then lead to disappointing yields plus the possibility of creating a soil fertility imbalance (SPAC 1999).
As the previous background data for P of soil tests were based on colorimetric detection, it will be necessary to revise and redefine the criteria of agronomic interpretation of soil tests for the end-point analytical technique of determination in all soil tests, not only for Mehlich 3 soil test as reported by Mallarino (2003).
Our experimental results support the opinions that the problem of phosphorus in agriculture and in the environment requires thorough revi-sion and methodical standardization (Baldwin 1998, Worsfold et al. 2005, Kowalenko and Babuin 2007).
REFERENCES
Baldwin D.S. (1998): Reactive ‘organic’ phosphorus revisited. Water Research, 32: 2265–2270.
Blackwell M.S.A., Brookes P.C., Fuente-Martinez N. de la, Mur-ray P.J., Snars K.E., Williams J.K., Haygarth P.M. (2009): Ef-fects of soil drying and rate of re-wetting on concentrations and forms of phosphorus in leachate. Biology and Fertility of Soils, 45: 635–643.
Houba V.J.G., Novozamsky I., van der Lee J.J. (1994): Status and future of soil and plant analysis. Communications in Soil Sci-ence and Plant Analysis, 25: 753–765.
Jones J.B., Jr. (1998): Soil test methods: past, present, and future use of soil extractants. Communications in Soil Science and Plant Analysis, 29: 1543–1552.
Ebeling D.D., Davis J.G. (2009): Impact of experimental factors in soil phosphorus tests: shaking vessel, filtration, and centrifu-gation. Communications in Soil Science and Plant Analysis,
40: 1610–1623.
Kowalenko C.G., Babuin D. (2007): Interference problems with phosphoantimonylmolybdenum colorimetric measurement of phosphorus in soil and plant materials. Communications in Soil Science and Plant Analysis, 38: 1299–1316.
Mallarino A.P. (2003): Field calibration for corn of the Mehlich-3 soil phosphorus test with colorimetric and inductively coupled plasma emission spectroscopy determination methods. Soil Science Society of America Journal, 68: 1928–1934.
Matula J. (1996): Determination of potassium, magnesium, phos-phorus, manganese and cation exchange capacity for fertilizer recommendations used by Czech Union of Rapeseed Grow-ers. Communications in Soil Science and Plant Analysis, 27: 1679–1691.
Matula J. (2009a): A relationship between multi-nutrient soil tests (Mehlich 3, ammonium acetate, and water extraction) and bioavailability of nutrients from soils for barley. Plant, Soil and Environment, 55: 173–180.
Murphy J., Riley J.P. (1962): A modified single solution method for the determination of phosphate in natural waters. Analytica Chimica Acta, 27: 31–36.
Regan J.T., Rodgers M., Healy M.G., Kirwan L., Fenton O. (2010): Determining phosphorus and sediment release rates from five irish tillage soils. Journal of Environmental Quality, 39: 185–192. Robards K., McKelvie I.D., Benson R.L., Worsfold P.J., Brundell
N.J., Casey H. (1994): Determination of carbon, phosphorus, nitrogen and silicon species in waters. Analytica Chimica Acta 287: 147–190.
Sims J.R., Haby V.A. (1971): Simplified colorimetric determination of soil organic matter. Soil Science, 112: 137–141.
Skalar (1992): Soil and Plant Analysis. Skalar Methods. Breda. SPAC Soil and Plant Analysis Council, Inc. (1999): Soil Analysis
Handbook of Reference Methods. CRC Press, Boca Raton, London, New York, Washington D.C.
Soldat D.J., Petrovic A.M., Ketterings Q.M. (2009): Effect of soil phosphorus levels on phosphorus runoff concentrations from turfgrass. Water, Air, and Soil Pollution, 99: 33–34.
Styles D., Coxon C. (2006): Laboratory drying of organic-matter rich soils: Phosphorus solubility effects, influence of soil char-acteristics, and consequences for environmental interpretation. Geoderma, 136: 120–135.
Worsfold P.J., Gimbert L.J., Mankasingh U., Omaka O.N., Han-rahan G., Gardolinski P.C.F.C., Haygarth P.M., Turner B.L., Keith-Roach M.J., McKelvie I.D. (2005): Sampling, sample treatment and quality assurance issues for the determination of phosphorus species in natural waters and soils. Talanta,
66: 273–293.
Zbíral J. (2002): Analyses of Soils I. Central Institute for Super-vising and Testing in Agriculture, Methodology, Brno, Czech Republic.
Received on January 27, 2010
Corresponding author:
Doc. Ing. Jiří Matula, CSc., Výzkumný ústav rostlinné výroby, v.v.i., Drnovská 507, 161 06 Praha 6-Ruzyně, Česká Republika