Does a contralateral decrease in alpha power during the orienting phase predict visual
awareness?
Hendrik Bartenbach, s1221086
University of Twente, September 2017
Department Cognitive Psychology and Ergonomics
First supervisor: Dr. R.H.J. van der Lubbe
2 Contents
Abstract ... 3
Introduction ... 4
Visual awareness and visuospatial attention ... 4
The direction of visuospatial attention and α-activity ... 7
Methodological aspects ... 9
Research question ... 12
Method ... 14
Participants ... 14
Task and Stimuli ... 15
Procedure ... 17
Apparatus and EEG Recordings ... 19
Data processing and analysis ... 20
Results ... 24
Behavioral data ... 24
EEG-measurement ... 25
Discussion ... 30
General recommendations for future research ... 33
Conclusion ... 35
References ... 36
3 Abstract
The purpose of this study was to examine the relation between visuospatial attention and
visual awareness. Dehaene, Changeux, Naccache, Sackur and Sergent (2006) claimed that
there is a preconscious state of processing in which a given not too salient stimulus can only
be noticed when attention is deliberately directed to it. This entails that attention has to be first
directed before conscious perception can occur. In this study, it was tested whether the
conscious perception of a stimulus that is near the threshold of being either detected or
undetected can be predicted by the direction of attention. A variation of the Posner task
(1980) was used to relate the distribution of neural oscillations in the α-band as measured by
electroencephalography (EEG) that are thought to be related to visuospatial attention to the
reported visual awareness of the target stimulus. The results showed high correlations of
reported awareness of the target stimulus and correct responses. A predictive effect of
lateralized α-activity between 40 ms and 0 ms before target presentation as measured in
occipital regions of the human brain on the reported awareness of the target stimulus was
found. The fact that highly salient stimuli were not detected when there was no lateralization
of α-activity supports Dehaene, Changeux, Naccache, Sackur and Sergent’s (2006) statement
that attention is necessary for consciousness to arise.
4 Introduction
The purpose of this study was to further assess the relationship between attention and
conscious awareness. A large number of studies has been conducted to gain more insight in
the mechanisms that lead to conscious perception and different theories have been formulated
to explain observed phenomena. In 2006, Dehaene, Changeux, Naccache, Sackur and Sergent
proposed a model of perception that not only includes consciousness and the lack of
conscious perception, but an intermediate state that was called preconscious processing. They
classified stimuli by their salience and suggested that stimuli of low salience would most
likely lead to no form of conscious perception, while stimuli of high salience would likely be
perceived. The preconscious processing was thought to occur when a stimulus is near the
threshold of being perceived or not. In this case, it would depend on the direction of attention
whether conscious perception would occur or not. If this claim holds true, it would be possible
to predict whether a visual near threshold stimulus will be consciously perceived or not based
on knowing whether attention was directed on it or not.
In the following, working definitions of visual awareness and visuospatial attention will be
given. While visual awareness can only be reported, the direction of visuospatial attention can
be measured without relying on subjective reports. A literature review on how to assess
attention will be conducted and different concepts that have to be taken into account when
designing an experiment that may provide new relevant information on the relation between
visuospatial attention and visual awareness will be discussed. A research question will be
formulated and the literature will be used to make predictions.
First, the concepts in question had to be defined:
Visual awareness and visuospatial attention
5 and Sergent (2006) argued that it is necessary to process a stimulus in form of sensory input to
actively perceive it. As indicated earlier, a stimulus has to be highly salient in order to be
consciously perceived. Dehaene, Changeux, Naccache, Sackur and Sergent (2006) explained
this with neural activity in the human brain, stating that a less salient stimulus may fail to
elicit sufficient neural activation. If any predictions were to be made, the focus of this study
had to lie on the preconscious processing state. Therefore, visual awareness was viewed as the
active, conscious perception of a visual near threshold stimulus. This definition includes the
ability to report whether or not a stimulus was perceived, thus the assessment of visual
awareness is limited to subjective reports.
In earlier studies, researchers often compared their measurement variables for cases in which
the participants were aware of the target stimulus and cases in which they were not. To collect
enough data for both conditions, near threshold stimuli had to be used. Common ways to
make these stimuli difficult to detect were low salience and short presentation time. If the
latter was employed, backward masking was used to prevent the occurrence of afterimages of
the target stimulus by replacing it with another image: the masking stimulus (Breitmeyer,
Hoar, Randall, & Conte, 1984). The amounts of time until the target stimulus was shown as
well as the amount of time it was shown until it was replaced by the masking stimulus were
variable. This is called stimulus onset asynchrony (SOA).
Visuospatial attention. Visuospatial attention is the ability to select and process relevant information from the whole of the sensory input (Posner & Petersen, 1990). Posner,
Snyder and Davidson (1980) described attention as a limited cognitive resource that is either
directed top-down (endogenous attention) or drawn bottom-up (exogenous attention). It was
compared to a spotlight that could be fixed on a certain stimulus without having the eyes to
follow this movement (covert attention). There is some controversy on the precise role of
6 Hillyard, 2012), and thought to increase neuronal firing rates as illustrated in monkeys by
Luck, Chelazzi, Hillyard, & Desimone (1997). Recently, rather than being a means of
highlighting the focus, attention is regarded as reducing distraction by inhibiting the
processing of distracting stimuli (Banerjee, Frey, Molhom, & Foxe, 2015; Kastner &
Ungerleider, 2001; Klimesch, 2012). Endogenous attention can be motivated by inner goals
and wishes (Jonides, 1981), be elicited by the prospect of rewards or punishment (Ryan &
Deci, 2000), verbal instructions, or the estimation that an awaited stimulus might appear on a
certain location (Chica & Lupiáñez, 2009). Exogenous attention on the other hand may simply
be drawn by highly salient stimuli. Although attention includes the selection and processing
of all sorts of sensory information, this study was only focused on visuospatial attention.
In an effort to investigate the effects of the direction of visuospatial attention, Posner (1980)
devised an experiment in which his participants were seated in front of a computer screen at
eye-level. They were asked to focus on a dot in the middle of the screen which was
surrounded by one empty box on the left and another empty box on the right side. In each
trial, there was a cue used to instruct the participants on which of the empty boxes they had to
focus their covert attention on. Depending on the condition, the cued side would actually
feature the stimulus, or not. Next, one of the boxes was for a short period of time replaced by
the target stimulus. The participants had to report as quickly as possible. By directing the
participants’ attention to different locations inside of their field of view and examining the
reaction times, Posner could assess that visuospatial attention can be directed top-down.
Knowing that visuospatial attention can be directed, it is important to define a measure for
this concept: While visual awareness can still only be measured in form of self-report, it is
widely accepted that there is a relation between neural activity that oscillates at a frequency of
roughly 8 and 13 Hz and visuospatial attention. These neural oscillations or waves are defined
7 The direction of visuospatial attention and α-activity
Foxe, Simpson and Ahlfors (1998) conducted an experiment with a stimulus with visual and
auditory compounds. They observed an increase in α-activity over the visual cortex when
participants were expecting the auditory part to be presented. In a later experiment Worden,
Foxe, Wang & Simpson (2000) used the Posner cueing paradigm (1980) to partially relate
α-activity to the participants’ field of view: Two possible target locations were chosen, one was
located on the right side and one on the left. A stimulus that is visible only to the right eye can
only be processed in the contralateral posterior cortex. This division in left and right provided
the opportunity to relate changes of α-activity on the respective sides to the cued target
location. The authors found that the power of α-oscillations in the posterior cortex was
increased on the side to be focused on (ipsilateral) and decreased on the side that was not
focused on (contralateral). Given that the processing of visual information happens
contralaterally with sensory input of the left eye being processed in the right posterior cortex,
it is believed that α-power is related to the selection of relevant and suppression of irrelevant
information with higher α-power correlating with higher suppression (Kelly, Lalor, Reilly &
Foxe, 2006; Thut, Nietzel, Brandt & Pascual-Leone, 2006; Wyart & Tallon-Bauldry, 2009).
The variable of interest in such a variation of the Posner cueing tasks is not the α-power on
the respective sides but the degree of distribution of this power to the respective sides
(lateralization).
Lamme, Supèr, Landman, Roelfsema and Spekreijse (2000) researched whether visual
awareness is linked to the activity of neurons in a particular area (localist approach) or to the
frequency of the oscillations (globalist approach), independent of the location. Like Rees and
Lavie (2001), who stated that visuospatial attention could be linked to α-activity in the
posterior cortex while awareness was not sufficiently explained by it, they concluded the
8 increased ipsilateral α-activity can be found before the expected presentation of a stimulus
(Haegens, Handel & Jensen, 2011), while stimulus presentation was found to evoke similar
increases (Babiloni, Vecchio, Bultrini, Romani & Rossini, 2005). This is further supported by
Romei, Gross and Thut (2010), who researched the relation between visual awareness and
lateralized α-activity. They stimulated visual areas by applying transcranial magnetic
stimulation of different frequencies and found that the relation between α-power and
perception of visual stimuli indeed works in both ways.
The findings of visual awareness being linked to not only the posterior cortex were consistent
with the research conducted by Weisz et al. (2014) although others deemed their conclusions
controversial: Weisz et al. (2014) examined prestimulus α-activity and noticed an additional
increase in activity in the frontoparietal network. They concluded that a combination of
processes in different areas is necessary in order to perceive stimuli consciously. Although
this is possible, van Rullen (2011) warned to draw these kinds of conclusions: In cases where
experimental conditions are contingent on subjective responses, he claimed, there might be a
bias that may favor one of the possible responses. In this case, this bias would lead to activity
that is solely related to favoring one response being interpreted as a neural correlate of
consciousness. He refers to the research of Busch et al. (2009) in which the authors were able
to predict responses in a target detection task based on frontal α-activity. In conclusion, there
seem to be additional instances of prestimulus lateralized α-activity that may not be related to
visuospatial attention and visual awareness, but seem to correlate with giving responses on
attention orienting tasks. Van Rullen (2011) suggested solving this problem by using two or
more different target stimuli and asking the participants to not only report detection but also to
differentiate between them. A response bias would in this case not lead to consistently correct
or incorrect responses that correlate with a certain aspect of the measured activity, as there is
9 The implication of Dehaene, Changeux, Naccache, Sackur and Sergent’s (2006) claim that
there is a preconscious processing that only leads to conscious perception of a stimulus when
attention is directed on it is that attention may be used to predict conscious perception. Based
on the literature, it was concluded that conscious perception can only be measured via self
report, but the direction of attention is suspected to be related to α-activity in the posterior
regions of human brain. The next step was to design an experiment that can be used to relate
visuospatial attention and visual awareness to ultimately test Dehaene, Changeux, Naccache,
Sackur and Sergent’s (2006) claim. Another literature review was conducted to put together
the concepts that had to be addressed to achieve this goal.
Methodological aspects
A variation of the Posner task (1980) was used to further investigate the relation between
visuospatial attention and visual awareness. In constructing the experiment, a number of
design choices had to be made: At first, a measure for the lateralization of α-activity had to be
found. Then, the Posner task (1980) had to be modified. The concepts that had to be addressed
were to choose the degree to which the cueing stimulus predicted the correct target location,
the duration of the target presentation, and the manner in which participants were to give
responses.
As stated earlier, the variable of interest in a variation of the Posner task (1980) that is used to
investigate the direction of visuospatial attention is the lateralization of α-activity as opposed
to its simple occurrence on the respective sides. Van der Lubbe and Utzerath (2013) used a
double subtraction method that results in a measure for lateralization that relates the power
that is measured on both sides to the difference in power on the respective sides. This measure
10 In their experiment, Posner, Nissen and Ogden (1978) varied the cue validity, which is the
chance that the cue correctly predicted the location of the target stimulus. They concluded that
the reaction times were affected by the expected target location. Haegens, Handel and Jensen
(2011) further investigated this effect and found that the degree of lateralization of the
α-power depends on the cue validity with higher cue validity eliciting higher degrees of
lateralization. When aiming to investigate a possible relation between lateralized α-power and
visual awareness, cue validity should be kept at 100% to assure the most meaningful
outcomes.
When trying to test Dehaene, Changeux, Naccache, Sackur and Sergent’s (2006) claim, it is
important that the target stimuli are hard to detect. To achieve this, a short presentation time,
after which the possible target locations are masked, can be employed. Hanslmayr et al.
(2005) stated that there are individual differences in target detection rates for equal
presentation times. To take these differences into account and to try to produce roughly equal
numbers of aware and unaware responses in an experiment, it might be appropriate to use an
adaptive set of SOAs. For an experiment with two target stimuli, there is a 50% chance to
guess the right answer. If the participants are aware of the target stimulus, they are expected
to report correct answers. If the participants are not aware of the target stimulus, they are
expected to guess the right answer in half of the cases. This would have them giving correct
responses in roughly 75% of the time. If the participants score lower or higher, the SOAs
could be adapted to keep the number of trials with correct responses roughly even to the
number of trials with incorrect responses.
Finally, the manner in which participants give responses on visual detection or discrimination
tasks had to be discussed, as it may introduce bias to the analysis: The intervals in which
participants can report orientation or awareness of the target are fixed in a large number of
11 Ro, 2009; Wyart & Tallon-Bauldry, 2009; Weisz et al., 2014). Exclusion of trials in which the
participants needed more time to choose the response to be given could result in overlooking
systematic effects. A forced response setting in which the next trial will only begin if the
participant has given a response would give the participants more time to choose which
response to give and therefore increase the accuracy.
The number of response buttons in the research of neural oscillations is an issue that has to be
accounted for: Having only one response button that is pressed with either the left or the right
hand can also increase the probability of introducing bias in the EEG measurement as the
participant’s response may in turn be influenced by certain decision making processes that are
not related to the task at hand (van Rullen, 2011). Additionally, van der Lubbe and Utzerath
(2013) suspected that giving responses with one hand might bring out lateralized motor and/or
attentional activity related to this hand during the cue-target interval. They proposed to simply
use tasks that require responses from both hands to eliminate these effects.
When assessing visual awareness in a target discrimination task, it is necessary that the
participants report whether they were aware of seeing the target stimulus that was presented.
Still, they would have to report whether they had seen target 1 or target 2, because, otherwise,
there would not be any way to control the accuracy of their responses. Thus, there were four
different answers. Babiloni, Vecchio, Bultrini, Romani and Rossini (2005) chose to approach
this matter by having the participant give a motor response on target location and then saying
aloud ‘seen’ or ‘not seen’ depending on whether they were aware of the target stimulus.
Szumska, van der Lubbe, Grzeczkowski and Herzog (2016) investigated whether the channel
on which a response was given in a binary choice task influences of that response. They
concluded that there were differences in reaction time, but none in accuracy. A possible issue
however is the order of responses that are given: If participants have to first decide what they
12 introduce bias to the second one. This problem could be solved by using four possible
responses: Target 1-aware, target 2-aware, target 1-unaware, and target 2-unaware. By asking
the participant to give both answers simultaneously, no decision should influence the other.
This method might introduce some difficulty to giving the desired answer, but in combination
with a forced response setting, no effect of this kind was expected. Still, the reports of
awareness could be related to the correctness of the discrimination between the two targets to
examine this possibility: a positive correlation of aware and correct responses would indicate
the participants’ capability of correctly reporting target and awareness.
Research question
The purpose of this study is to test Dehaene, Changeux, Naccache, Sackur and Sergent’s
(2006) claim that there is a preconscious processing state in which awareness of a stimulus
can only be achieved by directing attention to it. The relation between visuospatial attention
and visual awareness was investigated; if the claim holds true, it might be possible to predict
the reported awareness of a stimulus based on the direction of the attention. The research
question was therefore:
‘Can visual awareness of a near threshold stimulus be predicted by the direction of visual
attention?’
An experiment was designed to answer this question. Based on the literature, it was a
variation of the Posner task with two different targets, two possible target locations and a cue
that validly predicts the target location on each trial. The target locations were chosen to be
presented at the same height, one to the right and one to the left of the cueing stimulus. No
distracter stimulus was used because the moment of target presentation was irrelevant for the
13 individual differences in detection rates and assure comparable numbers of trials for each
condition, SOAs were adapted to each participant’s performance. A forced-response setting
was employed to avoid bias; all responses were given by pressing buttons that were equally
distributed to the right and the left hands. If the direction of visuospatial attention would elicit
a lateralization of α-activity, it would be discernible whether the location to be attended to
would be related to the area above which the α-activity was measured.
The literature review suggested that visuospatial attention can be directed at will, and that
visual awareness of a target stimulus can be reported reliably. If these assumptions are
correct, then the proposed experiment could be used to test whether visual awareness can be
predicted by prestimulus direction of visuospatial attention as measured in form of
lateralization of α-power. The hypothesis to be tested is:
‘A decrease in contralateral α-activiy over the posterior regions of the human brain increases
14 Method
Participants
The 26 participants’ visual acuity was tested with the Freiburg Visual Acuity Test (Bach,
1996), and possible color blindness was assessed with Ishihara’s test (1976). To pass for
visual acuity with normal or corrected to normal sight, a decimal acuity (dec. VA) of 1.0 had
to be reached. To pass as non- colorblind, the participants had to complete the test without
errors. The target detection rates for each participant were calculated. As described earlier,
participants were expected to score a proportion of roughly 75% correct answers in total. Out
of the 26 participants, four were used to conduct a pilot study, six were excluded from the
testing for scoring low on visual acuity, six were excluded from the analysis for scoring less
than 75% on target detection, one due to errors in the measurement, and finally, one
participant complained about drowsiness which lead to an early termination of the
experiment. This left a total of eight participants for analysis.
Six out of the remaining eight participants were female, the average age was 20.5 years
(s=2.45; range: 18– 25). All participants reported to be undergraduate students at the
University of Twente, three of them were enrolled in communication science, while the other
five studied psychology. Three participants were wearing glasses, one wore contact lenses.
Annett’s Handedness Inventory (1970) was used to determine that all of them were right
handed.
The study was approved by the ethics committee of the Faculty for Behavioral, Management
and Social Sciences at University of Twente. All participants signed a form to give informed
consent. For students of the University of Twente, participating was compensated with study
15 Task and Stimuli
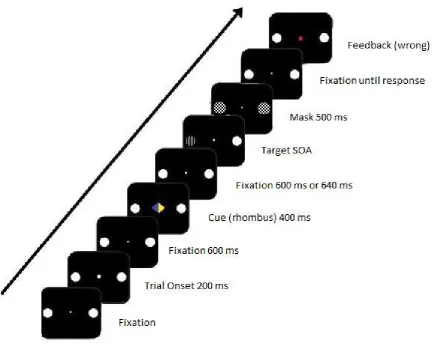
A variation of the Posner task (1980) was chosen. The sequence of events on a trial is
depicted in Figure 1 and further described in the following:
A black screen with one white dot (r=0.164°) in the center, and two rings (6.03° to each side
with r=0.614°) as possible locations for the target stimulus was presented. This screen was
used for fixation periods. To mark the beginning of a trial, a bigger white dot (r=0.246°) was
shortly presented at the center location. After a fixation period of 600ms, the white dot was
replaced with a half blue and half yellow rhombus. By pointing to either the left or the right,
the yellow half cued the target location for each trial. After another fixation period, the target
stimulus was presented. This target stimulus consisted of the ring on the indicated side being
filled with either horizontal stripes or with vertical ones, while the other side featured an
empty ring. After a variable amount of time (SOA), both locations were filled with masking
stimuli: A ring that is filled with crossing diagonal stripes. The following fixation period had
an indefinite duration; it could only be ended by the participants giving a response. At the end
of each trial, a big dot in the center location, green for correctly and red for incorrectly
reported targets, was used to provide feedback. The measurement variables in this target
discrimination task were the reported orientation of the stripes of the target stimulus, and the
reported awareness of the target stimulus.
The testing consisted of one practice session with 36 trials and eight blocks with 112 trials
each, thus 932 trials in total. Variable values in the uneven blocks were target and target
location, orientation of the stripes and SOA. For even blocks, the moment of target
presentation was roughly 45 ms (half the length of an average α wave) earlier for half of the
16 Figure 1. Sequence of events on a trial. The beginning of each trial is indicated with a big white dot. After a fixation period of 600ms, a blue and yellow rhombus cued on which side the target stimulus was going to appear for 400ms. Following another fixation period of either 600ms or 640 ms, the target stimulus (a circle filled with vertical stripes) was shown for a variable amount of time and subsequently masked for 500ms. In order for the next trial to begin, a response had to be given.
During pilot testing, three of four participants reported that the target stimulus was masked
too quickly. When asked about how they felt about the test, they reported to be frustrated and
that they had to guess in most trials. The number of different SOAs was therefore increased to
provide an easier start in the practice session. The different SOAs were 7 ms, 21 ms, 35 ms,
49 ms, 63 ms, 76 ms, 90 ms, 104 ms, 118 ms, 132 ms, 146 ms, 160 ms, 174ms, 188 ms, 201
17 354 ms. These durations were chosen with respect to the frame rate of the used screen of 144
Hz and are therefore of 1, 3, 5, 7, …, 51 frames.
The test was programmed to assess the number of correct responses in predefined sets of trials
and to adapt the used SOAs to the participant’s performance. This was achieved by sorting the
SOAs into 20 different sets. For the practice session of 36 trials, each of the different sets
contained 12 trials (3 SOAs x 2 target locations x 2 target stimuli). Starting at set number
nine, which contains trials with the SOAs 188 ms, 201 ms, and 215 ms, the set of used SOAs
was evaluated every 12 trials. If the participants gave less than seven correct answers, set
number eight would have provided the next 12 trials (SOAs: 201 ms, 215 ms, 229 ms), if
seven to nine correct answers were given, the set would not have changed, and if more than
nine correct answers were given, the participant would have moved up to set number ten
(SOAs: 174 ms, 188 ms, 201 ms). The four chances to change the group provided an
opportunity to start the test at an appropriate speed.
After completion of the practice session, eight blocks with 112 trials each were presented. The
chosen set of SOAs was kept adaptive by dividing each block into four sets of 28 trials each.
After each set of trials, the set of SOAs to be used for the next 28 trials was assessed in a
manner that is similar to the practice session. The sets for the actual tests contained seven
different SOAs and required 21 correct responses not move down to a set of longer SOAs, and
24 ones to move up. The SOAs in each set are listed in Appendix A.
Procedure
After the participants passed the tests for visual acuity, ability to see color, and dexterity, the
computer assisted testing begun. The participants were asked to sit down and face a computer
screen, which featured the following instructions: The participants should place their left
index and middle fingers on the “F” and “D” keys and their right index and middle fingers on
18 stimuli, namely rings that were filled with either horizontal or vertical stripes, would be
presented and then quickly be covered by a mask. The participants were instructed to report
the orientation of the stripes that filled the ring at the target location and also whether they
were sure to have seen the stimulus or not. The orientation of the stripes was reported by
clicking with the left hand for horizontal stripes and the right hand for vertical ones. When
reporting to be aware of the target stimulus, the participants should press the keys their index
fingers are placed on, when in doubt or even guessing, they were told to use their middle
fingers. It was explained that the target stimuli could appear on one of two possible target
locations and that the yellow side if the cue validly predicted the target location for each trial.
The participants were instructed to fixate at the white dot in the middle of the screen, while
shifting their focus of attention to the cued target location. It was noted that reaction time
would not be measured in this experiment and that the participants should focus on reporting
as accurately as possible. After the participants had read these instructions, the experimenter
asked if there were any questions regarding the experiment.
Prior to starting the test, each participant was asked to first focus on the dot in the middle of
the screen and then, while not moving their head, to shift their view to the left and right edges
of the screen several times. These eye movements were later used as a reference to exclude
trials in which the participants shifted their view and looked directly at the cued target
location.
A second opportunity to ask questions was given after completion of the practice session.
There were breaks with one minute duration after each block of 112 trials. After finishing all
19 Apparatus and EEG Recordings
The test was presented on a 25 inch screen with a refresh rate of 144 Hz and the test was
programmed and presented using Presentation software (Neurobehavioral Systems, Inc.,
2012). The distance between the participants’ eyes and the screen was set to 85 cm and the
height of the chair was adjusted so that the participants’ eyes were 45 cm above the desk.
Brain Products’ ActiCHamp was used to amplify the EEG and EOG signals, which were in
turn recorded with Brain Vision Recorder (Brain Products GmbH) with a sample rate of 1,000
Hz. Presentation software sent task related events and responses were sent as markers.
A total of 33 active and 5 passive Ag/AgCl electrodes were used in the measurement. The
active electrodes were placed in the Braincap (Brain Products GmbH), an elastic cap with
slots, at the following positions: AFz, AF7, F7, F3, Fz, FC5, FC1, T7, C3, Cz, CP1, P7, P3,
Pz, PO7, PO3, POz, O1, Oz, O2, PO8, PO4, P4, P8, CP2, C4, T8, FC2, FC6, F4, F8, AF8,
and FPz for the ground. The positions of the active electrodes can be seen in figure 2. The
passive electrodes were used to measure the EOG. Electrodes for the horizontal EOG were
placed at the outer canthi of both eyes, electrodes for the vertical EOG were placed above and
below the left eye. Additionally a ground electrode for the EOG was placed on the forehead.
20 Figure 2. Positions of used EEG-electrodes
Data processing and analysis
Behavioral data. The behavioral data was processed by first using the given responses to determine whether the target stimulus was correctly identified and whether the
participants reported being aware of it on single trial basis. This information was used to
calculate the percentages of correct and aware, incorrect and aware, correct and unaware, and
incorrect and unaware responses per SOA per participant.
Due to the large range of SOAs per participant the difficulty of identifying the target varied
significantly across the trials. The ranges of SOAs and the number of trials per SOA differed
21 The trials of each participant were, therefore, split into trials with short SOAs, and trials with
long SOAs. The cut-off value was the median encountered SOA which is the SOA with 50%
of the trials having a shorter and 50% of the trials having a longer SOA.
EEG-measurement. The raw EEG data were processed using Brain Vision Analyzer (Brain Products GmbH). The data was segmented, with each segment centered at the marker
for the mask and ranging from -2080ms to 2800ms, to divide the datasets into individual
trials. To remove noise a Zero phase shift IIR Butterworth Filter with a high cut-off of 32 Hz
and a low cut-off of 0.53 Hz was used to decrease the interference of higher and very low
frequencies. For each participant the horizontal (h) EOG data that was obtained prior to
starting the practice session was used to determine the trials that had to be excluded due to
eye-movement. It was expected that the potentials in the hEOG would correlate linearly with
how far the participants shifted their views to the sides. The difference in angle between the
fixation point and the left and right edges of the screen was roughly three times the difference
between fixation point and possible target locations. Therefore, a third of the potential while
fixating on the edges of the screen was set as cut-off value for eye-movement. Markers were
set on each trial that showed too much horizontal eye movement from the beginning of each
trial to the presentation of the mask and were in turn used to exclude these trials from the
analysis. After artifact rejection, ocular correction for blinking with Gratton and Coles’
method and baseline correction, several segmentations were used to divide the data with
respect to SOA, reported sureness and actual correctness of the answer. The SOAs were
divided into the categories slow and fast. The cut-off value for this was the median
encountered SOA per participant. From here on out, a last segmentation was used to divide
the trials that had the target stimulus on left side from the ones that showed the target stimulus
on the right side. A continuous wavelet transformation with seven steps from 4 Hz to 20 Hz
α-22 band of around 11.7 Hz. For each condition, the average power was calculated from the
segments. A double subtraction was used to calculate a measure for the lateralization
α-power: If the target is presented on the right side, the change in α-activity in the parietal and
occipital regions is expected contralateral, i.e. at the left side. The difference of the power on
the left side and the right side was divided by their sum to relate the allocation of the absolute
power that is measured in the symmetrical pairs of electrodes to total power measured with
each pair. The following formula shows this process for the electrodes PO7 and PO8:
If calculated like this, positive values indicate an increase in lateralized α-power ipsilateral to
the side that was to be attended, and a decrease in contralateral α-power. A value of zero
would suggest that the activity did not depend on the to be attended side. The average degree
of lateralization was calculated for 40ms intervals from the moment the cue showed on which
side target would appear until the target is masked and then exported to IBM SPSS Statistics
23 for further analysis.
Statistical analysis. The first question to be addressed is whether there is a positive correlation between the reports of awareness of the target stimulus and the correct responses.
A Pearson correlation was calculated; a positive correlation would indicate that visual
awareness was reported reliably.
Further, it had to be assessed whether there were prestimulus lateralizations of α-power in the
posterior cortex of the brain. A topographical view of the degree of lateralization of α-power
during the orienting phase was plotted, so that intervals with lateralized α-power could be
read out of it. The data was then examined by first dividing the trials by reported awareness
23 with 0 by using t-tests. Based on the reviewed literature, a contralateral decrease in α-power
was expected. Therefore, one-tailed t-tests were conducted.
The chance of committing a Type-1 error increases with the number of tests that are
conducted. Therefore it was possible that the use of the standard significance level of α=0.05
would not be possible. To deal with this family wise error problem, a critical p-value was
calculated and used for two consecutive time windows at a time. Van der Lubbe, Bundt and
Abrahamse (2014) suggested calculating as dependent on the chosen significance level,
the number of time windows and the number of used electrodes:
Finally the hypothesis that a contralateral decrease of prestimulus lateralizations of α-power in
the posterior cortex of the brain predicts awareness of the target stimulus was tested. For each
of the intervals that showed significant degrees of lateralization of α-activity, an ANOVA
analysis with the average of the degree of lateralization of α-activity as dependent variable
and length of SOA and reported awareness as predicting factors was conducted. Any
significant effect of awareness on the lateralized α-activity will be interpreted as supporting
24 Results
Behavioral data
For each participant, the median SOA was determined and used as cut-off value to divide
trials per participant into trials with long SOAs and trials with short SOAs. Table 1 depicts the
[image:24.595.69.510.292.434.2]range and median of encountered SOAs per participant.
Table 1
Shortest, longest and median SOA per participant in ms
Participant Shortest SOA Longest SOA Median SOA
1 90 215 146
2 35 201 132
3 49 215 132
4 76 215 146
5 21 104 63
6 7 215 90
7 21 160 76
8 76 215 146
Plots of reported awareness of the target stimulus and correct answers for trials with long and
short SOAs in Figure 3 show a decrease in reported awareness and correctness in trials with
short SOAs when compared to trials with long SOAs. The reports of awareness and the
25
Figure 3. Box plots show the percentage of correct responses and reported awareness for short and long SOAs.
EEG-measurement
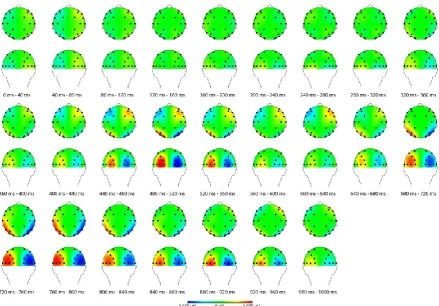
Figure 4 shows the course of the average lateralization of α-power from cue presentation to
stimulus presentation in all trials. The degree α-lateralization just prior to the target
presentation was reported to be related to the given responses (van der Lubbe & Utzerath,
2013). Figure 4 depicts a continuous lateralization in trials with reported awareness of the
target stimulus in the interval between 680 ms and 960 ms, and a similar lateralization that
ended at 920 ms in trials in which the participants reported to be unaware of the target
stimulus. Therefore, the interval between 680 ms and 960 ms was examined in the further
26
Figure 4. Topographical views of average lateralization of α-power in the orienting interval. Half of the values were mirrored, so that all values treat the left side as the one to be attended to. The left hemisphere shows ipsi- vs. contralateral power, while the right hemisphere depicts contra- vs. ipsilateral α-power. Positivity at the left hemisphere indicates higher α-power over the ipsilateral sites than above contralateral sites.
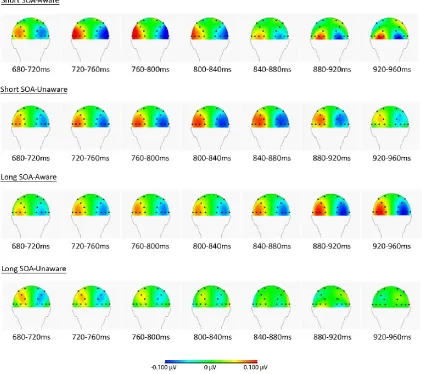
To further investigate these instances of lateralization, the data was divided by length of the
target stimuli and reported awareness. As depicted in figure 5, it appears that the lateralization
of α-power took place at different moments in time in the different conditions: For short
SOAs with reported awareness, lateralized α-power that is centered at P7/8 and PO7/8 can be
observed between 680 ms and 840 ms after cue onset. Additionally, there is a later instance of
lateralization in O1/2 and PO7/8 between 880 ms and 960 ms after cue onset. In the condition
with short SOAs without awareness, a similar lateralization around P7/8 and PO7/8 occurred
between 720 ms and 880 ms after cue onset, however no lateralization around O1/2 and
α-27 power began at 840 ms and did not end until target presentation, while no such lateralization
[image:27.595.85.508.140.514.2]could be seen in trials with long SOAs without awareness of the target stimulus.
Figure 5. Topographical view of lateralized α-power per condition between 680 ms and 960 ms after cue presentation. For further information see Figure 4.
These observed differences in α-lateralization were further examined by conducting one-tailed
t-tests. In both the short SOA and aware, and the long SOA and aware conditions, lateralized
α-power could be observed at PO7/8 and O1/2. While several other instances with
lateralization of α-power were measured at different electrodes in the different conditions, this
lateralized α-power could be seen only above PO7/8 and O1/2 between 880 ms and 960 ms in
the short SOA and aware condition. As lateralization of α-power appeared to be constant on
only these locations in the conditions with reported awareness, only PO7/8 and O1/2 were
28 The critical p-value was calculated as
.
As an effect of choosing only one pair of electrodes with seven time intervals, exceeded
[image:28.595.67.531.270.730.2]the significance level α=0.05. Thus, the latter was used to determine statistical significance.
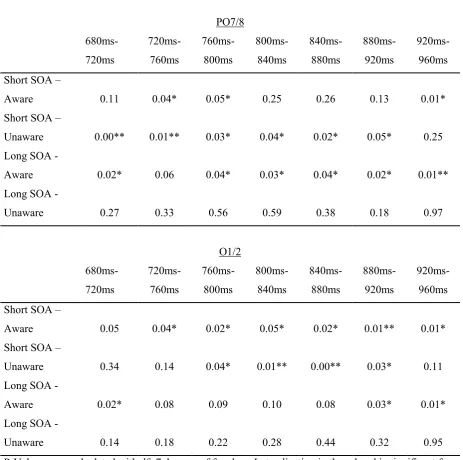
Table 2
Significance of observed lateralization of α-power at PO7/8 and O1/2
PO7/8 680ms- 720ms 720ms-760ms 760ms-800ms 800ms-840ms 840ms-880ms 880ms-920ms 920ms-960ms Short SOA –
Aware 0.11 0.04* 0.05* 0.25 0.26 0.13 0.01*
Short SOA –
Unaware 0.00** 0.01** 0.03* 0.04* 0.02* 0.05* 0.25
Long SOA -
Aware 0.02* 0.06 0.04* 0.03* 0.04* 0.02* 0.01**
Long SOA -
Unaware 0.27 0.33 0.56 0.59 0.38 0.18 0.97
O1/2 680ms- 720ms 720ms-760ms 760ms-800ms 800ms-840ms 840ms-880ms 880ms-920ms 920ms-960ms Short SOA –
Aware 0.05 0.04* 0.02* 0.05* 0.02* 0.01** 0.01*
Short SOA –
Unaware 0.34 0.14 0.04* 0.01** 0.00** 0.03* 0.11
Long SOA -
Aware 0.02* 0.08 0.09 0.10 0.08 0.03* 0.01*
Long SOA -
Unaware 0.14 0.18 0.22 0.28 0.44 0.32 0.95
29 The outcomes of the t-tests can be seen in table 2. The results support systematic differences
from zero in different intervals for the conditions. For short SOA and reportedly aware trials,
lateralization of α-power was significant between 720 ms and 800 ms at PO7/8 and between
720 ms and 960 ms at O1/2. The degree of lateralization of α-power over PO7/8 may have
also been different from zero between 920 ms and 960 ms. It is not viewed as significant
because of the condition that lateralization would only be interpreted as significant if the
p-value was smaller than the significance level for at least two consecutive intervals. For short
SOA and unaware trials, lateralized α-power was observed over PO7/8 from 680ms to 920ms
and above O1/2 between 760 ms and 920 ms. In trials with long SOA and reported awareness,
lateralization of α-power was significant at PO7/8 between 760 ms and 920 ms and from 880
ms to 960 ms at O1/2. No significant lateralization of α-power could be observed in the long
SOA and unaware condition.
The predicting effects of reported awareness, length of SOA and an interaction of both on the
degree of lateralization have been tested via ANOVA analysis. An effect of awareness of the
target stimulus on observed lateralization could be found at O1/2 between 920 ms and 960 ms
after cue presentation (F(1,28)=4.72, p=0.04). Furthermore, a near significant effect of
awareness of the target stimulus at PO7/8 between 920 ms and 960 ms after cue presentation
(F(1,28)=3.13, p=0.09) was observed. These outcomes support the theory that a contralateral
prestimulus decrease in α-activity predicts higher target detection or correct discrimination
30 Discussion
The purpose of this study was to examine whether visual awareness of a stimulus in a target
discrimination task can be predicted by a decrease in contralateral α-power in the posterior
regions of the brain during the orienting phase. A variation of the Posner task (1980) with two
near threshold stimuli was chosen to assess the relation between prestimulus lateralization of
α-power, which was expected to correlate with the direction of visuospatial attention, and the
reported visual awareness of the target stimulus. To try and create roughly even numbers of
trials with and without reported awareness of the target stimulus, the test was programmed to
adapt the duration between target presentation and presentation of the masking stimulus to the
participants performance. Furthermore, in order to avoid bias by systematically disregarding
slower responses, a forced response setting was employed. When responding, both hands had
to be used to give one of four possible responses indicating which target stimulus had been
presented and whether it had been perceived consciously or not.
Instances of lateralized α-activity that was centered at the electrode pairs PO7/8 and O1/2
were measured in the 280 ms prior to target presentation for trials with reported awareness of
the target stimulus. In trials without awareness of the target stimulus, α-activity was measured
in trials with short SOAs, while no lateralized activity could be observed in trials with long
SOAs. A predictive effect of lateralization of α-activity above O1/2 on reported awareness
could be found for the 40 ms interval prior to target presentation. Although expected, no
significant effect was found for lateralized α-activity above PO7/8. Based on the graphical
representation of the distribution of α-activity in figure 5 it can be argued that there is
lateralized α-activity in the last 80 ms before target presentation in the conditions with
reported awareness. This lateralized activity seems to predict reported awareness as it declines
in the condition with short SOAs without awareness of the target stimulus between 80 ms and
31 both conditions without reported awareness of the target stimulus. This was interpreted as a
sign of the statistical analysis lacking power due to the small sample size. Note that the
correlations that were found by conducting statistical analysis were interpreted as predictive
value of lateralized α-activity, as the measured activity that was taken into account was
present before the target presentation.
To begin with, the high correlation between correct responses and reported awareness of the
target stimulus further corroborated the claim that participants would be able to correctly
report conscious perception. Next, the instances of lateralization of α-activity around the
visual cortex and the lack of them in the condition with long SOAs and no awareness of the
target stimulus confirm that lateralized α-power correlates with the covert direction of
visuospatial attention. The fact that the α-activity increases contralaterally to the
not-to-be-attended side further supports the inhibition account of α-activity that was proposed in several
studies (Kelly, Lalor, Reilly & Foxe, 2006; Thut, Nietzel, Brandt & Pascual-Leone, 2006;
Wyart & Tallon-Bauldry, 2009).
Rees and Lavie (2001), and Dehaene, Changeux, Naccache, Sackur and Sergent
(2006) suggested that in order for conscious perception to arise, attention would be a
necessity. Dehaene, Changeux, Naccache, Sackur and Sergent (2006) propose a model that
differentiates not only between subliminal (unconscious) and conscious perception, but add a
preconscious processing. While subliminal processing occurs when the stimulus is too weak
to elicit a large-scale neural activation, preconscious processing is expected to occur with
stimuli that are just sufficiently salient to be perceived, but that are not because they are not
attended to. Conscious perception in this account occurs when a just salient enough stimulus
is attended to, or if a stimulus is salient enough to draw the attention. This concurs with the
findings of the current study: Stimuli in the long SOA condition were reported to not have
32 interval. The presentation time has to have been long enough for the target stimulus to be
detected, because participants were able to detect stimuli with shorter presentation times. The
fact that there was no lateralization of α- activity indicates that there was no direction of
visuospatial attention, which lead to the target stimulus not being consciously perceived. Rees
and Lavie (2001) reported that lesions in parietal areas prevented conscious perception to
arise. They concluded, therefore, that these parietal areas are involved in directing attention
and giving rise to conscious perception. When applying Dehaene, Changeux, Naccache,
Sackur and Sergent’s (2006) approach to this theory, it seems reasonable to suspect that the
missing ability to direct attention prevents processing to exceed the preconscious state.
Several task unrelated instances of α-lateralization in the orienting phase can be seen in figure
4. Lateralized α-activity can be recognized as early as 360 ms after cue presentation. At this
point in time in each trial, the cue was still visible. Activity in the posterior cortex suggested
that the participants interpreted the cue and directed their visuospatial attention to the side to
be attended to in each trial. An additional increase in contralateral α-power was observed
above anterior regions between 440 ms and 560 ms after cue presentation. Rees and Lavie
(2001) and Weisz et al. (2014) deemed this activity crucial to enable conscious perception. As
stated in earlier, this activity could be entirely unrelated (van Rullen; 2011) and was,
therefore, not taken into account.
Figure 5 shows differences in location of the α-lateralization in trials with long and short
SOAs. For trials with reported awareness of the target stimulus and short SOAs, the area with
lateralized α- activity is centered around PO7/8 and O1/2 and more confined than for trials
with long SOAs. These differences were likely also an effect of bias because of the design of
the experiment: Each participant started with long SOAs and was presented shorter SOAs
after adjusting to the requirements of the task and learning when to expect the target
33 perception might be influenced by learning and strategies. It is possible that these strategies
lead to a lower degree of lateralization of α-power, while performance improves over time.
This would explain the more confined area with lateralized α-activity in the condition with
short SOAs and reported awareness with respect to the long SOA aware condition.
General recommendations for future research
After discussing the findings, three design choices that were made in constructing this
experiment are discussed critically to give recommendations for future research:
The first choice was to adapt the SOAs to each participant’s performance. The purpose
of using adaptive difficulty in the experiment was to lower frustration in the participants and
to produce more valid trials for the analysis. Mathewson, Gratton, Fabiani, Beck and Ro
(2009) reported exclusion of a large number of participants while using a fixed SOA of
around 11 ms. Seeing that in this study 12 out of 26 participants could ultimately be
considered in the pilot and the actual experiment, the procedure has to be improved. Possible
downsides to keeping the SOAs adaptive to the participants’ performances were decreased
comparability between the participants and also the uncertainty of how much variance there
would be in the encountered SOAs per participant. At an earlier stage of development of the
experiment, it was also planned to examine the effects of the wave phase of the α-oscillation
at the moment of stimulus presentation. The pilot testing showed a low chance of participants
encountering SOAs of around 45ms or less. In cases of longer SOAs, the duration of target
presentation exceeded the length of a wave phase and therefore made it impossible to make
statements about which phase at the moment of target presentation improved visual awareness
of it. Based on this experiment, it would be recommendable to decrease the number of trials
that are evaluated before the SOAs are adapted, so that changes in the participants’
performance can be corrected for more quickly. If the examination of wave phase is also an
34 The second choice was to not include a distracter stimulus. The focus of this thesis
was the lateralization of α- power before target presentation. Therefore, no distracter stimulus
was presented on the unattended side. Posner, Snyder and Davidson (1980) and Babiloni,
Vecchio, Bultrini, Romani and Rossini (2005) described visuospatial attention as having
exogenous and endogenous qualities. This means that attention can be drawn at the moment
of target presentation as the one side that features the target stimulus undergoes a salient
change while the other does not. Analyzing the data that was collected in this experiment at
the time of target presentation would introduce a bias to the outcomes that cannot be corrected
for at this point. In retrospect, not using a distracter is a downside that does not come with any
advantages. Thus, it should be implemented in future experiments.
The third choice was to ask the participants to report target orientation and visual
awareness of it within a single response. The findings indicate a high correlation of reported
awareness of the target stimulus and correct responses, so it can be said that the participants
were able to successfully employ this method of reporting their answers. Furthermore,
possible bias that might be introduced when giving two separate responses after another was
eliminated. It was however necessary to monitor the participants’ responses and to prompt
them quite often to see if they really were consistently aware or unaware of the target
stimulus. The introduction of control trials will likely improve this process: These control
trials can be manipulated in terms of SOA, stimulus salience, or even in whether a target is
presented or not to produce trials in which participants cannot possibly be truthfully report
being aware or unaware of the target stimulus. They can then be prompted by the
experimenter or presented a prewritten appeal to try and report awareness as reliably as
35 Conclusion
In conclusion it can be said that a decrease in lateralized α-activity in the 40 ms before target
presentation above the electrode pair O1/2 holds predictive value with respect to visual
awareness of near threshold stimuli in target discrimination tasks. This predictive effect and
especially the observation of missing lateralization of α-activity for reported unawareness of
the target stimuli with the longest presentation times and , therefore, highest salience, supports
Dehaene, Changeux, Naccache, Sackur and Sergent’s (2006) theory of a preconscious state of
processing. The employed method that included adaptive SOA and a rather complex manner
of reporting the observed target stimulus and visual awareness of it may have to be further
refined but have proven to be promising in researching the relationship between visuospatial
36 References
Annett, M. (1970). A classification of hand preference by association analysis. British journal
of psychology, 61(3), 303-321.
Babiloni, C., Vecchio, F., Bultrini, A., Luca Romani, G., & Rossini, P. M. (2005). Pre-and
poststimulus alpha rhythms are related to conscious visual perception: a high-resolution EEG
study. Cerebral cortex, 16(12), 1690-1700.
Banerjee, S., Frey, H. P., Molholm, S., & Foxe, J. J. (2015). Interests shape how adolescents
pay attention: the interaction of motivation and top‐down attentional processes in biasing
sensory activations to anticipated events. European Journal of Neuroscience, 41(6), 818-834.
Berger, H. (1929). Über das elektrenkephalogramm des menschen. European Archives of
Psychiatry and Clinical Neuroscience, 87(1), 527-570.
Block, N. (2005). Two neural correlates of consciousness. Trends in cognitive sciences, 9(2),
46-52.
Breitmeyer, B. G., Hoar, W. S., Randall, D. J., & Conte, F. P. (1984). Visual masking: An
integrative approach. Clarendon Press.
Callaway, E., & Yeager, C. L. (1960). Relationship between reaction time and
electroencephalographic alpha phase. Science, 132(3441), 1765-1766.
Chica, A. B., & Lupiáñez, J. (2009). Effects of endogenous and exogenous attention on visual
37 Dehaene, S., Changeux, J. P., Naccache, L., Sackur, J., & Sergent, C. (2006). Conscious,
preconscious, and subliminal processing: a testable taxonomy. Trends in cognitive sciences,
10(5), 204-211.
Foxe, J. J., Simpson, G. V., & Ahlfors, S. P. (1998). Parieto‐occipital∼ 1 0Hz activity reflects
anticipatory state of visual attention mechanisms. Neuroreport, 9(17), 3929-3933.
Haegens, S., Händel, B. F., & Jensen, O. (2011). Top-down controlled alpha band activity in
somatosensory areas determines behavioral performance in a discrimination task. Journal of
Neuroscience, 31(14), 5197-5204.
Hanslmayr, S., Klimesch, W., Sauseng, P., Gruber, W., Doppelmayr, M., Freunberger, R., &
Pecherstorfer, T. (2005). Visual discrimination performance is related to decreased alpha
amplitude but increased phase locking. Neuroscience letters, 375(1), 64-68.
Ishihara, S. (1960). Tests for colour-blindness. Kanehara Shuppan Company.
Jonides, J. (1981). Voluntary vs. automatic control over the mind’s eye’s movement. En:
Long JB, Badeley AD. Attention and performance. Hillsdale, NJ: Erlbaum.
Kastner, S., & Ungerleider, L. G. (2001). The neural basis of biased competition in human
visual cortex. Neuropsychologia, 39(12), 1263-1276.
Kelly, S. P., Lalor, E. C., Reilly, R. B., & Foxe, J. J. (2006). Increases in alpha oscillatory
power reflect an active retinotopic mechanism for distracter suppression during sustained
38 Klimesch, W. (2012). Alpha-band oscillations, attention, and controlled access to stored
information. Trends in cognitive sciences, 16(12), 606-617.
Lamme, V. A., Supèr, H., Landman, R., Roelfsema, P. R., & Spekreijse, H. (2000). The role
of primary visual cortex (V1) in visual awareness. Vision research, 40(10), 1507-1521.
Lamme, V. A. (2004). Separate neural definitions of visual consciousness and visual
attention; a case for phenomenal awareness. Neural networks, 17(5), 861-872.
Luck, S. J., Chelazzi, L., Hillyard, S. A., & Desimone, R. (1997). Neural mechanisms of
spatial selective attention in areas V1, V2, and V4 of macaque visual cortex. Journal of
neurophysiology, 77(1), 24-42.
Mathewson, K. E., Gratton, G., Fabiani, M., Beck, D. M., & Ro, T. (2009). To see or not to
see: prestimulus α phase predicts visual awareness. The Journal of neuroscience, 29(9),
2725-2732.
Mishra, J., Martínez, A., Schroeder, C. E., & Hillyard, S. A. (2012). Spatial attention boosts
short-latency neural responses in human visual cortex. Neuroimage, 59(2), 1968-1978.
Posner, M. I. (1980). Orienting of attention. Quarterly journal of experimental psychology,
39 Posner, M. I., & Petersen, S. E. (1990). The attention system of the human brain. Annual
review of neuroscience, 13(1), 25-42.
Posner, M. I., Nissen, M. J., & Ogden, W. C. (1978). Attended and unattended processing
modes: The role of set for spatial location. Modes of perceiving and processing information,
137, 158.
Posner, M. I., Snyder, C. R., & Davidson, B. J. (1980). Attention and the detection of signals.
Journal of experimental psychology: General, 109(2), 160.
Rees, G., & Lavie, N. (2001). What can functional imaging reveal about the role of attention
in visual awareness?. Neuropsychologia, 39(12), 1343-1353.
Romei, V., Gross, J., & Thut, G. (2010). On the role of prestimulus alpha rhythms over
occipito-parietal areas in visual input regulation: correlation or causation?. Journal of
Neuroscience, 30(25), 8692-8697.
Ryan, R. M., & Deci, E. L. (2000). Self-determination theory and the facilitation of intrinsic
motivation, social development, and well-being. American psychologist, 55(1), 68.
Surwillo, W. W. (1964). The relation of decision time to brain wave frequency and to age.
Electroencephalography and clinical neurophysiology, 16(5), 510-514.
Szpiro, S. F., & Carrasco, M. (2015). Exogenous attention enables perceptual learning.
40 Szumska, I., van der Lubbe, R. H., Grzeczkowski, L., & Herzog, M. H. (2016). Does
sensitivity in binary choice tasks depend on response modality?. Consciousness and
cognition, 43, 57-65.
Thut, G., Nietzel, A., Brandt, S. A., & Pascual-Leone, A. (2006). α-Band
electroencephalographic activity over occipital cortex indexes visuospatial attention bias and
predicts visual target detection. Journal of Neuroscience, 26(37), 9494-9502.
Valera, F. J., Toro, A., John, E. R., & Schwartz, E. L. (1981). Perceptual framing and cortical
alpha rhythm. Neuropsychologia, 19(5), 675-686.
Van der Lubbe, R. H., & Utzerath, C. (2013). Lateralized power spectra of the EEG as an
index of visuospatial attention. Advances in cognitive psychology, 9(4), 184.
Van der Lubbe, R. H., Bundt, C., & Abrahamse, E. L. (2014). Internal and external spatial
attention examined with lateralized EEG power spectra. Brain research, 1583, 179-192.
VanRullen, R. (2011). Four common conceptual fallacies in mapping the time course of
recognition. Frontiers in psychology, 2.
Weisz, N., Wühle, A., Monittola, G., Demarchi, G., Frey, J., Popov, T., & Braun, C. (2014).
Prestimulus oscillatory power and connectivity patterns predispose conscious somatosensory
41 Worden, M. S., Foxe, J. J., Wang, N., & Simpson, G. V. (2000). Anticipatory biasing of
visuospatial attention indexed by retinotopically specific-band electroencephalography
increases over occipital cortex. J Neurosci, 20(RC63), 1-6.
Wyart, V., & Tallon-Baudry, C. (2009). How ongoing fluctuations in human visual cortex
predict perceptual awareness: baseline shift versus decision bias. Journal of Neuroscience,
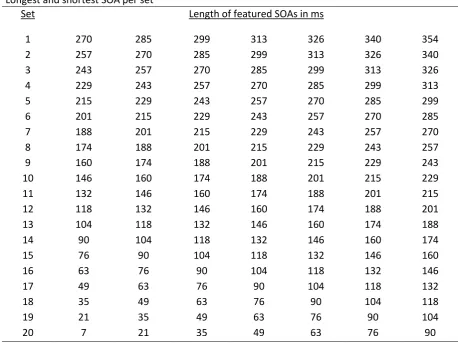
42 Appendix A
Table A provides information about the length of the SOAs in the different sets that were used
to make the difficulty of target detection adaptable to the participants’ performance. Each set
[image:42.595.68.527.215.558.2]contained seven different SOAs with four trials for each of them.
Table A
Longest and shortest SOA per set
Set Length of featured SOAs in ms
1 270 285 299 313 326 340 354
2 257 270 285 299 313 326 340
3 243 257 270 285 299 313 326
4 229 243 257 270 285 299 313
5 215 229 243 257 270 285 299
6 201 215 229 243 257 270 285
7 188 201 215 229 243 257 270
8 174 188 201 215 229 243 257
9 160 174 188 201 215 229 243
10 146 160 174 188 201 215 229
11 132 146 160 174 188 201 215
12 118 132 146 160 174 188 201
13 104 118 132 146 160 174 188
14 90 104 118 132 146 160 174
15 76 90 104 118 132 146 160
16 63 76 90 104 118 132 146
17 49 63 76 90 104 118 132
18 35 49 63 76 90 104 118
19 21 35 49 63 76 90 104
20 7 21 35 49 63 76 90