The classification, semantics, and perception of urban park sounds : methodological issues
9
0
0
Full text
(2) Original citation: Payne, S.R. (2008). The classification, semantics, and perception of urban park sounds: methodological issues. In: Institute of Acoustics Spring Conference 2008, Reading, U.K., Apr 10-11, 2008. Proceedings of the Institute of Acoustics, 30(2), pp. 560 - 567. Permanent WRAP url: http://wrap.warwick.ac.uk/47724 Copyright and reuse: The Warwick Research Archive Portal (WRAP) makes this work of researchers of the University of Warwick available open access under the following conditions. Copyright © and all moral rights to the version of the paper presented here belong to the individual author(s) and/or other copyright owners. To the extent reasonable and practicable the material made available in WRAP has been checked for eligibility before being made available. Copies of full items can be used for personal research or study, educational, or not-forprofit purposes without prior permission or charge. Provided that the authors, title and full bibliographic details are credited, a hyperlink and/or URL is given for the original metadata page and the content is not changed in any way. A note on versions: The version presented here is a working paper or pre-print that may be later published elsewhere. If a published version is known of, the above WRAP url will contain details on finding it. For more information, please contact the WRAP Team at: [email protected]. http://wrap.warwick.ac.uk/.
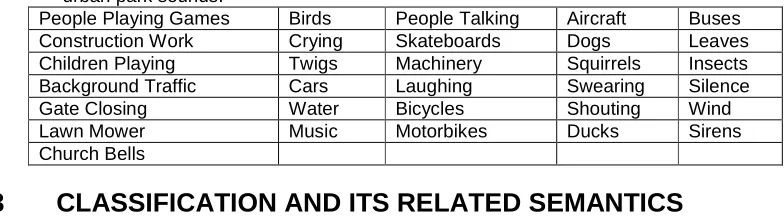
(3) Proceedings of the Institute of Acoustics. Table 1. Sounds identified in urban green spaces and used to assess people’s classification of urban park sounds. People Playing Games Birds People Talking Aircraft Buses Construction Work Crying Skateboards Dogs Leaves Children Playing Twigs Machinery Squirrels Insects Background Traffic Cars Laughing Swearing Silence Gate Closing Water Bicycles Shouting Wind Lawn Mower Music Motorbikes Ducks Sirens Church Bells. 3. CLASSIFICATION AND ITS RELATED SEMANTICS. To assess how people think about and classify sounds, multiple card sorts (MCS) were carried out. It involves presenting participants with a number of stimuli together which enables them to think about the interaction of certain stimuli in one go, rather than concentrating on one stimulus at a time. The way people sort the cards is considered to represent how they conceptualise the different stimuli or concepts10. The associational and semantic links between each of the stimuli or groups of stimuli is more apparent from MCS data, in contrast to methods comparing pairs of stimuli at a time, or rating stimuli separately with Likert based scales. Multi-Dimensional Scaling (MDS) is a collection of statistical analyses that assesses the relationship between two stimuli, whilst also taking into account their relationship with other presented stimuli. MDS is used to analyse MCSs and can also be used to analyse a number of semantic differential scale results. MDS makes a comparison between the individual ratings for each sound (a and b), while still accounting for the sounds relationship with all the other sounds, such as a’s relationship with c, d and e, as well as b’s own relationship with c, d and e. This provides a more accurate assessment of how different stimuli may interact with each other and how they are related, making it ideal for studying semantic associations and classifications.. 3.1. A Multiple Card Sort and Semantic Differential Scale Study. Between September and November 2006, a convenience sample of 38 participants, aged 18 to at least 78 years old, carried out the MCS in reference to a park they were familiar with. The participants were people approached in a number of public places (cafes, shops, pubs) in the day time, to try and get a sample that didn’t consist of students and academics. People were not approached in urban parks themselves to prevent their classification process being influenced by the sounds they happened to hear at that point in time. The MCS involved presenting participants with a card that each had one of the 31 urban park sounds written upon it. Participants were asked to imagine being in the urban park they had identified and think about how they would feel, their moods and activities that are likely to occur there and particularly the sounds they would hear. They were then asked to sort the cards into groups so that similar sounds were placed together. They could make as many groups as they wanted, with each sound only belonging to one group. The instructions were adapted from Scott 10 and Canter . Any comments the participant made were noted to help analyse the reasons for the sorts. Once they had completed the MCS, participants were asked to give each group a label; it was presumed this would be a cognitive label to represent that sound category. They were also asked to assign the group a word that best represents their overall impression of hearing that sound in an urban park; this provided an affective label associated with that sound category. The resulting card sort groups were analysed with MDSORT11, which combines the results from each participant (co-occurrence matrix) and produces a plot of the sounds location within a threedimensional (3D) space. The more often a sound was grouped together with another sound by the participants, the closer the sounds would be located on the 3D plot. Therefore the distances between the sounds on the plot also represent conceptual differences. To help interpret the 3D plots, the category labels created for each of the participants’ groups of sounds were content Vol. 30. Pt.2. 2008.
(4) Proceedings of the Institute of Acoustics. analysed. This involved collating similar category labels together; the use of a thesaurus helped confirm similarities in meaning. Each participant’s original category labels and each category’s sounds were then recoded by the new defined system; the most common labels used to categorise each of the 31 sounds could then be assessed. The frequently used labels represented ‘cognitive’ phrases that were linked to each sound and are referred to as category labels in this paper. The same procedure was conducted with the overall impression responses, which are referred to as affective labels. Participants also rated each of the 31 urban park sounds on two seven point affective semantic differential scales; unpleasant to pleasant and stressful to relaxing. These adjectives were chosen as they have previously been used to affectively rate the environment12 as well as soundscapes8,13. The results were analysed individually for each sound (averages) and collectively (MDS using 11 MDPREF ) to produce similar 3D plots as those produced by the card sorts. The resultant plots for the affective semantic differential scale ratings and the MCS were compared on a scale of 0 to 1 (1 = identical) using PINDIS. All MDS statistical analyses were carried out with NewMDSX software11.. 3.2. Multiple Card Sort and Semantic Differential Scale Results. Participants identified 12 parks on the West of Sheffield, located between 0.2 to 3 miles from the city centre ring road. Some sounds were excluded by half the participants as they did ‘Not Relate/ Associate’ the sounds with their park; others (less familiar and frequent visitors) sorted sounds into categories when they can not actually be heard in the park. The sounds that were most commonly placed together in a category during the MCS are shown in clusters in Figure 1. The conceptual relationships between the urban park sounds can be assessed by the distances between and within the clusters. The results of the semantic differential affective scales are shown in Figure 2. The bigger the distance on the plot between the sounds, the less often they were rated similarly.. 3.2.1 Semantic Labels Associated with Individual and Groups of Sounds In the multiple card sorts, participants created between two and nine categories to sort the sounds, with the mean being five. In total, participants generated 105 differently termed category labels that were reduced down to 20 different category labels using content analysis, some of which included all ranges of a concept e.g. Volume equals Silence to Loud. Each individual sound itself was defined by between 10 to 15 different category labels across the participants, with the mean being 12 labels, showing the variety in language used. The affective labels produced more variation than the category labels; 112 different labels in total, which were collated to form 33 affective labels. Each individual sound itself was defined by between 14 and 20 different affective labels; the mean was 17. Sounds that were excluded during the card sorts were not given an affective label. The resulting category labels were expected to provide more concrete cognitive labels, but often participants used affective terms to describe their categories, making the semantics of the two types of labels very similar, see Table 2. In particular the verb ‘expect’ was used the most (15 people) in both the category and affective labels. The most common category and affective labels for each sound were identified and these labels were used to define the clusters of sounds identified as similar by the participants (Figure 1). Inspection of the plot shows clear divisions between different types of sounds and how they are described with category and affective labels producing similar divisions. The right hand side of Figure 1 contains the sounds that are ‘Expected’, while the left hand side has sounds that are ‘Not Related to the park’ (bar Background Traffic). The sounds on the right are ‘Peaceful’, ‘Pleasant’, and ‘Enjoyable’, while on the left the sounds produce ‘Negative Emotions’ and are ‘Annoying’. There is also a division between ‘Natural’ sounds on the right, ‘People’ in the middle and more transportation/mechanical sounds on the left. These divisions show that hearing the ‘Expected Natural’ sounds is a positive thing, while more mechanical sounds are not related to urban parks and are therefore negatively rated. ‘People’s’ vocal sounds are sub-differentiated by their affective evaluations – positive or negative. Silence is also slightly separated from the ‘Natural’ sounds as for some people it was ‘Not Expected’ and even ‘creepy’. Vol. 30. Pt.2. 2008.
(5) Proceedings of the Institute of Acoustics. Figure 1. 3D plot of participants’ classification of urban park sounds; results of a multiple card sort. Category labels are in bold blue. Affective Overall Impression labels are in bold blue italics.. Figure 2. 3D plot of participants’ affective semantic differential scale ratings of urban park sounds. Affective dimensions that sounds were rated on are in bold blue. Vol. 30. Pt.2. 2008.
(6) Proceedings of the Institute of Acoustics. Table 2. The number of participants who used the top 5 mentioned Category and Affective labels. Category Label Not Related/ Associated to the park Expect → Don’t Expect People Negative Emotions Natural Volume (Silence → Loud). Number of Participants 16 15 15 13 11 10. Affective Label. Number of Participants. Not Related to the park/ Excluded Expect → Don’t Expect Annoying Like → Don’t Like Enjoyable Peaceful → Not Peaceful. 15 15 11 8 8 7. 3.2.2 Affective Semantic Differential Scale Results and Classifications Many (21%) of the results for the semantic differential affective scales produced a skewed distribution, suggesting peoples’ affective evaluation of sounds is generally similar. Each sound received the same average rating on the un/pleasant scale and the stressful/ relaxing scale, bar four sounds (which only differed by one Likert point). The ‘Natural’ sounds were rated more pleasant and relaxing; Water and Birds had an average rating of 7, (the maximum). Ducks, Leaves, Silence, Wind and Laughing were also pleasant and relaxing (rated 6 or 7). The most stressful and unpleasant sounds were Construction Work, Machinery, Sirens and Swearing. The transport orientated sounds were also rated poorly, with an average rating of 2 or 1. Multidimensional plots of the affective ratings for both semantic differential scales were created, but due to their high similarities [P(0), S(Z,X)=.85], the results were combined to form one affective plot [convergence test in generating the centroid configuration =.96], see Figure 2. The Pleasant/ Relaxing and Unpleasant/ Stressful scale is noted along the horizontal axis. Natural sounds and sounds of people enjoying themselves are at the Pleasant/Relaxing side of the plot, while more mechanical and other people vocal sounds are on the opposite side. This pattern of clustering is similar to that described above for the MCS results. Visual inspection of Figure 1 and 2 indeed shows similarities between the plots. This is confirmed with their moderate statistical match, P(0), S(Z,X)=.42 (calculated with PINDIS11), which is potentially only moderate due to the affective semantic scale results not varying much in one dimension, due to the bipolarity of the scales. Cluster groups are not so clearly defined in the affective differential semantic scale results; for example Crying, Swearing and Shouting aren’t situated close together like they are in the MCS.. 3.3. Multiple Card Sort and Semantic Differential Scale Discussion. This study was able to identify the terminology that urban park visitors use to classify sounds that 1,2 are perceived within urban green spaces. Compared with labels used by researchers , both similarities (the use of Natural and People categories), and differences (no Mechanical category), were noted. Affect was an important factor in the classification and labelling of the sounds. Consistent with prior research13, natural sounds were rated positively. The implications of these results are discussed in turn along with comments on the methodological approaches involved. Urban park users, like researchers differentiate between sounds that are described as Natural and those that are People orientated. In contrast to these commonalities, the researcher derived label, Mechanical, was hardly ever used by urban park visitors, instead affective terms were used to describe such sounds. A Mechanical label may help describe sounds consisting of certain pitches or generated from certain objects, but laypeople associate the sounds with the everyday world continuing around them and these sounds are generally perceived as a negative intrusion into the park. Background Traffic is an exception though as it is rated more positively and gives some people the reassuring sense of things still continuing ‘out there’ in the world, suggesting caution should be taken with the general assumption that transport sounds are disliked. This confirms the need to not only study the physical attributes of the sound, but also the meaning associated with the sound source that the everyday listener uses to understand, classify and assess their soundscape. Vol. 30. Pt.2. 2008.
(7) Proceedings of the Institute of Acoustics. The MCS method used within this study identified the nuances and finer classification levels that can be overlooked by the broader categories often used by researchers. Urban park users split People sounds into three subcategories, dependent on expectancy and affect (Expect/Not Related, Expect and Enjoy, Annoying). The equivalent category to Mechanical sounds was also split into three different subcategories (Expected, People related, and Annoying sounds). The classification system often used by researchers may well represent a higher classification level to the sublevels used by laypeople. Therefore depending on the evaluation and level of detail that is being researched, the terminology used to study the sounds is important. This is emphasised by the description of the sounds generally being object words or categories which reactivate the same neural pathways in the brain as if perceptual stimulation had occurred14. The correct terminology is therefore necessary to ensure it relates to the individual so that the relevant meanings and associations are also activated and considered. Affect was suggested as an important factor in people’s classification of urban park sounds in the multiple card sorts, with affective terms being used to label individuals’ card sorts when more cognitive descriptive labels had been predicted. These results were supported by the similarity in the location of sounds in the MCS plot and the affective semantic differential scale plot. To some extent the semantic differential scale results added little extra information to that discovered via the MCSs. In fact the MCS was able to show more affective nuances, such as the separation of Background Traffic and Silence, which can not be identified within the results of the semantic differential scales. These nuances also emphasise the importance of making the study relevant to the participant, by focusing on a known place. Peoples lived experiences and interactions with a place are important in shaping how they think about sounds and their environment. The context therefore provides the sounds with a particular meaning which in turn may influence their affective evaluation and how the sounds are classified. Together the results suggest multiple card sorts have distinct advantages over semantic differential scales. Firstly small nuances can be identified within the MCS that aren’t shown in the semantic differential scale results, due to the limitation of scales only varying across a 5 or 7 point range. Secondly MCSs allow other affective or non-affective terms to be used, while still potentially providing the positive to negative distinction derived from semantic differential scale results. Thirdly, 8 issues of true bipolarity of the scale terms have been questioned . Fourthly assessing affective evaluations using semantic differential scales may create the same problems as using researcher defined classifications if the scale terms are pre-defined by the researcher. This limits the participant to answering in a certain way, assessing only a few affective terms (e.g. 4 in this instance) instead of any number of terms that may be generated by the participants (e.g. 33). The process of completing a number of scales can also become monotonous for the participant. In contrast MCSs give the participant more freedom to define and assess items using their own terminology and in a way that is more meaningful to them, as well as being a lot more enjoyable. This MCS study however did rely on participant’s memory of urban park sounds within a familiar place, rather than being in situ. This could explain the high use of ‘Expected’ sounds as a schematised impression of what would be heard in urban parks was being recalled. Participants were not in situ due to logistical reasons of getting a substantial number of the public to one place to carry out the sort at the same time, as well as the space (and lack of wind!) needed to carry out a MCS. Having people in situ also causes the same problems which could have arisen if audio clips were used instead of written descriptions as stimuli. This would make the classification dependant on the exact sound that was heard and these may generate different results than if other examples of the sound had been heard. For instance with birds, the sound of the dawn chorus would probably be interpreted very differently to a cackle of pigeons; thus choosing the most representative audio clip to be used in a study becomes an issue. Using written descriptions of sounds as stimuli also aids the participant in considering all the sounds and their relationship with one another in one go, in contrast to listening to audio clips one at a time and trying to remember each of them, to be able to assess how they relate to each other. Therefore although the procedure used to carry out the MCS has known downfalls, it is still considered to be more appropriate than semantic differential scales for producing and examining laypeople’s classification of urban park sounds. Vol. 30. Pt.2. 2008.
(8) Proceedings of the Institute of Acoustics. 4. THE CLASSIFICATION SYSTEM PUT INTO PRACTICE. In all, seven clusters of sounds could be identified from the MCS study. Using these clusters and their associated labels, types of urban park sounds were identified for the subsequent study. Unfortunately because many of the category labels were ‘Expect’ or involved affective terms, and not descriptive terms, the types of sounds couldn’t be directly defined from the MCS labels. Instead other terms had to be derived on the basis of the sound clusters, sticking to the results and terminology as close as possible. The seven sound types were defined as ‘Natural sounds’, ‘Happy People Sounds’, ‘Sad/Angry People sounds’, ‘Object sounds due to People in the Park’, ‘Sounds from the Surrounding Buildings’, ‘Individual Vehicle or Aircraft sounds’ and ‘Background City/Traffic’.. 4.1. An In Situ Study. The seven listed sound types were presented as part of a questionnaire carried out in situ in two urban parks within Sheffield. Four hundred park users, who were just leaving, were asked a series of questions about the park, including their perceived urban park soundscape. Specifically they were asked to name some sounds they’d heard while they were in the park. They were then presented with a description of the seven sound types with examples, alongside lines with a percentage scale ranging from 0 (Didn’t hear) through to 50 (Half) through to 100 (All the time). Participants were asked to make a mark on the line which represented how much of the time they’d heard each of the sound types while they’d been in the park. Then for each heard sound type, they rated the volume at which they had generally heard it, on a 7 point semantic differential scale from quiet to loud. A predominance value was calculated for each sound type, by multiplying the amount it was heard (percentage) by its perceived volume (1 to 7). A highly predominant sound type therefore represents sounds that were heard a lot and at loud levels; values range from 0 to 700.. 4.2. Results and Discussion. The list of sounds that the participants freely stated was similar to the results of section 2, with a total of 1123 sounds being stated. These sounds were then coded by the same seven sound types, along with a few more relevant categories for the data (Dogs, Peacefulness, Absence of a particular sound, and Others). Two individuals coded the sounds into these eleven categories with inter-rater reliability being moderate (κ=.64). Most disagreements were over People sounds, in particular the interpretation of ‘people talking’ as Happy instead of a neutral expression. ‘Screaming children’ was also hard to categorise, as depending on the situation this may be the result of different emotions, such as anger, fear, or happiness (e.g. children playing/running around), yet according to the results of the preceding multiple card sort study, screaming should be coded as a negative People sound. The same coding problems arose in situ with participants deciding which categories their perceived sounds fitted into; comments were made such as “I guess the people talking were happy”. Such problems were also highlighted by the ‘contradictions’ between participants freely stated sounds and the percentage of time the seven sound types were heard. For example some participants freely stated hearing ‘screaming children’ but marked 0% for the Sad/Angry People category. These contradictions were supported via comparing the mean predominance levels of each sound type, for those whose first freely stated sound (presumed to be a predominant sound), was categorised as a Sad/Angry People sound; they had a higher predominance level for Happy People sounds (=326) than any other sound type, including Sad/Angry (=95). These results again suggest that screaming is not necessarily a negative sound and depending on the situation, may indeed be a happy sound. Together these studies show there are still difficulties in taking laypeople’s classification of sounds (the first MCS study) and presenting them to other people (the in situ study, participants and coders) to categorise sounds. The importance of the context and the exact situation and interpretation of events by the perceiver has a big effect on how the sounds will be classified. To try and avoid similar problems again when using these sound types the People labels of Happy and Sad/Angry sounds could be altered to Enjoyable and Annoying sounds respectively. Although this involves affective labels, which were trying to be avoided, it makes the classification system more Vol. 30. Pt.2. 2008.
(9) Proceedings of the Institute of Acoustics. relevant to the current context and the individual who will be coding the sounds. Therefore the new affectively termed categories allow variations in how the sounds and context are perceived, thus hopefully removing the coding and classification issues that occurred in the latter study.. 5. OVERALL CONCLUSION. The importance of studying how the general public describe, label and categorise urban park sounds was shown by the nuances and subcategory labels they used in contrast to the broad categories often utilised by researchers. Multiple card sorts were found to be a more useful, flexible methodology for studying semantics and classifications than semantic differential scales. Seven types of sounds were identified by one group of participants which was then presented to a second set of participants in urban parks. Some problems arose with the interpretation of categories by the latter participants and other coders. These issues emphasise the importance of the language used and being presented to participants when describing and seeking evaluations of soundscapes.. 6. ACKNOWLEDGMENTS. The author acknowledges that part of this paper is a redrafted version of a presentation made at the Inter-Noise conference (2007); ‘People’s perceptions and classifications of sounds heard in urban parks: semantics, affect and restoration’ by S.R. Payne, P. Devine-Wright, & K.N. Irvine. The author would like to thank funding from the EPSRC, University of Manchester and De Montfort University.. 7. REFERENCES. 1.. R.M Schafer. Soundscape. Our sonic environment and the tuning of the world. Vermont, USA: Destiny books. (1994). V. Rozec. ‘The influence of a specific urban planning on sonic environment’. In People, Places and Sustainability. Eds. G. Moser, E. Pol, Y. Bernard, M. Bonnes, J.A. Corraliza, and M.V. Giuliani. Seattle, USA: Hogrefe & Huber Publishers. (2003). D. Dubois. ‘Categories as acts of meaning: the case of categories in olfaction and audition’. Cognitive Science Quarterly. 1, 33-66. (2000). K. Kawai, T. Kojima, K. Hirate and M. Yasuoka. ‘Personal evaluation structure of environmental sounds: experiments of subjective evaluation using subjects’ own terms’. Journal of Sound and Vibration. 277, 523-533. (2004). L. Groat. ‘Meaning in post-modern architecture: an examination using the multiple sorting task’. Journal of Environmental Psychology. 2, 3-22. (1982). D. Dubois, C. Guastavino and M. Raimbault. ‘A cognitive approach to urban soundscapes: using verbal data to access everyday life auditory categories’. Acta Acustica United with Acustica. 92, 865-874. (2006). J. Ge and K. Hokao. ‘Applying the methods of image evaluation and spatial analysis to study the sound environment of urban street areas’. J.Env.Psy. 25, 455-466. (2005). M. Raimbault. ‘Qualitative judgements of urban soundscapes: questioning questionnaires and semantic scales’. Acta Acustica United with Acustica. 92, 929-937. (2006). S. Kuwano, S. Namba, T. Hashimoto, B. Berglund, Z. Da Rui, A. Schick, H. Hoege and M. Florentine. ‘Emotional expression of noise: a cross-cultural study’. Journal of Sound and Vibration. 151(3), 421-428. (1991). M.J. Scott and D.V. Canter. ‘Picture or place? A multiple sorting study of landscape’. Journal of Environmental Psychology. 17, 263-281. (1997). The NewMDSX series of multidimensional scaling programs. http://www.newmdsx.com J.A. Russell and G. Pratt. ‘A description of the affective quality attributed to environments’. Journal of Personality & Social Psychology. 38(2), 311-322. (1980). S. Viollon, C. Lavandier and C. Drake. ‘Influence of visual setting on sound ratings in an urban environment’. Applied Acoustics. 63, 493-511. (2002). Z. Estes, M. Verges and L.W. Barsalou. ‘Head Up, Foot Down. Object words orient attention to the object’s typical location’. Psychological Science. 19(2), 93-97.. 2.. 3. 4.. 5. 6.. 7. 8. 9.. 10. 11. 12. 13. 14.. Vol. 30. Pt.2. 2008.
(10)
Figure

Related documents
Development of the curriculum of the Master of Advanced Industrial Management European Academy on Industrial Management (AIM) Industrial enterprises & Organizations.
The articles in this special issue of Systematic Reviews il- lustrate the overall development and impact of research evidence synthesis in The Cochrane Collaboration over the last
As the sovereign debt crisis moved from the peripheral European countries to Italy, all eyes were on the Italian government to see how it would attempt to implement policies
At any time during 2020 did you receive, sell, send, exchange or otherwise acquire any financial interest in any virtual currency. Yes ____
Main- tenance fluids preferably contain 3 volume of isotonic solution of sodium salts and % free water ( as 5 to 10% glucose solution).
Keywords: baby food industry, infant and young child nutrition, corporate influence, breastfeeding, Code of Marketing of Breast-milk Substitutes, advertising, promotion,
Prevalence of the pathogen in tick population were 13.65% in overall assessment and in pasture and forest ticks and these results differed moderately as 12.5% and 22.9%
(You can see on Figure 3 that the student has drawn on the progressive wave positions P, Q, and R at each following quarter cycle. They then used the vertical line through A to
