DYNAMICS OF BANKING TECHNOLOGY ADOPTION:
AN APPLICATION TO INTERNET BANKING
Yoonhee Tina Chang
No 664
WARWICK ECONOMIC RESEARCH PAPERS
Dynamics of Banking Technology Adoption:
An Application to Internet Banking
*Yoonhee Tina Chang= Department of Economics
University of Warwick January 2003
Abstract
This paper is concerned with examining behaviour of firms (banks) and consumers (banks’ customers) in the event of a new technology (internet banking) introduction. The determinants of consumer adoption of internet banking are characterised using survey data from Korea in both static and dynamic framework. I find evidence that adoption of internet banking is influenced by sex, age, marital status, degree of exposure to internet banking, and the characteristics of the banks. A duration analysis shows no evidence of first mover advantage (order effects) in internet banking whilst the largest bank (rank effects) in commercial banking remains dominant in internet banking. The results imply that the internet bankin g adoption is dominated by social norm effects.
JEL Classification: D80, G21, G28, L00, L89, O33
Key words: internet banking, technology adoption, first-mover advantage, pre-emption, social norm
Approximate Word Count: 10,000 words
*
I am grateful for encouragement and many helpful comments from Keith Cowling and Jeremy Smith. I also thank Margaret Slade, Mike Waterson, Mark Stewart, Wiji Arulampalam, Matthew Haag,
Massimiliano Bratti and participants at the University of Warwick workshops, the European Association for Research in Industrial Economics Conference 2002, the European Network on Industrial Policy Conference 2002 for comments and discussions. All errors are mine.
=
1. Introduction
The banking industry has been significantly influenced by evolution of technology1. The growing applications of computerised networks to banking reduced the cost of transaction and increased the speed of service substantially. The nature of financial intermediaries made banks improve their production technology by focusing on distribution of products. In other words, the evolution of banking technology has been mainly driven by changes in distribution channels as we see evidence from over-the-counter (OTC), automated-teller-machine (ATM), phone-banking, tele-banking, pc-banking and most recently internet pc-banking (IB)2.
Network effects and standardisation have become popular topics with increasing number of internet users and the application of internet to e-commerce and finance. In particular, network effect and standardisation are arguably the most common reasons for concentrated market structures in technology intensive industries3. Hence, it seems natural to consider progress in banking technology as a reason for market consolidation given the nature of network in banking. However, we lack studies on consumer behaviour relative to the vast amount of literature on firms’ behaviour regarding technology adoption and market structure. I argue that customer inertia and risk aversion in characterising internet banking users (IBU) suggest that aggressive expansion in internet banking is simply a pre-emptive action by banks with little impact on the market structure.
In this paper, I use online survey data from Korea on internet banking to analyse the adoption pattern of banking technology diffusion across customers 4. Firstly I characterise the determinants for consumer adoption of a new banking technology (internet banking). I examine the internet banking adoption process in both a static and a dynamic framework to explain why new banking technologies are not always taken up by the mass-market. Subsequently I identify different characteristics between early adopters and late (i.e. delayed) adopters using parametric and semi-parametric duration models and show how the results differ between different model specifications.
The above specifications allow me to investigate empirical issues of banking technology concerning customer inertia, risk aversion and pre-emption. I find evidence that given the possibility of multiple equilibria when the bank products are incompatible, the reputation of the bank becomes important. The new banking technology can also face excess inertia as bank customers are somewhat tied to old technologies. More importantly, risk aversion plays an important role in determining the probability of
1
See Hannan and McDowell (1984), Gourlay and Pentecost (2002) 2
The FSS in Korea defines the internet banking as computer network based banking, which includes automated transfer of money, settlement of bills, and realisation of general financial service network. On the other hand, Cave and Mason (2001) define internet as a global network of networks. Their paper elaborates the mechanism of internet
3
Examples are the internet browser industry with two leading technologies Netscape and Microsoft Internet Explorer and VHS vs. Beta Max in the 70s. Hannan and McDowell (1984) investigate a concentrated market structure in banking with respect to the diffusion of ATM machines. Sutton (1999) also illustrates network effects and standardisation in detail for technology driven industries.
4
adoption. Furthermore, I show these empirical issues related to internet banking can provide grounds for incumbent banks to take pre-emptive actions.
In section 2, the new banking technology (internet banking) and factors likely to affect its diffusion are described. Section 3 investigates theoretical and empirical literature related to technology diffusion. I develop and compare econometric models of adoption in Section 4 and report estimates from these models and discuss the analysis in Section 5. Finally, Section 6 concludes.
2. Overview of Internet Banking
One might remember the days when he/she physically had to go to a bank branch to deposit or withdraw money and get a bank statement book manually updated by a teller over the counter (OTC). With the introduction of computer networks, a networked printing machine started replacing the manual update of statements. Then, cash dispensers (CDs) and automated teller machines (ATMs) were introduced to facilitate withdrawals, deposits and even transfers accommodating mobility in much wider geographical areas. Phone banking was a revolutionary concept but one of the most substantial changes in banking technology is the recent introduction of internet banking. As banking technology has focused on reducing cost of distribution, internet banking is characterised as a process innovation by making customers handle their own banking without going to bank tellers. It also allows non-customers to visit virtual banks via public web-network while phone-banking or PC-banking provide only closed network limited to the existing clients. Considering new products and services specifically designed and offered on the internet given the new technology feature, one might argue that internet banking has also an aspect of product innovation as well5.
Regarding product innovation tied to internet banking, increasing competition amongst the leading banks promotes product and service differentiation. For example, despite the Internet Banking System (www.banktown.com) developed in 1999 by the consortium led by Korea Telecom and several banks, most leading internet banking providers are now using their own system to differentiate their service products. Moreover, banks offer comprehensive asset management packages on the internet linking non-traditional banking products (bundling). Currently all 17 commercial banks in Korea are providing internet banking although their range of services may vary.
Banking competition is assessed in three different ways, price (interest rate), quantity (deposit and loan size) and quality (reputation-relationship). Traditionally banks have competed in branch network (quantity) to increase the number of clients, i.e. the deposit and loan size. However, with the benefit of new technologies, the quantity competition seems to be replaced by the network competition in ATM or internet banking. Internet creates a potentially competitive market outcome in the presence of both internal and external threats. Threats within the industry increase as product and service information
5
becomes more transparent on the internet. External threats arise with lower entry barriers for those with advanced internet technology.
According to the Bank of Korea report (using quotes from Wall Street Journal Report), Korea has the highest internet banking penetration ratio per head. Currently, almost one out of four people (approx. 24%) are registered IB users. Internet banking was first introduced by Chohung Bank in Korea at the beginning of 1998, which was followed by rival banks throughout 1998. The number of IB offering banks reached 13 by the end of 1999 and continuously increased to 20 by the end of 2000 and currently all 17 commercial banks offer IB alongside 4 specialty banks (cooperatives), two foreign banks, postal savings, and district banking corporation (Saemaul Geum-ko)6. Not only the speed of IB adoption by banks has been extraordinary but also the adoption by customers has been extremely fast. The number of registered internet banking users has nearly doubled every quarter until the end of 2000, although the speed of adoption now seems to be slowing down. It is worth identifying why so many people adopted internet banking at such extraordinary speed.
3. Background Literature and Facts
The importance of technological progress in economic growth and social welfare has long been recognised by many economists. Schumpeter (1934) pioneered studies on technology, which was subsequently emphasised by Solow (1957) in his economic growth literature. Schumpeter’s view on technology rejected the anti-trust orthodoxy and argued large firms operating in a concentrated market structure would encourage technological progress, whilst Solow claimed that a good proportion of growth residual might be explained by changes in technology. On the other hand Davies (1979) argued that society fully benefits from a process or product innovation only when the innovation is diffused enough to enhance the firm’s productivity or the consumer’s utility. However, most of the earlier literature on technological progress focused on the firm’s behaviour analysing how process innovation would influence its productivity leaving the consumer behaviour in relation to product innovation less frequently discussed7. Study on consumer adoption behaviour of financial technology is almost next to none. Gourlay and Pentecost (2002) point out that research into the inter-firm diffusion of new technology has paid relatively little attention to the determinants of innovation diffusion in the financial sector compared to other industries.
Katz and Shapiro (1985) examine network compatibility as an element of competition and show consumers’ expectations on network externalities play an important role in determining an equilibrium. In other words, the reputation of the firm on networks is important. They also claim that consumers’ benefit from the use of a product increases when there is a large number of other consumers purchasing compatible items (Katz and Shapiro, 1986). In internet banking, the installed base should increase customer utilities via physical network8. Another important contribution of their work is intertemporal substitution in technology adoption. Some consumers may choose to wait for cost and
6
The information is as of Dec. 2001. 7
In the same context, Waterson (2001) draws attention to consumers’ reluctance to search and switch suppliers in relation to competition and competition policy analysis.
8
demand uncertainty to be resolved before they commit themselves to a specific technology. This aspect is yet to be proved empirically in banking technology.
Farrell and Saloner (1986) also investigate installed base and compatibility. They claim a new standard can face excess inertia as installed-base users are somewhat tied to the old technology, which explains why new technologies are not always taken up by the mass-market. More recently, Mason and Weeds (2001) identify three different inefficiencies of premature adoption in the presence of network externalities and examine the effects of uncertainty, network effects and pre-emption on inefficiencies. Early epidemic models of diffusion use an analogy between the contact among firms or consumers and the spread of disease (Mansfield, 1968). For example, some consumers adopt a new technology before others because they happen to become infected first. Similarly, some technologies diffuse faster than others, as they are more contagious due to its profitability and risk factors. In contrast, Karshenas and Stoneman (1993) point out that contemporary approaches have put less emphasis on information spreading as the key explanatory variable of innovation diffusion summarised into three different mechanisms:
1/Rank effects, suggest that only firms with sufficiently high ranking will adopt an innovation when it first becomes available. However, as the cost of adoption falls over time, lower ranked firms will adopt as well9.
2/Stock effects, result from the assumption that early movers obtain higher returns on the new technology and the marginal return of adoption decreases with the increase in number of adopters10.
3/Order effects, are applicable when there is a fixed amount of critical input into production. In such situations, only early movers who secure access to the critical input will find it profitable to adopt. The order of adoption clearly matters.
Hannan and McDowell (1990) examine the impact of bank adoptions of automated teller machines (ATMs) on subsequent levels of concentration in local banking markets. They find strong support for the existence of rank effects in the diffusion of ATMs, while rejecting the existence of epidemic effects. However, they do not investigate the consumer adoption behaviour, which I believe plays an important role in banking industry structure. They propose if larger banks adopt ATMs, markets tend to be more concentrated and vice versa. However, the diffusion of a new banking technology is relatively fast across large and small banks nowadays and sometimes a government consortium leads the market toward a new technology simultaneously11. Therefore, it is difficult to justify that market concentration is due to early adoption by larger banks. Waterson (2001) suggests consumer search behaviour is sub-competitive in current account banking compared to motor car insurance and therefore the market structure tends to be more concentrated in banking than in motor car insurance. One of the main
9
See Davies (1979) for further examples of rank effects. 10
Reinganum (1981) discusses the strategic behaviour of firms in this context. 11
differences between the two industries lies in credit rating system. Bank-specific credit rating builds up over time whereas credit rating for motor insurance is transferable between insurance companies. Thus, long-term aspects of credit rating in banking may explain why consumers are reluctant to switch their banks. This coincides with my pilot test results where the majority did not switch their banks despite more favourable internet banking offers from rival banks.
Following Gilbert and Newbery (1982)’s approach, I consider product differentiation on internet banking as a preemptive innovation. I argue internet banking creates a new dimension of banking competition where banks compete in different networks via product diversification and differentiation. Fudenberg and Tirole (1985) also use a similar approach for the adoption of a new technology to illustrate the effects of pre-emption in games. However, they argue that threat of pre-pre-emption equalises rents in a duopoly, but does not extend to the general oligopoly. If the gain to pre-emption is sufficiently small, the optimal symmetric outcome (late adoption) is an equilibrium. This contrasts with Reinganum (1981)’s result in pre-commitment equilibria, which leads to diffusion. In other words, despite the small gain, the adoption of new technology prevails in oligopoly, especially when the information lags are short and firms can observe and respond to their rivals’ actions. Reinganum (1981) applies a game theoretic approach to market structure to investigate firms’ strategic behaviour in the adoption of new technologies.
More recently, Akhavein et al. (2001) point out a few quantitative studies on the diffusion of new financial technologies and the weakness where the technology is limited to ATMs. In the hazard model analysis, they suggest large banks innovate earlier (pre-emption) and the tobit model also suggests banks with fewer separately chartered but with more branches innovate earlier.
With internet banking, innovation certainly improves productivity via cost cutting in distribution but diffusion pattern amongst consumers is equally important. In order to link the firm behaviour and the consumer behaviour, I take some insight from behavioural studies on adoption.
Diffusion research did not develop from a single discipline. Different disciplines led to the development of this theory and the history goes back to Tarde (1903)’s Laws of Imitation, which conceptualised imitating behaviour using a selectionist rationale. Throughout the last century, his laws of imitation have influenced a substantial amount of diffusion studies across many disciplines, including sociology, anthropology, general economics and many others. Since Tarde, there have been a plethora of studies that tried to link imitation within a social structure, consumer behaviour, industrial structure and welfare economics. However, the effort to link the above sociological aspects of economics were somewhat neglected recently with an increasing focus on technological development. Technological development could be one of the main factors for economic growths in the post 20th centuries. However, without identifying why and how consumers adopt new technologies in the social context, the research on technology is incomplete.
crisis focused on conventional macroeconomic variables, such as human capital and investment. Janelli and Yim (1997) criticise that a Western intellectual tradition has sought to dichotomise explanation of human actions into the ideal and the material. They suggested the rational choice theory must be considered in the social context and acknowledged the existence of mutually supportive relationships between cultural understandings and the pursuit of development goal (material) in Korea. Greif (1994) uses a similar approach and argues that a path of economic growth is not a mere function of endowment, technology, and preferences but a complex process in which the organisation of society plays a significant role. The organisation of society reflects historical, cultural, social, political and economic processes.
As long as consumers imitate from their immediate social contacts or networks, idiosyncratic elements of a society and culture must not be overlooked. Macdonald (1990) points out strong family ties and importance of community life in Korea where they tend to place the concept of “We” ahead of “I”, i.e. conformity and collectivity rather than individualism. Hence, it looks natural to see such a fast diffusion of internet banking in Korea whilst most developed countries are not yet to adopt internet banking as their main channels for banking. As Koreans are proposed to conform to their social norm, once internet banking is perceived as their social norm, the socio-economic gaps narrow by the conformity.
For diffusion, one of the most common approaches is applying social leader concept. Becker (1970) finds substantial correlation between an individual’s adoption timing of an innovation and both his/her relative position in sociometric network and his/her most valued source of information and suggests that early adopters are opinion leaders. Rogers (1995) overviewed a vast amount of publications related to innovation diffusion and summarises socio-economic characteristics of adopter categories: early adopters to laggards. He also claims that opinion leaders are at the core of respective networks. Another approach adopts rational decision process. Rosenberg (1976) argues that in many markets prospective buyers for an innovation are strongly influenced by expectations concerning the timing and significance of future improvements. In other words, the optimal decision process of innovation adoption depends on technological expectations and learning. As a similar approach of rational decision process, McFadden and Train (1996) explain that when a new product with unknown attributes are offered, customers determine whether they like the product by trying it themselves or by waiting to observe the experience of other customers. They investigate the implications of learning from others on the sales of new products and the impact of advertising.
Stoneman and Diederen (1994) raise another important issue of public policy for technology diffusion. They explain diffusion may be too fast if firms adopt a technology before it is profitable to do so, or if firms adopt a new technology today that effectively preempts the adoption of a superior technology in the future. For instance, when customers are exposed to unidentifiable amount of risks via internet banking, the important role of public policy is to mitigate the risks in early adoption.
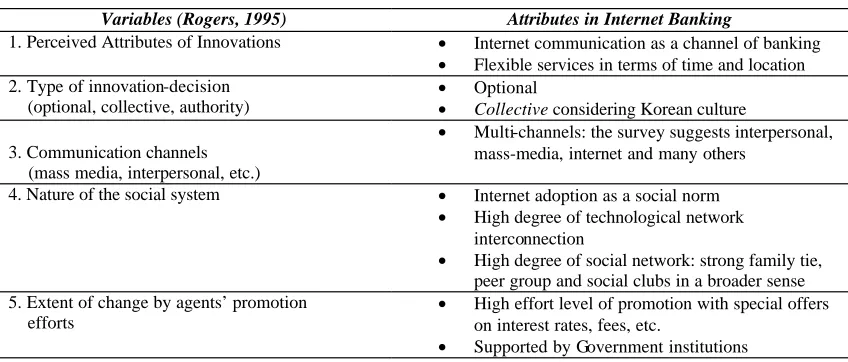
[image:9.595.81.505.283.464.2]Rogers (1995) argues that a common problem in diffusion research is the individual-blame bias, i.e. the tendency to hold an individual responsible for his or her problems, rather than the system of which the individual is a part. Following the criticism, he suggested five main variables determining the rate of adoption variables, to which I link the potential attributes associated with internet banking (see Table 1).
Table 1. Adoption Variables and Attributes in Internet Banking
Variables (Rogers, 1995) Attributes in Internet Banking
1. Perceived Attributes of Innovations • Internet communication as a channel of banking
• Flexible services in terms of time and location
2. Type of innovation-decision (optional, collective, authority)
• Optional
• Collective considering Korean culture
3. Communication channels (mass media, interpersonal, etc.)
• Multi-channels: the survey suggests interpersonal,
mass-media, internet and many others
4. Nature of the social system • Internet adoption as a social norm
• High degree of technological network
interconnection
• High degree of social network: strong family tie,
peer group and social clubs in a broader sense 5. Extent of change by agents’ promotion
efforts
• High effort level of promotion with special offers
on interest rates, fees, etc.
• Supported by Government institutions
Considering technology diffusion as a social phenomenon, some cultural aspects of Korean society including the Confucian tradition and its impact on education are worth mentioning. Macdonald (1990) claims that the enormous importance attached to education in Korea is a principal reason for the nation’s rapid development. This general attitude towards education is rooted in the Confucian tradition, where entry into government service was obtained through years of study of the Confucian classics12, proven by examination. Back then, government positions were the only way to rise in the world and thus, education was the key to fame and fortune. Education is still regarded as the key to success by modern Koreans.
Formal education in Korea is reinforced by the community sense, i.e. conformity society. Macdonald (1990) points out that part of the role of Korean family and community has been taken over by groupings based on common local origin, common school experience, and common workplace. People within such groups have a strong sense of shared identity and mutual responsibility. Hence, a certain level of formal education is essential for Koreans to remain in such groups. The model of observational behaviour by Bikhchandani et al. (1998) shows that people learn from the behaviour of
12
others and therefore conform. Naylor (1989) uses a similar approach of individual behaviour of a social custom to explain the reason why workers strike. Hence, the education in Korea cannot be explained without the influence of Confucianism (culture) and conformity (society), which made Koreans place high value on education and respect the educated, considering adoption of a new technology as a part of education for new skills.
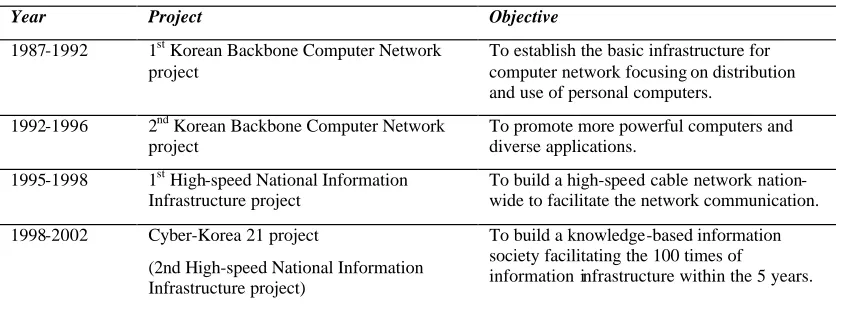
[image:10.595.80.501.367.522.2]As the nature of the social system determines the rate of adoption, the Korean government clearly signalled the network technology as the key for the future via various stages of government led technology projects (see Table 2)13. The pro-technology policy by the government certainly encouraged general public to adopt new technologies including internet. Not only the government strongly signalled, but also it took the initiative in adopting new technologies. For instance, most civil service documents have been distributed and communicated via internet since July 2000. Over two decades of the government technology projects definitely established a new social norm, computer and internet-literacy. It seems natural that Koreans worry that one can be left behind the information society and this forces them to adopt the new technology sooner than later.
Table 2. Technology Projects in Korea since 1987
Year Project Objective
1987-1992 1st Korean Backbone Computer Network
project
To establish the basic infrastructure for computer network focusing on distribution and use of personal computers.
1992-1996 2nd Korean Backbone Computer Network
project
To promote more powerful computers and diverse applications.
1995-1998 1st High-speed National Information
Infrastructure project
To build a high-speed cable network nation-wide to facilitate the network communication.
1998-2002 Cyber-Korea 21 project
(2nd High-speed National Information Infrastructure project)
To build a knowledge-based information society facilitating the 100 times of
information infrastructure within the 5 years.
4. Econometric Models
Both static and dynamic set-ups are used and compared to test the following propositions. For a point estimate of internet banking adoption probability, a logistic distribution is used and a duration model is used to detect the dynamics of IB adoption process14. The latter approach identifies the determinants of early adopters versus delayed adopters with the sequential information of adoption time.
Firm characteristics have been often used to determine firms’ technology adoption behaviour in the literature and equivalently individual characteristics would affect their behaviour of internet banking adoption. As internet banking requires a minimum level of proficiency in computer skills and internet communication, I expect males are more
13
The Ministry of Information and Communication has been in charge of these projects since 1987. 14
likely to adopt it given their tech-savvy characteristics as International Data Corporation report (IDC, 2002) suggested15. On the tech-savvy ground, younger generations would be more likely to adopt internet banking but on the banking familiarity ground, internet banking is more in need to older generations. Which of the two grounds has more explanatory power needs to be tested16. Having said that the proficiency in computer technology and network communications would have a positive impact on internet banking adoption, education (university or above) would enhance the proficiency in network technology and therefore would increase the probability of IB adoption17. Considering that stably married people are relatively conservative compared to those who choose alternative marital status, i.e. divorced, separated, co-habit, or single, married people would be less likely to adopt internet banking than singles or those with alternative marital status. I expect that banking intensity of high-income group would be higher than that of low-income group and hence expect the incentive of IB adoption is larger for high-income group. Outright owners of residential properties tend to be in less complex banking than those who are in key money or monthly rental schemes and therefore, would have less incentive to adopt internet banking.
Based on epidemic effects, residents in Seoul and Kyungki metropolitan area would be more likely to adopt internet banking than those who reside in regional provinces. I expect that the easier access to computers and internet facilities in the metropolitan area would provide better grounds for internet banking adoption. I also argue those who are exposed to the risk of internet banking via recommendation or frequent visits to bank websites are more likely to adopt than those who are not yet exposed to recommendation.
Those who are aware of interest rate information in the market, i.e. active information seekers would be more likely to adopt internet banking as their search for the best services and products become easier with internet banking. Assuming frequent visitors to bank branches (OTC) like human contacts, they would have less incentive to adopt internet banking. Moreover, the determinants of IB adoption timing (dynamic) would differ from those of IB adoption probability (static).
Since the technology of internet banking is not exclusive to the first mover, we are bound to see some spillovers within the industry and would not see significant impact on the first mover’s market position. Especially when consumers being cautious about their banking, the first mover (order effects) would not necessarily capture the typical early adopters. Instead, the largest bank would increase its market share via internet banking (rank effects) by capturing early adopters as consumers value a bank with more customers higher (network effects) and perceive large banks as better ones (reputation).
15
IDC has an extensive global network of consultancy on technology information and reports up-to-date facts in the industry. Their report (2002) about adoption of wireless communication confirmed that young (average 28 years old) male group are more likely to adopt earlier.
16
Rogers (1995)’ survey on diffusion publications shows that more than half of the publications find the age factor as not significant.
17
Internet banking adoption is expected to increase with time since customers are exposed to more IB adopters and with the increasing number of IB users they have more chance to imitate other users. In other words, the duration dependence is likely to be positive. As per those who have delayed their adoption of internet banking nearly 4 years, given that laggards and early adopters tend to have different individual characteristics, the factors affect laggards to adopt IB with delay would differ from those of majority adopters.
First, the fully non-parametric duration model is used to determine the shape of the survival function as well as the hazard function18. The Kaplan-Meier (1958)19 survival estimate indicates the IB adoption follows a S-shaped curve considering the data are right censored for non-IB users (see Figure 5). This agrees with the results from most technology diffusion literature20. On the other hand, the hazard function shows a non-monotonic increase in time, more precisely increasing with oscillation. In order to capture this increasing hazard over time, I chose a Weibull distribution (see Figure 6) for the underlying hazard function of duration analysis and compared three different specifications: 1/continuous time Weibull model (parametric), 2/discrete time proportional hazard (PH) model with Weibull baseline hazard (parametric) and 3/ discrete time proportional hazard (PH) model with flexible baseline hazard (semi-parametric with non-(semi-parametric baseline hazard).
Kaplan-Meier survival estimate
analysis time
0 20 40 60
0.00 0.25 0.50 0.75 1.00
Survival
Weibull regression
analysis time
1 48
.055579 1
Figure 5. Fully non-parametric estimate (Kaplan-Meier) Figure 6. Parametric estimate (Weibull distribution)
The Weibull distribution is one of the most widely used lifetime distribution. It is a versatile distribution that can take on the characteristics of other types of distributions, based on the value of the shape parameter p. The Weibull probability density function can be written with one to three parameters (e.g. scale parameter η, shape parameter p, location parameter γ ) and the density function can have a flexible form depending on
18
Kalbfleisch and Prentice (1980) suggest a non-parametric duration analysis has an advantage of not imposing any restriction on the underlying hazard but there are theoretic difficulties in interpreting non-parametric maximum likelihood estimate. Thus, alternative specifications were chosen for the analysis. 19
Despite the incompleteness of the data, Kaplan-Meier use the product-limit estimate to derive the proportion of events in the population whose lifetime would exceed t, without making any assumption about the form of the probability function.
20
these parameters21. The most commonly used density function for duration model takes the two parameter form with scale and shape parameters by setting γ= 0:
( )
p
p 1 t
p t
f t e
γ η
γ
η η
− − −
−
= ⋅
(1.1)
where most duration literature denotes the hazard rate λ
η
= 1. Therefore, the hazard function with Weibull distribution is
( )
( )
λ =λ λ p 1−
t p t (1.2)
and the survival function is
( )
= −( )λtpS t e (1.3)
The Weibull distribution is suitable for a model where hazard rate increases or decreases monotonically since it parameterises the exponential term with p-1 where p being greater than 1 can be used for increasing hazard rate whilst p being smaller than 1 can be used for decreasing hazard rate. The special case of p =1 converges to an exponential model in which the hazard rate is constant over time.
4.1. Duration Model Specification
For the length of time that elapses before customers adopt a new banking technology (internet banking), the duration to adoption of internet banking was defined as follows: I set the time origin at Jan. 1998 and thereafter, a monthly time scale was set in sequence. The monthly time scale is due to the nature of survey data. I define the event ending the duration as the first use of internet banking, i.e. IB adoption. Different individuals may have different time origins but my specification assumes everyone was already exposed to the news of IB introduction prior to the actual introduction of IB22.
4.1.1. Continuous Time Parametric Duration Model (Weibull)
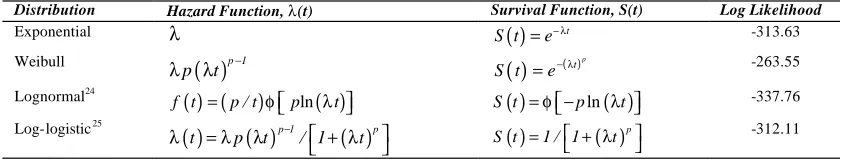
Parametric specification assigns a certain type of distribution on the hazard function, a Weibull distribution in this paper. It is relatively easy and straightforward to apply this specification but the choice of hazard function is extremely important. Various distributions including exponential, lognormal and log-logistics were tested and the Weibull distribution was chosen, as its log-likelihood is higher than those of other specifications (see Table 3).
21
For further details of t he probability distribution, see Kiefer (1988), and Greene (2000). 22
Table 3. Survival Distributions: log-likelihood23
Distribution Hazard Function, λ(t) Survival Function, S(t) Log Likelihood
Exponential λ ( )= −λt
S t e -313.63
Weibull λ λ( )p 1−
p t ( )= −( )λtp
S t e -263.55
Lognormal24
( ) (= )φ ln( )λ
f t p / t p t S t( )=φ−pln( )λt -337.76
Log-logistic25
( ) ( ) ( )
λ =λ λ p 1− + λ p
t p t / 1 t S t( )=1 / 1 +( )λt p -312.11
Although the survival function and hazard function seem to fit the non-parametric specification results best, assuming the time interval to be small enough to apply continuous time, the Weibull model is specified as follows26:
( )
( )
( )
( )
( )
Hazard function(Weibull):
∆ ∆
∆ ∆
λ
∆ ∆
λ λ
→ →
−
≤ ≤ + ≥ + −
= =
= =
0 0
p 1
Prob(t T t T t ) F(t ) F t
t lim lim
S t
f t
p( t ) S t
(2.1)
( )
( )
( )Probability density function:
p
t
p 1 p 1
f t =λ λp( t ) − ⋅S t =λ λp( t ) − ⋅e−λ (2.2)
( )
(
)
( )
( )Survivor function: S t =Pr T > = −t 1 F t =e−λt p
(2.3)
( )
(
)
( )
Failure function:F t =Pr T ≤ = −t 1 S t (2.4)
(
)
where λ ≡exp β' X
The hazard rate, λ(t) is the conditional probability of having a spell length exactly t, i.e. adopting IB in interval [t, t+∆t], conditional on survival up to time t (equation 2.1). But the hazard rate is not a probability in a pure sense since it can be greater than 1. The survival function (equation 2.3) is derived from the hazard function conditioning on survival up to time t-1 and the failure function takes the form, 1-S(t). The failure function at time t (equation 2.4) represents the technology diffusion over time when S-shaped curve is often discussed in the literature.
23
For further details of each distribution, see Kiefer (1988) and Greene (2000). 24
ln(t) is normally distributed with mean –ln(λ) and standard deviation 1/p. 25
ln(t) has a log-logistic distribution with mean –ln(λ) and variance p2/(3p2). 26
4.1.2. Discrete Time Proportional Hazard (PH) duration Model (with parametric baseline hazard)
A discrete time duration model is appropriate as my data set observations are made in discrete time, i.e. adoption in monthly intervals, although the intrinsic nature of the IB adoption is in continuous time. I chose a complementary log-logistic (cloglog) hazard function over a logistic one as the adoption process of internet banking is intrinsically continuous but only the observations are in discrete time. In principle this specification is an extended version of Cox proportional hazard model as illustrated in Kiefer (1988) for discrete data analysis27.
Hazard Function: λit =λ0
( )
t ⋅exp X '(
it β)
(3.1)(
it)
= −∫
tλ τ(
it)
τ={
− it β+( )
t }
0
S t;X exp ; X d exp exp X ' log H
(3.2)
( )
( )
where t= −
∫
tλ τ τ0 and λ0 is the baseline hazard at0
H d t t
The hazard function (equation 3.1) takes a proportional form assuming that for some unknown β and some nonnegative measurable function λ0(t), the baseline hazard at
time t. Subject to a complementary log-logistic transformation for the discrete time, the survival function can be written as equation (3.2).
With censoring ci =0 for those who are not yet adopters, the log-likelihood can be written as:
(
β δ)
{
(
) (
) (
)
(
)
}
=
=
∑
n i i− it − i it − − i i it i 1logL , c log S t 1; X S t ; X 1 c logS t ; X (4.1)
where δ =log( H ),
( )
( )
(
)
( )
λ − λ λ
= = =
= − + − −
∑
n∏
ti 1∏
tii it it s is i s is
i 1 s 1 s 1
logL c log X 1 X 1 c log 1 X (4.2)
( )
(
)
where the discrete time hazard is
λt Xit = −1 exp−exp X 'it β γ+ t (4.3)
( )
with γ λ τ τ
−
=
∫
t t 1a
t log a 0 d
27
The log likelihood function (equation 4.2) shows the weighted average form of maximum likelihood from both censored and uncensored groups. The first half of the equation represents the likelihood of an exit (i.e. IB adoption) at time t, thus a product of all the previous periods’ survival likelihood, whereas the second half of the equation illustrates the case of non-exit. The equation is simply weighted by ci and 1- ci for that matter: ci =0 for censored group and ci =1 for uncensored group. The hazard function with a complementary log-logistic transformation for the discrete time is shown in equation (4.3).
4.1.3. Discrete Time Proportional Hazard (PH) Duration Model (semi-parametric with flexible baseline hazard)
By adding duration dummy variables for each interval to the above specification, a semi-parametric estimation is also feasible. The advantage of using a semi -parametric specification is that we do not impose any assumption on the baseline hazard function and allow it to be fully flexible. In principle, this model calculates hazard rate for each interval under no restriction. Given the advantage of flexible baseline hazard function and the nature of my data being discrete in time, this model specification is preferred to others. However, I expect to see similar results from all three specifications despite the different underlying assumptions.
4.1.4. Unobserved heterogeneity in duration Model
The estimation in the presence of unobserved individual specific effects (i.e. heterogeneity) without control causes misleading inferences due to inconsistent parameter estimators (Lancaster, 1990). If there are other (unobserved) characteristics that influence the hazard function, such omitted heterogeneity generally leads to a downward biased estimate of duration dependence (Kiefer, 1988). The above duration models can be extended for this purpose by including a random error term along with the vector of individual characteristics X (i.e. use X′ +β v). A most commonly used correction model is based on the gamma distribution with mean 1 and variance θ. The gamma distribution and the inverse Gaussian distribution are often used for the heterogeneity distribution in parametric duration models since they give a closed form expression for the likelihood, avoiding numerical integration. However, other distributions could in principle be used (see Meyer, 1990). By incorporating heterogeneity into the distribution, I get the conditional survival function for the Weibull model specified as
( )
ν = ⋅ν ( )−λ pt
S t e (5.1)
Thus, the unconditional survival function is
( )= +
(
θ λ( )p)
−1 /θS t 1 t (5.2)
( )
( )
(
( )
)
θλ =λ λ p 1− ⋅
t p t S t (5.3)
where θ =0 corresponds to the model without unobserved heterogeneity and the further
θ deviates from zero, the greater is the effect of heterogeneity. For simplicity of the estimation, a normal distribution of heterogeneity for the complementary log-logistic model is used for the proportional hazard models. However, I fail to reject the null hypothesis of no heterogeneity for all three duration models. Therefore, the mixed models with unobservables converge to the models without unobservables. Only the results from models without unobservables are presented.
4.2. The Data
Yahoo Members’ Directory28 was used to collect email addresses of Korean residents with age 13 or above, applying a systematic and stratified sampling29. Following a pilot survey, 3200 online survey forms were sent out via email requests, of which 407 responded after two follow-ups30. In total, 393 replies were used in the analysis having discarded duplicates or incomplete replies.
A cross-sectional data set of 393 individuals was used in the static analysis of internet banking adoption and the data were expanded into panel data by assigning binary choice dummies for each monthly interval for the dynamic analysis (duration analysis). The last event was observed in the 48th month (December 2001) from the introduction of Internet Banking (IB) in January 1998. Thus, unbalanced data of 6407 observations were obtained, where 246 individuals responded as they had experienced internet banking while 147 identified themselves as non-users (right-censored).
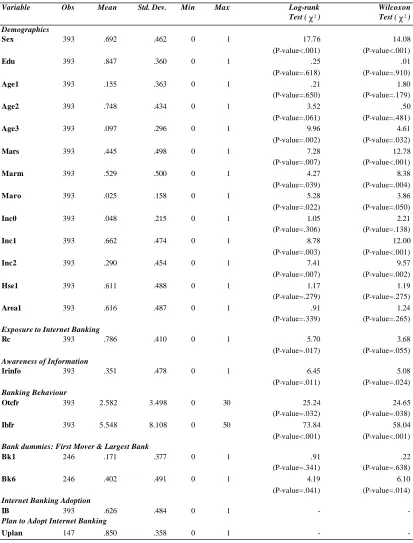
The non-parametric tests (e.g. the log-rank inequality test and the Wilcoxon test, see Table 4) were conducted on potential explanatory variables before applying to logit and duration models to see the parametric and semi -parametric results coincide. The Wilcoxon test divides the sample into subgroups and tests the null hypothesis of identical survival function across the subgroups, i.e.Si(t)= Sj(t). As the Wilcoxon test gives higher weights to earlier failure times, it is more likely to detect early differences in failure times. On the other hand, the log-rank test is based on scores assigned to the observations, which are functions of the logarithm of survival function. The test statistic is the sum of scores over all observations standardised by standard deviation in this case. The log-rank test gives equal weights to all failures and therefore is more powerful in detecting failures in proportional hazard models, which is the case of this paper. The explanatory variables included in the model contain: 1/ demographics, 2/exposure to
28
www.yahoo.co.kr is one of the largest digital media companies in Korea, which provides a variety of information through the internet. Yahoo also offers free email accounts for their members.
29
The 3200 email addresses were collected across 107 different cities throughout 11 provinces (see Table 7 for the details of stratified sampling). Every 3rd person from Yahoo Members’ Directory was selected in proportion to the population density data from the Korea National Statistical Office (systematic
sampling). The response rate was at 12.7%, which was below the expected rate of 20%. The expected rate of reply was initially drawn from interviews with local online survey companies in Korea (e.g.
www.koreanclick.com and www.internetmetrix.co.kr). The lower response rate seems to be due to the sensitivity of survey questions, e.g. personal banking.
30
internet banking, 3/awareness, 4/banking behaviour, 5/first mover and largest bank dummies (see Table 4).
Table 4. Descriptive Statistics of Data & Inequality Tests for Duration
Variable Obs Mean Std. Dev. Min Max Log-rank
Test (χ2)
Wilcoxon
Test (χ2)
Demographics
Sex 393 .692 .462 0 1 17.76 (P-value<.001)
14.08 (P-value<.001)
Edu 393 .847 .360 0 1 .25 (P-value=.618)
.01 (P-value=.910)
Age1 393 .155 .363 0 1 .21
(P-value=.650)
1.80 (P-value=.179)
Age2 393 .748 .434 0 1 3.52
(P-value=.061)
.50 (P-value=.481)
Age3 393 .097 .296 0 1 9.96
(P-value=.002)
4.61 (P-value=.032)
Mars 393 .445 .498 0 1 7.28
(P-value=.007)
12.78 (P-value<.001)
Marm 393 .529 .500 0 1 4.27
(P-value=.039)
8.38 (P-value=.004)
Maro 393 .025 .158 0 1 5.28
(P-value=.022)
3.86 (P-value=.050)
Inc0 393 .048 .215 0 1 1.05
(P-value=.306)
2.21 (P-value=.138)
Inc1 393 .662 .474 0 1 8.78
(P-value=.003)
12.00 (P-value<.001)
Inc2 393 .290 .454 0 1 7.41
(P-value=.007)
9.57 (P-value=.002)
Hse1 393 .611 .488 0 1 1.17
(P-value=.279)
1.19 (P-value=.275)
Area1 393 .616 .487 0 1 .91
(P-value=.339)
1.24 (P-value=.265)
Exposure to Internet Banking
Rc 393 .786 .410 0 1 5.70 (P-value=.017)
3.68 (P-value=.055)
Awareness of Information
Irinfo 393 .351 .478 0 1 6.45
(P-value=.011)
5.08 (P-value=.024)
Banking Behaviour
Otcfr 393 2.582 3.498 0 30 25.24 (P-value=.032)
24.65 (P-value=.038)
Ibfr 393 5.548 8.108 0 50 73.84
(P-value<.001)
58.04 (P-value<.001)
Bank dummies: First Mover & Largest Bank
Bk1 246 .171 .377 0 1 .91 (P-value=.341)
.22 (P-value=.638)
Bk6 246 .402 .491 0 1 4.19 (P-value=.041)
6.10 (P-value=.014)
Internet Banking Adoption
IB 393 .626 .484 0 1 - -
Plan to Adopt Internet Banking
5. Results
5.1. Descriptive Statistics of the Sample
Before presenting results from the probability and duration models of the adoption process, I examine some simple descriptive statistics. Table 4 reports means and standard deviations of the key variables used in the analysis. Considering the nature of technology involved with internet banking itself and the online survey, the high proportion of male group (i.e. 69.2% is Sex=1) replies seems to be right31.
The survey takes 7 different levels of final educational attainment. However, only a grouped dummy for higher education (Edu), i.e. university or above is used in the analysis in order to minimise the loss in degree of freedom by having too many insignificant variables suggested by the non-parametric tests (log-rank and Wilcoxon). A very high proportion (84.7%) indicated educational attainment of university or above with little variation. Given conditioning on internet access and the banking related questions would possibly explain the relatively high level of education. More importantly, Korea has traditionally favoured higher education in the belief tha t investment in human capital is the only way to rebuild the country from the aftermath of Korean war. Hence, university education in Korea has become more or less an essential certificate for employment.
Therefore, the education variable needs to be explained by the influence of Confucianism (culture) as well as conformity (society), which made Koreans place high value on education and respect the educated. Education is given a high priority by Koreans from all backgrounds and this has been a major driving force behind Korea’s economic development. For instance, the student population is about a quarter of the total population and the average length of schooling is now over 12 years, which means more than high school graduation. Seventy percent of the population between 18 and 21 are involved in some form of higher education with an ever-growing tendency32. This is also reflected in my sample data where we find a high proportion of university graduate or equivalent. Culturally driven efforts into education set higher education as a social norm in Korea.
The age variable was grouped into three, 1/ young (Age1=13-25), 2/ middle (Age2=25-45), and 3/ old (Age3=45 or above). The majority of people are categorised in 25-45 years old whereas 15.5% is in the young group and 9.7% is above 45 years old.
More than half of the respondents are married (Marm) whereas 44.5% are single (Mars) and only 2.5% are divorced or separated (Maro). Given the cultural background being conservative, it is not surprising to see no respondents in the co-habit category. On the other hand 2.5% of non-traditional marital status suggests the society is changing as well.
Regarding income levels (Inc0, Inc1 and Inc2), I set the middle range incomers (Inc1) around the average personal income of 3 million won per month suggested by the
31
International Data Corporation (IDC) report on Web users in Asia indicate 64% male. 32
census data (2001) of the Korea National Statistical Office (KNSO). A small proportion of 4.8% indicated the income category below 2 million won per month. The majority (66.2%) was in the category between 2 million – 4 million won per month while 29% indicated their income above 4 million won per month.
The housing type dummy (Hse1) shows 61.1 % of the respondents own their housing outright, which closely reflects the KNSO data (61.87%) as of 1999. The residential area dummy indicates (Area1) the 61.6% of the sample is drawn from the Seoul and Kyungki metropolitan area. This figure is higher than the KNSO data of 46.7% as of 2001 end based on the district registrar. This can only be explained by the metropolita n population’s more favourable attitude towards online surveys since the survey forms were sent out to each province in proportion.
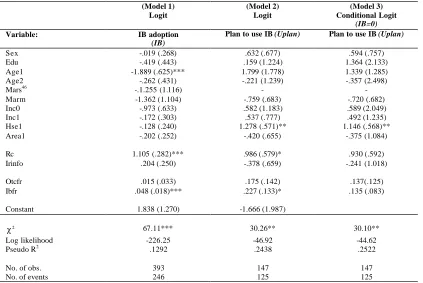
Most respondents had received recommendation (Rc) of internet banking (78.6%) and a high proportion (62.6%), responded as current internet banking users (IB)33. Almost half (47.6%) of non-users (NUs) consider security reasons (risk-aversion)34 as one of the main obstacles in using internet banking and the second common reason not to use internet banking was because they feel happy with the existing banking services (37.4%, inertia). Feeling safe with the old technology once again supports the idea of inertia. However, 85.0% of NUs replied that they would use internet banking in the future (Uplan) and consider the following criteria in order of priority: 1/ reputation of the bank, 2/ lower fees, and 3/user friendly web page.
In terms of banking behaviour, the over-the-counter tellers at bank branches (Otcfr) were visited 2.582 times per month on average whilst banks websites (Ibfr) are visited 5.548 times per month on average. This suggests any regular internet users would visit respective bank websites 1.3 times per week. On the other hand, 17.1% of the internet banking users are banking with the first mover bank (Bk1) while 40.2 of the users are banking with the largest bank (Bk6).
5.2. Adoption Estimation and Results
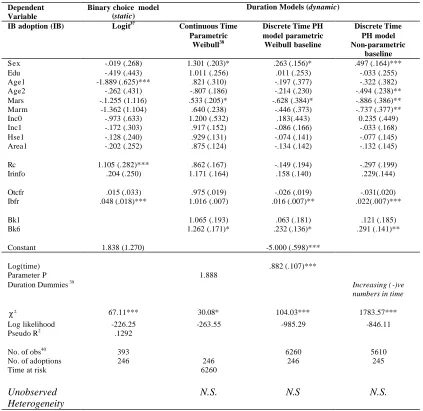
Table 5 provides a comparison of the logit and the duration model specifications, which confirm the significance of the joint hypothesis that all coefficients apart from a constant are equal to zero35. However, individual characteristics affect the IB adoption process differ in static and dynamic framework.
5.2.1. Adoption in the Static Model
Most demographic variables are insignificant while the age dummy for the young group (Age1), exposure to internet banking (Rc) and banking behaviour (Ibfr) are significant.
33
Pilot test showed most customers are internet banking with their current banks. This suggests that switching banks for better internet banking services rarely happens and consumer inertia exists 34
Appropriate regulation and technology can prevent IBUs from exposing themselves to risks. 35
The answer to why demographic variables do not appear as significant as expected, is that the Korean society has somewhat unique attitude towards new technology. I should probably borrow the imitation concept from sociology for the insignificant results. It draws attention to the importance of social structural characteristics, which might influence the amount and/or rate of adoption as well as any potential advantage for some segments of the social system in adopting the innovation. I believe this is an important aspect to investigate further, not only for diffusion among consumers but also among firms as the social structure can determine level of welfare increase with the innovation.
For age variables, it strongly indicates the reference group (45 years old or more) is more likely to be IB adopters than younger generations between ages 13-25. The middle age group (age 25-45) also indicates less likely to adopt IB than those above 45 years old, although it is not significant. This suggests that the age effect on internet banking adoption cannot be assessed solely on tech-savvy grounds but also on age groups of active banking.
I find evidence that those who have received recommendation of internet banking and make frequent visits to banks’ websites are more likely to adopt internet banking. These results are related to the epidemic theory of diffusion. More exposure to risk of adoption, i.e. information and advertisement on internet banking, creates higher probability of diffusion.
Most demographic variables are insignificant with the exception of young age group dummy (Age1) but given the joint significance test, the signs of the coefficients are noteworthy: Females are marginally more likely to adopt internet banking than males, which contradicts the initial proposition. However, given the insignificance, it is not right to draw any firm inference. Older generations are more likely to adopt internet banking unlike the expectation. The age effect should be seen in the industry specific context since younger generations’ banking activity is relatively lower than older ones despite their tech-savvy behaviour and willingness to adopt new technologies.
People with higher education (Edu) are less likely to adopt internet banking than those with less education, which indicates the cautious behaviour toward internet banking. Those with alternative marital status rather than single or married are more likely to adopt the internet banking and the high income group is more likely to adopt internet banking than the low income group. I can suggest that banking activity tends to increase with income level and thus it creates more incentive to adopt internet banking.
Regarding housing type dummy, the result shows that outright house owners are less likely to adopt internet banking. This might be explained by the fact that outright ownership would actually reduce the complexity of banking. Those who lease the property tend to have more complex financial management in order to arrange loans tied in the key money scheme36.
36
Table 5. Adoption Probability Estimates, Internet Banking
Dependent Variable
Binary choice model
(static)
Duration Models (dynamic)
IB adoption (IB) Logit37
Continuous Time Parametric
Weibull38
Discrete Time PH model parametric Weibull baseline
Discrete Time PH model Non-parametric
baseline
Sex -.019 (.268) 1.301 (.203)* .263 (.156)* .497 (.164)*** Edu -.419 (.443) 1.011 (.256) .011 (.253) -.033 (.255) Age1 -1.889 (.625)*** .821 (.310) -.197 (.377) -.322 (.382) Age2 -.262 (.431) -.807 (.186) -.214 (.230) -.494 (.238)** Mars -.1.255 (1.116) .533 (.205)* -.628 (.384)* -.886 (.386)** Marm -1.362 (1.104) .640 (.238) -.446 (.373) -.737 (.377)** Inc0 -.973 (.633) 1.200 (.532) .183(.443) 0.235 (.449) Inc1 -.172 (.303) .917 (.152) -.086 (.166) -.033 (.168) Hse1 -.128 (.240) .929 (.131) -.074 (.141) -.077 (.145) Area1 -.202 (.252) .875 (.124) -.134 (.142) -.132 (.145)
Rc 1.105 (.282)*** .862 (.167) -.149 (.194) -.297 (.199) Irinfo .204 (.250) 1.171 (.164) .158 (.140) .229(.144)
Otcfr .015 (.033) .975 (.019) -.026 (.019) -.031(.020) Ibfr .048 (.018)*** 1.016 (.007) .016 (.007)** .022(.007)***
Bk1 1.065 (.193) .063 (.181) .121 (.185) Bk6 1.262 (.171)* .232 (.136)* .291 (.141)**
Constant 1.838 (1.270) -5.000 (.598)***
Log(time) .882 (.107)***
Parameter P 1.888
Duration Dummies39
Increasing ( -)ve numbers in time
2
χ 67.11*** 30.08* 104.03*** 1783.57*** Log likelihood -226.25 -263.55 -985.29 -846.11 Pseudo R2
.1292
No. of obs40
393 6260 5610
No. of adoptions 246 246 246 245
Time at risk 6260
Unobserved Heterogeneity
N.S. N.S N.S.
*,**,*** Z-values significant at the 5%, 2.5%, and 1% levels respectively *,**,*** χ2 -values significant at the 5%, 1%, and 0.1% levels respectively
The result on the area dummy is insignificant whilst information seeking behaviour (Irinfo) is supported by the results. The number of visits to OTC (Otcfr) affects the likelihood of IB adoption positively although it is marginal.
37
The logit specification is a point estimate at the time of survey. Thus, the timing of internet banking adoption is not considered here.
38
The Parametric Weibull estimation shows hazard ratios i.e. if >1, it indicates a positive effect on adoption and vice versa.
39
The coefficients of the duration dummy variables, d1 to d48 are non-monotonically increasing from a larger negative number to a smaller negative number, which confirms the baseline hazard of internet banking adoption is increasing over time.
40
The Weibull baseline hazard model uses 6260 observations of the expanded panel for 48 monthly intervals, whereas the fully non-parametric baseline hazard model excludes the intervals with no event of adoption as well as the last duration interval which has only one adoption event, thus only 5610
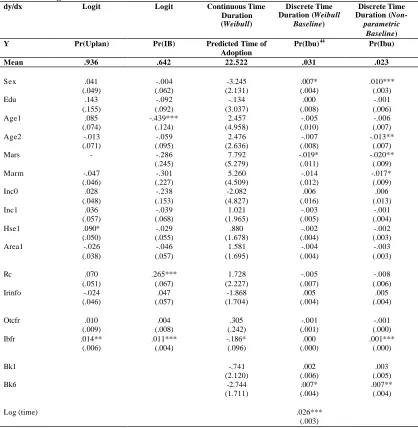
In summarising the results from the binary static model, traditional demographic variables; sex, education, marital status, personal income level, housing type and residential area are not significant for the likelihood of IB adoption with the exception of the age dummy variable. By contrast, the exposure to the new technology (Rc) and banking behaviour (Ibfr) play an important role in IB adoption decision. The marginal effects of the three significant variables at mean can be interpreted as (see Table 6): 1/ those who belong to the age group of 13-25 would have the probability of IB adoption lowered by .439 compared to the reference group, 2/ those who received IB recommendation would have the probability of IB adoption increased by 0.265 compared to the non-recommended group, and 3/ each additional visit to banks’ websites per month would increase the probability of IB adoption by 0.011.
5.2.2. The Static vs. the Dynamic Adoption Models
Before comparing the results of static and dynamic specifications, it is worth pointing out the results look similar to one another between three dynamic specifications. The parametric Weibull model and proportional hazard model with Weibull baseline look extremely similar. The non-parametric baseline model seems to detect more significance than other models as expected due to the non-parametric approach. Since the discrete-time PH model with non-parametric baseline (i.e. semi -parametric) is more appropriate for my data, not to mention the advantage of little restriction, I choose this specification to compare with the logit specification.
First, the demographic variables tend to be more significant in the duration model (dynamic) than in the binary choice model of logit (static). The timing of IB adoption by male is significantly different from that by female, whereby males are more likely to be early adopters. The age dummy for the group between 25-45 is also significant in decreasing the likelihood of early adoption compared to the reference group of those above 45. This coincides with Rogers (1995) core group claim. Those who are 45 or above is more likely to be early adopters as opposed to other age groups and also the male group is more likely to be early adopters than the female group. The core of banking network in Korea tends to be middle aged or above male since they are the ones who make key financial decisions for the household.
Second, recommendation of IB affects the likelihood of early adoption negatively. Perhaps early adopters are opinion leaders who act on their own initiatives rather than being persuaded by bank’s recommendation. However, information-seeking behaviour remains as a positive impact on the likelihood of early adoption.
Finally, the results on general banking behaviour are substantially different than those from the logit specification. It is strongly suggested that those with less frequent visits to banks’ branches and frequent visits to banks’ websites are more likely to be early adopters. The Weibull model shows that each additional visit to banks’ website per month makes the IB adoption earlier by 0.186 month or 5.58 days while the non-parametric baseline model indicates 0.001 increase in probability for a discrete time interval, i.e. a month. The latter marginal effect might appear to be very small but it is equivalent to 2.16% increase in probability of adoption at the mean probability, which is 0.023.
All in all, I can conclude that the results clearly indicate that the determinants of IB adoption timing (dynamic) differ from those of IB adoption probability (static).
Dummy variables of the first mover, Chohung Bank (Bk1) and the largest bank in commercial banking, Kookmin Bank (Bk6) were used for order effects and rank effects respectively 41. All three duration models show more or less similar results on these dummies42. The coefficient of order effect dummy is negligible and not significant whilst that of the rank effect dummy is not only large but also significant. In other words, customers of the largest bank tend to adopt earlier than those of smaller banks while customers of the first mover bank are not particularly early adopters.
The discrete duration models suggest that those who are banking with the largest bank (Bk6) increase their probability of IB adoption by 0.007 compared others at mean for the discrete interval (see Table 6). Hence, consumers seem to value the size of bank’s asset size, i.e. banks’ network size measured in market share more than the first mover advantage in the timing of adoption decision.
Having said that early adopters are opinion leaders, the largest bank’s market share is expected to rise with internet banking due to the network. Figure 1 supports the result, as the market share of the largest bank (Bk6) in internet banking is more dominant than in commercial banking while that of the first mover (Bk1) remains constant. Although I fail to show order effect, significant rank effects provide grounds for banks to take preemptive actions since banks can reinforce their market dominance via internet banking.
41
Kookmin bank (Bk6) has been the largest bank in terms of deposit size since 1995, thus the largest bank over the period of analysis.
42
Table 6. Marginal Effects at Mean43
dy/dx Logit Logit Continuous Time Duration
(Weibull)
Discrete Time Duration (Weibull
Baseline)
Discrete Time Duration ( Non-parametric
Baseline)
Y Pr(Uplan) Pr(IB) Predicted Time of Adoption
Pr(Ibu)44 Pr(Ibu)
Mean .936 .642 22.522 .031 .023
Sex .041 (.049) -.004 (.062) -3.245 (2.131) .007* (.004) .010*** (.003) Edu .143
(.155) -.092 (.092) -.134 (3.037) .000 (.008) -.001 (.006) Age1 .085
(.074) -.439*** (.124) 2.457 (4.958) -.005 (.010) -.006 (.007) Age2 -.013
(.071) -.059 (.095) 2.476 (2.636) -.007 (.008) -.013** (.007)
Mars - -.286
(.245) 7.792 (5.279) -.019* (.011) -.020** (.009) Marm -.047
(.046) -.301 (.227) 5.260 (4.509) -.014 (.012) -.017* (.009) Inc0 .028
(.048) -.238 (.153) -2.082 (4.827) .006 (.016) .006 (.013) Inc1 .036
(.057) -.039 (.068) 1.021 (1.965) -.003 (.005) -.001 (.004) Hse1 .090*
(.050) -.029 (.055) .880 (1.678) -.002 (.004) -.002 (.003) Area1 -.026
(.038) -.046 (.057) 1.581 (1.695) -.004 (.004) -.003 (.003)
Rc .070
(.051) .265*** (.067) 1.728 (2.227) -.005 (.007) -.008 (.006) Irinfo -.024
(.046) .047 (.057) -1.868 (1.704) .005 (.004) .005 (.004)
Otcfr .010 (.009) .004 (.008) .305 (.242) -.001 (.001) -.001 (.000) Ibfr .014**
(.006) .011*** (.004) -.186* (.096) .000 (.000) .001*** (.000)
Bk1 -.741
(2.120)
.002 (.006)
.003 (.005)
Bk6 -2.744
(1.711)
.007* (.004)
.007** (.004)
Log (time) .026***
(.003)
*,**,*** Z-values significant at the 5%, 2.5%, and 1% levels respectively
Despite the different duration model specifications, the result on duration dependence is identical and confirms the positive duration dependence as expected. The positive parameter estimate of p in the parametric Weibull model suggests a positive duration dependence as p is greater than 1 (p=1.888). This can be easily detected in the proportional hazard model with parametric Weibull baseline, as the coefficient of log(time) is positive and significant. The non-parametric baseline model also suggests the same positive duration dependence as the coefficients of time duration dummies are increasing from more negative numbers to less negative numbers.
43
Standard errors are reported in the parentheses underneath the marginal effects. 44