http://wrap.warwick.ac.uk/
Original citation:
Masood, K. and Rajpoot, Nasir M. (Nasir Mahmood) (2007) Classification of colon
biopsy samples by spatial analysis of a single spectral band from its hyperspectral cube.
In: 11th Medical Image Understanding and Analysis (MIUA 2007), Aberystwyth, Wales,
17-18 Jul 2007
Permanent WRAP url:
http://wrap.warwick.ac.uk/61638
Copyright and reuse:
The Warwick Research Archive Portal (WRAP) makes this work by researchers of the
University of Warwick available open access under the following conditions. Copyright ©
and all moral rights to the version of the paper presented here belong to the individual
author(s) and/or other copyright owners. To the extent reasonable and practicable the
material made available in WRAP has been checked for eligibility before being made
available.
Copies of full items can be used for personal research or study, educational, or
not-for-profit purposes without prior permission or charge. Provided that the authors, title and
full bibliographic details are credited, a hyperlink and/or URL is given for the original
metadata page and the content is not changed in any way.
A note on versions:
The version presented in WRAP is the published version or, version of record, and may
be cited as it appears here.For more information, please contact the WRAP Team at:
Classification of Colon Biopsy Samples by Spatial Analysis of a
Single Spectral Band from its Hyperspectral Cube
Khalid Masood and Nasir Rajpoot
Department of Computer Science, University of Warwick, Coventry, CV4 7AL, UK email:{khalid, nasir}@dcs.warwick.ac.uk
Abstract.
The histopathological analysis of colon biopsy samples is a very important part of screening for colorectal cancer. There is, however, significant inter-observer and even intra-observer variability in the results of such analysis due to its very subjective nature. Therefore, quantitative methods are required for the analysis of histopathological images to aid the histopatholgists in their diagnosis. In this paper, we exploit the shape and structure of the gland nuclei cells for the classification of colon biopsy samples using two-dimensional principal component analysis (2DPCA) and Support Vector Machine (SVM). We conclude that the use of textural features extracted from non-overlapping blocks of the histopathological images results in a non-linear decision boundary which can be efficiently exploited using a SVM with appropriate choice of parameters for its Gaussian kernel. The SVM classifier outperforms all the remaining methods by a clear margin.
1
Introduction
Colon cancer is one of the leading forms of cancer and second most fatal, after the lung cancer, in England and Wales [1]. The disease can be treated very effectively if detected in its early stages. Routine screening (ie, colonoscopy in this case) can save lives by nipping the problem in the bud. However, the screening process relies heavily on the accuracy of the judgement made by histopathologists analysing the biopsy samples taken from suspected polyps. Unfortunately, the histopathological analysis is very subjective in nature and is marred by both intra- and inter-observer variability, potentially leading to different treatment regimes. The purpose of this study in the grand scheme of things is to increase the reliability of the screening process by introducing objectivity to the screening process.
Several researchers have looked at the problem of classification of biopsy slides. However, due to the limited space here, it is not possible to give a comprehensive literature review. In [2], classification of tumors is done using expression levels of gene patterns in the tissue samples. In [3], it is proposed that metrics based on the responses of receptive field operators modelling the orientation selectivity of the neurons found in the early visual pathway are capable of discriminating between images of normal, dysplastic (transitional) and cancerous samples. A related computational model of light interaction with colon tissue and classification using the tissue reflectance spectra is analyzed in [4].
In this paper, we address two important questions: First, does the spatial analysis of a single spectral band (as opposed to the spatial-spectral analysis of the corresponding hyperspectral image cube) suffice for efficient classification of biopsy sample? An obvious advantage of using spatial analysis on a single band is its reduced computational and storage complexity. Spectral analysis has been used in [5] and our goal is to determine whether the spatial analysis can achieve similar or even better classification performance. The second question addressed in this paper is: How effective are the features extracted using linear subspace projection of raw image blocks as compared to textural features from the same blocks?
Our approach is based on the idea that development of colon cancer alters the macroarchitecture of the tissue glands. The cancerous stimuli cause cells to adapt by altering their pattern of growth. This phenomena results in the increase in the size of existing nuclei and also considerable increase in their number. The nice tubular structure for a normal tissue changes to deformed structure for malignant tumors. The malignant tumor shows considerable variation in nuclei size and shape. The following sections present materials and methods used in our experimentation, followed by quantitative results and their discussion. The paper ends with some concluding remarks and future directions.
2
Materials and Methods
Patches (64x64)
Textural Features
Covariance Matrix
LDA Training Selection SVM Model SVM
LDA
ParametersModel
..
Benign
Malignant Biopsy M
Biopsy 1
Biopsy 2
Nearest Neighbour
Classifier Patches (64x64) Projection Coordinates
Projection Vectors and Coordinates
PCA/2DPCA Selection
Benign
Malignant Textural Features SVM
Classifier
Biopsy M+1
Patches (64x64) Biopsy
M+1
2
3
Training
11
3
Testing
Testing
[image:3.612.75.521.66.355.2]2 or Figure 1. Block Diagram
visible light source and a CCD camera. In our case, however, the imaging setup (same as that used in [5]) consisted of a Nikon Biophot microscope and a unique tuned light source based on a digital mirror device (DMD). The DMD based light source is capable of transmitting any combination of light frequencies. Hyperspectral image cubes of the biopsy sample at a magnification of 400X are captured at128different wavelengths, with narrow bandwidths, in the range of 400–800nm. In this way, each image cube consists of128spectral bands (spectral resolution) while the spatial resolution of each spectral band is448×691. The image cubes are spatially cropped to obtain spectral bands with a spatial resolution of 448×640, in order to facilitate our local spatial analysis which operates by analysing64×64
blocks of a single hand-picked spectral band for each cube. After experimentation with number of bands, observing the effect of a particular band on the classification performance, we found that a number of spectral bands in the middle part of the visible light spectrum for most datasets seemed to contain sufficient textural information for biopsy classification purposes. We picked one of the middle bands, the75th band, for all our experiments reported in this paper.
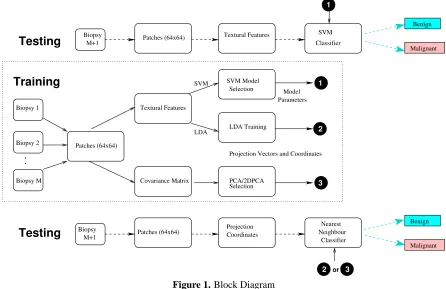
A unified block diagram of the methods investigated is shown in Figure 1. As depicted in the Figure, there are two types of classification paradigms employed for comparison purposes: first type using raw image blocks and subspace projection methods (classical principal components analysis, PCA, and two-dimensional PCA), and the second type using textural features for the image blocks and utilising LDA or SVMs. The methodology is described in more detail in the following sections.
2.1
Classification using Raw Image Patches
In order to address the second question in Section 1, we investigate whether features obtained by maximising the overall scatter of the raw image blocks contain sufficient information for discrimination purposes. Such features can be obtained by the classical linear subspace projection (or dimensionality reduction) method of PCA. We also investigate the use of two-dimensional PCA (2DPCA) [6] for feature extraction from raw image blocks. First, we give a brief description of the two methods.
2.1.1 Subspace Projection of Raw Patches with PCA
The subspace projection methods operate by projecting a givenn×nimage block, or patch,Pi(i= 1,2, . . . , M),where
matrixC(1)obtained from all theM training image blocks as follows,
C(1)= 1
M M
X
i=1
(vi−¯v)(vi−v¯)T
wherevidenotes the patchPirearranged into a one-dimensional (1D) vector (normally, in a row-by-row fashion) and
¯
v denotes the average of all such vectors for the training patches. The above equation results in a potentially large covariance matrixC(1)having dimensionsn2×n2, although the so-called transpose trick can be used to reduce its
dimensions toM ×M, nevertheless requiring extra computations for calculating the projection coordinates.
2.1.2 Two-dimensional Principal Component Analysis (2DPCA)
2DPCA is a new linear subspace projection method particularly developed for image classification. It was recently shown to be successful for face recognition [6]. The basic idea behind 2DPCA is that the covariance matrix is computed using the training images without requiring to first convert them to 1D vectors. This is done as follows,
C(2) = 1
M M
X
i=1
(Pi−P¯)T(Pi−P¯)
As a result of the above computation, the covariance matrixC(2) is of the sizen×n, which could be much smaller than its conventional counterpartC(1). Furthermore, the linear subspace projection using 2DPCA is a more accurate reflection of the spatial relationship between image pixels in all the training samples as it maximises the overall scatter of all the training images. Just as matrices for training images are used for computation ofC(2), the computaion of
projection coordinates forPiis also done by projecting the corresponding matrix onto the firstdeigenvectors ofC(2)
as follows,
aik=PiX
(2)
k
whereXk(2)is then×1-dimensional eigenvector ofC(2) corresponding to itskth largest eigenvalueλ
k. One
funda-mental difference between 2DPCA and conventional PCA is that the projection coordinates (or the 2DPCA feature matrix) forPiin case of 2DPCA can be represented in the form of an×dmatrixAigiven by
Ai= [ai1, ai2, . . . , aid]
as opposed to ad-dimensional feature vector in case of the classical PCA obtained by projectingvi ontoX
(1)
k , for k= 1,2, . . . , d. The classification of a test sample is done by computing the sum of Euclidean distances between the columns of feature matrices of the test image and those stored in the database for training samples. A nearest neighbour classifier can be used to assign label to the test sample.
2.2
Classification using Textural Features
Although 2DPCA has been shown to be more efficient than classical PCA for image classification, it has some draw-backs too, such as the large dimensionality of the features (ie, the feature matrices) and the high computational com-plexity of classification of a test sample due to potentially large number of distance calculations. Therefore, we also investigate the effectiveness of local textural features for biopsy classification using a single spectral band.
Grey level co-occurrence matrix features are calculated for every patch Pi of the image corresponding to a single
spectral band of the given hyperspectral cube for a biopsy sample. A co-occurrence matrix is computed using second order joint conditional probability density functionf(i, j|d, θ)by counting all pairs of pixels separated by distances
in directionθand having grey leveliandj. By using two distance values and four values ofθ(0, 45, 90, 135 degrees), we can compute a relatively small feature vector, which we used with a classical linear discriminant analysis (LDA) classifier and also appropriately tuned SVMs.
2.2.1 Linear Discriminat Analysis (LDA)
(a)Benign B1 (b)Benign B2 (c)Benign B3 (d)Benign B4 (e)Benign B5
(f)Malignant M1 (g)Malignant M2 (h)Malignant M3 (i)Malignant M4 (j)Malignant M5
Figure 2. Images of Colon Biopsy Samples
2.2.2 Support Vector Machine (SVM)
SVMs utilise a nonlinear mapping from the input feature space to an implicit high-dimensional feature space, where the nonlinear boundary between patterns in the input space is linearized [8]. The SVM kernel function allows one to avoid the explicit evaluation of mapping by using the so-called kernel trick. The choice of kernel depends on the data and its clustering. Gaussian kernel is defined below
K(xi, xj) =e−γ(xi−xj) 2
+C,
wherexi andxj denote feature vectors corresponding to two patchesPi andPj, is used in most cases because of
its widely reported superior classification performance, also in this context [9]. In the above equation,Cis a constant which normally does not significantly affect the classifier’s performance, whereas the choice ofγ(width of the Gaussian basis function) can have a significant influence on the performance. A variety of selection methods have been used including grid search and Newton’s bisection methods [9]. Once a kernel is tuned properly, classification of test data can be performed effectively.
3
Results and Discussion
We conducted experiments with ten biopsy samples using a leave-one-out (LOO) testing strategy. As shown in Figure 2, five of these were benign and the remaining five malignant. The 75th spectral band of the hyperspectral image cubes for these biopsies was each divided into non-overlapping blocks of64×64. For spectral band selection, we perform several experiments on different bands using SVM and found that middle bands have more textural information than initial and final bands, whereas the 75th band gives highest classification accuracy. In a 10-fold cross-validation setting, each time the training set consisted of patches from nine images, while the remaining tenth image was used for testing. The PCA and 2DPCA classifiers used 60 and 40 projection coordinates, respectively. For textural features, two values ofs(namely, 1 and 2) and four values ofθas mentioned above are used and three features (namely, energy, variance and homogeneity) are used, yielding a 24-dimensional feature vector for each of the biopsies. LDA further used only 20 projection vectors for computing the linearly discriminating feature vectors. The Gaussian kernel for the SVM was tuned with a bisection search. A summary of block-wise classification accuracy results are shown in Table 1.
Non-Overlapping Blocks Classification Accuracy (%)
Biopsy No. Raw data Textural data
PCA 2DPCA LDA SVM(65) SVM(70) SVM(75) SVM(80)
B1 68.57 85.71 80.00 77.14 95.71 95.71 95.71
B2 55.71 65.71 68.57 61.43 81.43 88.57 84.29
B3 50.00 64.29 78.14 48.57 64.29 91.43 78.57
B4 58.57 70.00 64.29 54.29 51.43 84.29 75.71
B5 48.57 51.43 54.21 30.00 30.00 82.86 41.43
M1 82.86 70.00 78.14 98.57 98.57 98.57 98.57
M2 72.86 74.29 81.43 94.29 81.43 94.29 84.29
M3 65.71 68.57 72.86 94.29 97.14 92.86 94.29
M4 72.86 74.29 75.71 84.29 84.29 85.71 80.00
M5 70.00 75.71 92.86 98.57 92.86 97.14 92.86
[image:6.612.85.518.281.457.2]Average 64.57 70.00 74.63 74.14 77.72 91.14 82.57
Table 1. SVM (with different Bands) and PCA, 2DPCA, LDA (Band 75) Results
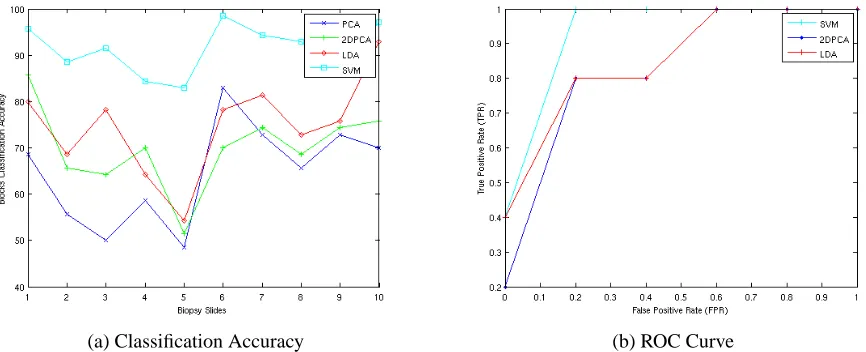
(a) Classification Accuracy (b) ROC Curve
Figure 3. Performance Curves for 75th Spectral Band
4
Conclusions and Future Work
Our experimental results demonstrate that by taking only single band from a hyperspectral data cube, it is possible to perform a reasonable classification for histopathological analysis of colon biopsy samples. An appropriately tuned SVM coupled with textural features yields the best performance as compared to other subspace projection methods with and without textural features. This is because SVM introduces a nonlinear mapping where the decision boundary is linearized and hence separation is performed much more efficiently. The segmentation of glands and the measurement of features related to glandular shapes will be subjects of our future study.
References
1. N. S. Office. “Cancer statistics and registrations for england and wales.” HMSO 1999.
2. T. Furey, N. Cristianini & N. D. et al. “Support vector machine classification and validation of cancer tissue samples using microarray expression data.” Bioinformatics 2000.
3. A. Todman, R. Naguib & M. Bennen. “Visual characteristics of colon images.” IEEE CCECE 2001.
4. D. Rowe, E. Claridge & T. Ismail. “Analysis of multispectral images of the colon to reveal histological changes characteristic of cancer.” MIUA 2006.
5. G. Davis, M. Maggioni & R. C. et al. “Spectral/spatial analysis of colon carcinoma.” Journal of Modern Pathology 2003. 6. J. Yang, D. Zhang & A. Frangi. “Two-dimensional pca: A new approach to appearance-based face representation and
recogni-tion.” IEEE transactions on PAMI 2004.
7. K. Fukunaga. “Introduction to statistical pattern recognition.” Academic Press 1990. 8. V.Vapnik. “The nature of statistical learning theory.” Springer-Verlag, New York 1995.