F
INALP
ROJECTT
HESISDeveloping a Tool for Learning Concept Maps
Author:
M.C.VAN DENENK [s1004654]
Supervisors: dr. A.H. Gijlers [email protected] dr. L. Bollen [email protected]
Developing a Tool for Learning Concept Maps
Contents
Abstract 5
I Introduction 6
Project Description 7
The need for meaningful memorisation . . . 7
Concept mapping . . . 8
Flashcard system . . . 9
Comparison of the two tools . . . 10
Flashmap system . . . 10
Evaluation . . . 11
Cognitive theories 13 Types of learning . . . 13
Storage and retrieval . . . 13
Cognitive effects with regard to encoding practices . . . 14
Cognitive effects with regard to retrieval practices . . . 15
II Design Report 18 Analyses 20 Analysis of the learning context . . . 20
Analysis of the learner . . . 21
Analysis of the learning task . . . 22
Design frameworks 25 Supplantive or generative . . . 25
Concept map construction design features . . . 26
Flashcard learning design features . . . 26
The ARCS model . . . 29
Software design and development 33 Page elements . . . 33
Learning process . . . 34
Other views . . . 40
Developing a Tool for Learning Concept Maps
III Research 46
Methods 47
Research design . . . 47
Respondents . . . 47
Instrumentation . . . 48
Procedure . . . 50
Analysis . . . 51
Results 55 Participant descriptions . . . 55
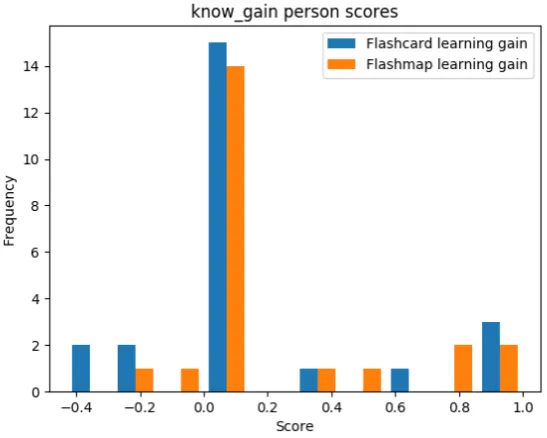
Learning gain . . . 56
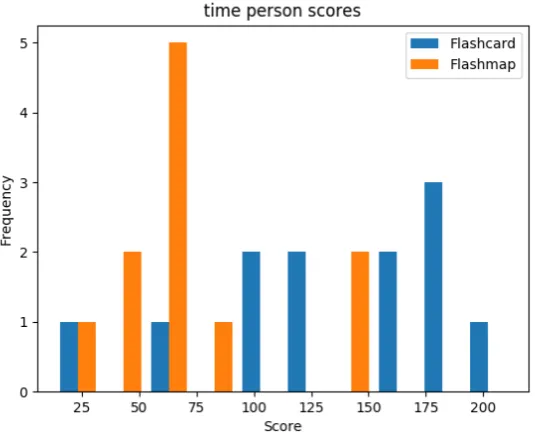
System use . . . 59
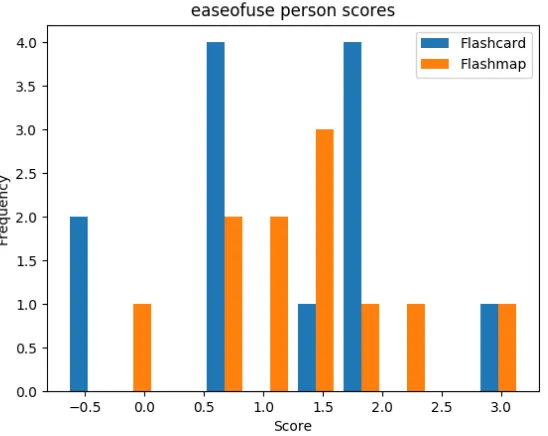
User perceptions about the software . . . 63
Discussion 67 Conclusions . . . 67
Limitations . . . 68
Future work . . . 68
IV Backmatter 69 References 70 Appendices 74 Test literature history 16th and 17th century 75 Flashmap server Documentation 79 Source files of the client 102 index.html . . . 102
style.css . . . 102
client.js . . . 104
Informed consent form 114 Letter . . . 114
Informatie over het onderzoek . . . 115
Toestemmingsverklaring . . . 117
Instruments used within the experiment 118 Rubric for the test questions . . . 118
Translated questions from the Technology Acceptance Model . . . 125
Participation statistics 127 Descriptives . . . 127
Comparisons among conditions . . . 127
Descriptive statistics 130 Gender . . . 130
Comparisons of ages among conditions . . . 132
Developing a Tool for Learning Concept Maps
Descriptives of the knowledge questions . . . 133
Comparisons of the knowledge questions . . . 138
Descriptives of the comprehension questions . . . 139
Comparisons of the comprehension questions . . . 141
Instance statistics 148 Descriptives on the number of reviewed instances . . . 148
Comparisons of reviewed instances . . . 148
Descriptives of the number of responses . . . 149
Comparisons of the number of responses . . . 149
Descriptives of the exponents of instances . . . 151
Comparisons of the exponents . . . 151
Descriptives of percentage of responses marked as correct . . . 153
Comparisons of the percentage of responses marked as correct . . . 153
Descriptives of the amount of time spent on the application . . . 155
Comparisons of the amount of time spent on the application . . . 155
Questionnaire statistics 158 Descriptives of Perceived Usefulness questions . . . 158
Comparisons of the Perceived Usefulness questions . . . 158
Descriptives of Perceived Ease of Use questions . . . 160
Developing a Tool for Learning Concept Maps
Abstract
Part I
Introduction Developing a Tool for Learning Concept Maps
Project Description
The need for meaningful memorisation
Over the centuries, knowledge has been fundamental to any learning process. Socrates already stated that knowledge is the only true virtue, and the tragedian Aeschylus regarded memory as the mother of all knowledge. Not only was knowledge regarded as important by ancient thinkers, but it still is by modern scholars on education. The taxonomy of learning by Bloom, Engelhart, Furst, Hill, and Krathwohl (1956), a revision of the taxonomy by Krathwohl (2002), and the three stages of skill acquisition by J. Anderson (1982), propose that all learning should start with memorising factual knowledge. Furthermore, von Glaserfield (2001), one of the main founders for critical constructivism, expresses a need for training students so that they permanently possess facts and are able to repeat them flawlessly whenever they are needed, while also understanding what is placed into their memory. Ericsson and Kintsch (1995) adds to this by stating that in order to perform complex tasks, people must maintain access to large amounts of information, and that solely encoding knowledge is not sufficient. Despite all of this, Karpicke (2012) argues that “[r]etrieval processes, the processes involved in using available cues to actively reconstruct knowledge, have received less attention” (p. 158), whereas basic research on learning and memory has emphasised that retrieval must be considered in any analysis of learning.
Traditionally, when students have to gain complex and meaningful knowledge — for example knowledge about a historical event or a chapter in a psychology textbook —, they are asked to read the relevant chapter from a provided textbook. However, Mayer (2008) states that many students have difficulty gaining knowledge in this manner. He breaks reading for comprehension down into four separate skills, which are integrating, organising, elaborating, and monitoring. Integrating refers to relating a text to one’s prior knowledge, and evidence exists that rich background knowledge leads to better inferences about the text and thereby to better comprehension. This need also has been stressed by Ausubel (1968), and forms different problems between individual readers having access to different background knowledge. After integration, the reader has to organise the text, so that the important ideas and the relationships among them are identified. This is mainly a problem for less experienced readers, possessing fewer strategies to quickly identify important parts and thereby spending too much time on reading unimportant information. While organising a text, the student also has to make necessary inferences while reading, or has to elaborate, which is quite difficult for readers when not prompted to do so. Finally, students have to monitor their comprehension, which refers to evaluating their understanding of the text and if necessary adjusting the reading strategy. This is again quite difficult for the average reader, however this can be trained.
Developing a Tool for Learning Concept Maps Introduction
Concept mapping
A Concept map is a learning tool devised by Joseph Novak in 1970’s, based on constructivist theories of learning. It was originally intended for assessing the structure of student conceptions, before and after instruction, in order to map their prior knowledge and compare it to what they learned during the instruction. This expanded on the notions of Ausubel (1968), who stated that what the learner already knows is most important, and that this had to be ascertained before teaching. Although the use of concept maps as an assessment tool remains prevalent (Ca˜nas & Novak, 2012; Chung, O’Neil Jr., & Herl, 1999; Hwang, Wu, & Ke, 2011; Ruiz-Primo & Shavelson, 1996), over time, students began to use it as a tool to comprehend textual material by organising and elaborating on the included concepts (Ca˜nas & Novak, 2012; Eppler, 2006; Hwang et al., 2011; Karpicke & Blunt, 2011; Nesbit & Adesope, 2006).
Definition
One definition provided by Burdo and O’Dwyer (2015) states that “concept maps are hierarchical representations of knowledge. Construction of them involves linking concepts [...] through the use of linking phrases into propositional statements” (p. 335). The concepts are typically nouns or verbs with or without modifying adjectives or adverbs, and linking phrases specify the relationship between two concepts. Ruiz-Primo and Shavelson (1996) also mention these elements in their own definition, yet Ca˜nas and Novak (2012) and Eppler (2006) include a few extra features, such as the concepts being ordered in hierarchical fashion. They describe two different kinds of links, which are hierarchical links to indicate ranking between the concepts, and cross-links to indicate relationships between concepts in different segments or domains of the concept map. The latter aims at relating concepts residing within different knowledge domains, enabling better connections to prior knowledge of the learner. According to Eppler (2006), concept maps are always top-down and show systematic relationships among sub-concepts relating to one main concept, however Ca˜nas and Novak (2012) state that they can also be cyclical as long as the concepts still have a conceptual hierarchy. Finally, most of the above mentioned articles describe the links between concepts to be directed. In conclusion, the definition of concept maps used within this thesis will be:
A concept map refers to a directed graph, in which the nodes consist of concepts, and the edges of – either hierarchical or cross- – links labelled
with linking phrases, forming several propositional statements about a knowledge domain.
An example of a concept map is displayed in figure 1.
For this study, the more interesting aspects of concept maps are the use of concept mapping for elaborating, and of demonstrating meaningful relationships between concepts to learners. The first use of the concept map is known as generative use, and the second as supplantive (Smith & Ragan, 2005).
Effectiveness
Introduction Developing a Tool for Learning Concept Maps
Figure 1:An example of a concept map by Novak and Ca˜nas (2008)
map, thereby inhibiting their ability to learn from it” (p. 3). Finally, Eppler (2006) enlists some of the main advantages and disadvantages in comparison to other visualisation formats (mind maps, conceptual diagrams, and visual metaphors). A positive aspect is that students can gain information rapidly, because of the systematic, proven approach to provide an overview and the emphasis on relationships and connections among concepts. On the other hand, the technique of concept mapping is not easy to apply by novices and requires extensive training, since otherwise the maps tend to turn out to be idiosyncratic. Furthermore, although better understandability is provided, the overall pattern does not necessarily assist memorability. Finally, the quality of concept maps can be assessed through evaluation rules, however this turns out to be quite a time consuming task for the tutors.
Flashcard system
In contrast to concept maps, a flashcard system is not intended for meaningful knowledge encoding, but rather for the rehearsal of knowledge so that it keeps active and as such is prevented from being forgotten.
Definition
In the context of language learning, Nakata (2011) defines flashcard systems as learning tools in which “target items are presented outside meaning-focused tasks, and learners are asked to associate the L2 [foreign language] word form with its meaning, usually in the form of a first language translation, L2 synonym, or L2 definition” (p. 17). This form of learning is also referred to as a paired-associate format, which refers to learning by the learner being presented by cues and having to recall an associated counterpart. Besides vocabulary learning, it can also be used to memorise word definitions or topographical information. In order to be more inclusive of other use cases, the following general definition is proposed:
A flashcard system refers to any system in which a learner is presented with cues and has to recall their counterparts from a paired-associate format.
Developing a Tool for Learning Concept Maps Introduction
containing a retrieval cue on one side and the correct associated response on the other side. A learning session then consists of going through the whole stack each day and trying to come up with correct answers. Efficiency can then be increased by repeating difficult cards more often, or skipping reviewing certain easy cards for multiple days. This way, the learner only focuses on the pairs which require more practice. Finally, the size of the stack of cards can be increased over multiple days in order to improve the spreading of cognitive load. Next to these paper flashcards, there is also a multitude of digital flashcard systems available (Hwang et al., 2011; Nakata, 2011; Edge, Fitchett, Whitney, & Landay, 2012), which allow for automating the rescheduling of flashcards and thereby providing better access to more advanced algorithms.
Effectiveness
Flashcard systems have not been completely free from criticism by other researchers. Hulstijn (2001) for example describes flashcards as a relic of the old-fashioned behaviourist learning model, and McCullough (1955) states that the main emphasis of flashcards is memorisation, not comprehension. However, Zirkle and Ellis (2010) state that it is still important for teachers and students to understand and utilise memory in such a way that a store of knowledge is produced that remains flexibly retrievable in a variety of contexts over a period of time. Flashcards have been found to be both a time efficient tool for learning large numbers of facts and an effective tool for these facts to be more resistant to decay in comparison to traditional teaching methods (Nakata, 2011). Furthermore, Kornell and Bjork (2008) state that “perhaps no memorisation technique is more widely used than flashcards” (p. 125). Their effectiveness also has been demonstrated across studies in different contexts, for example that of language learning (Chien, 2015; Macquarrie, Tucker, Burns, & Hartman, 2002; McCullough, 1955; Nakata, 2011), word recognition (Joseph, Eveleigh, Konrad, Neef, & Volpe, 2012), psychology courses (Burgess & Murray, 2014; Golding, Wasarhaley, & Fletcher, 2012), and geography (Zirkle & Ellis, 2010). Therefore, many authors support pursuing research into flashcards and its effective application into classrooms.
Comparison of the two tools
In summary, most studies describe concept mapping as a tool for meaningful encoding, whereas flashcards are described as a tool for rote memorisation, and therefore imply that the former approach leads to more comprehension than the latter. A recent study by Karpicke and Blunt (2011) researched this hypothesis by comparing students who studied a text in one initial study period and then created a concept map with students who studied the same text in an initial study period and then had to retrieve as much from the text as they could on a free recall test. The retrieval group performed higher than the concept mapping group on both verbatim and inference questions, measuring both knowledge retention and comprehension. The same effect was found again in a second replication study, and also in another study by Burdo and O’Dwyer (2015). It is theorised that during elaboration, subjects attain detailed representations of encoded knowledge by linking concepts together in meaningful ways, but that during retrieval, subjects use retrieval cues to reconstruct meaning en thereby already organise the content in a meaningful way. Karpicke and Blunt (2011) conclude that these insights could pave the way for the design of new educational activities with retrieval practices in mind.
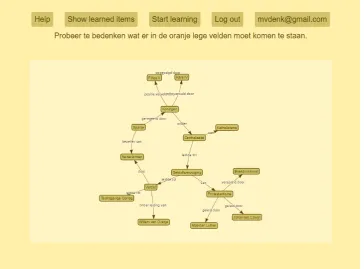
Flashmap system
Introduction Developing a Tool for Learning Concept Maps
Figure 2:A display of the flashmap system, where the user has to think of the concepts fitting in the orange nodes on the left, and has to indicate which nodes were correct on the right
Flashmap system, that combines both the visual overview of concept maps with the retrieval mechanism of flashcard systems. It will present incomplete parts of a concept map, in which the student has to fill in the missing parts of propositions represented by that map (see figure 2). These parts will consecutively be repeated according to algorithms already used by digital flashcard systems. Thereby, the system should make the relations between the concepts explicit to the student, increasing the organisation of the knowledge and reducing the segregation of facts. Because of this, the system might have the potential to bridge the gap between the two systems, and therefore make meaningful and effective rote memorisation possible, facilitating the needs stressed by both Karpicke (2012) and Zirkle and Ellis (2010) of more meaningful retrieval. Furthermore, by having the students memorise the concept map and gradually expanding on it, the generally experienced map shock occurring with expert-generated concept maps might also be mitigated (see also Tzeng, 2010).
Evaluation
This project does not only aim to develop a flashmap system, but also to evaluate it by comparing it to a similarly functioning flashcard system. Since the retrieval practices have already been established to be more effective than concept maps (see the Comparison of the two tools section), the flashmap system is only evaluated in comparison to a flashcard system and not to a concept mapping. The group approached for participating within the evaluation Dutch secondary school students using either the flashmap or the flashcard system for self study parallel with already existing classroom instruction. The content of the instruction is Dutch literature during the sixteenth and seventeenth century, to be learned by the students for a school exam. For example, the students have to learn what the influence was of the Dutch War of Independence on theSpaanschen Brabanderby Bredero. Because of the content existing mainly of concepts with meaningful relations it fits to the concept map technique, and thereby the flashmap system could be significantly beneficial over the flashcard system.
The research aims to investigate the following questions: Regarding high school students learning for Dutch literature using the flashmap system in comparison to them using the flashcard system. . .
Ia. . . . is the learning gain larger?
Ib. . . . have they spent about equal time on the software? IIa. . . . do they perceive the system to be more useful? IIb. . . . do they perceive the system to be easier to use?
Developing a Tool for Learning Concept Maps Introduction
Figure 3:The Technology Acceptance Model by Davis et al. (1989)
instruction. Sequentially, the efficiency of the system is determined by the material covered by the users, and the amount of time spent on the system.
For measuring the affectiveness of the systems, the Technology Acceptance Model by Davis, Bagozzi, and Warshaw (1989) will be used (see figure 3). This model predicts the use of an information system by measuring the Perceived Usefulness and the Perceived Ease of Use of the user. These variables are mediators between External Variables and Attitude towards using, leading to Behavioural intention to use, which in turn leads to the Actual system use, making the variables important for the later implementation of the tool within educational practices.
Answering the research questions has both practical and scientific relevance. From a practical perspective, it has potential to overcome the criticism from various authors about flashcard systems and answer the need for meaningful rote memorisation. From a scientific perspective, it can provide new insights on the way students learn texts. Finally, it makes way for new research opportunities, for example what the difference in effect is of when the user develops their own concept maps or flashcards to be used within the system, or when they are created by the teacher or an expert.
Introduction Developing a Tool for Learning Concept Maps
Cognitive theories
This chapter aims to explain the effectiveness and inner workings of both concept mapping and flashcard systems by elaborating on the physiology of the relevant parts of the brain and the relevant cognitive theories, since these provide relevant information for the design of the flashcard and flashmap system. However, a general overview of the types of learning will be addressed, and the type of learning involved within this project, in order to provide focus on the specific cognitive theories relevant for the software design.
Types of learning
According to Squire (1987), there are multiple varieties of memory, which can mainly be categorised into declarative and non-declarative knowledge, sometimes also referred to as respectively explicit and implicit knowledge (J. Anderson, 2015). Declarative knowledge also refers to memories that can be explicitly recalled, entailing facts such as definitions, paired associations et cetera, but also the events where these facts were acquired. Non-declarative memory involves every memory which can be demonstrated in action, but not in conscious recall per s´e. Subcategories of these memories are procedural skills, priming, conditioning, and non associative memories. Because of the nature of this study, the cognitive theories discussed below are mainly focused on declarative knowledge, although most theories also are relevant to non-declarative memory in some degree.
Furthermore, Smith and Ragan (2005) describes declarative knowledge as one of Gagn´e’s types of learning outcomes, and relates declarative knowledge to Bloom’s levels of recall and understanding, meaning that declarative knowledge does not only encompass rote memorisation of facts, but also understanding their underlying meaning. Another category of learning outcomes applicable to this context is that of intellectual skills, mainly that of concepts. These, according to Smith and Ragan (2005), help the learners simplify the world and can make them into more efficient thinkers. From a cognitive perspective however, there is not a great difference in dealing with declarative knowledge or concepts, because both relate to explicitly recallable memories and thereby can both be considered as being explicit (Squire, 1987).
Storage and retrieval
Developing a Tool for Learning Concept Maps Introduction
Figure 4:The brain areas mainly involved in storing and retrieving declarative knowledge (White, 2003)
Figure 5:The modal model of memory proposed by Atkinson and Shiffrin (1968)
Karpicke (2012) describes two separate learning practices based on the modal model of memory, namely encoding and retrieval practices, where encoding practices are focused on meaningful encoding or construction of knowledge, and retrieval practices are more focused on the reconstruction and rehearsal of knowledge. He states that both practices are essential to enhancing learning. The flashcard systems described in the Flashcard system on page 9 are a famous retrieval practice, which emphasise drilling the same pairs by association over and over again. Concept maps, described in the Concept mapping on page 8 are often regarded as a encoding practice, since the student has to connect diverse concepts within one topic by meaningful relations.
The following sections will elaborate on cognitive theories on encoding and retrieval practices separately, and relating them with their relevance to the effectiveness of concept mapping and flashcard systems respectively.
Cognitive effects with regard to encoding practices
The brain as an associative network
Most relevant to encoding practices is the brain being structured as an associative network, where neurons represent specific ideas, and synapses represent specific relations between these ideas. The brain can use the neural pathways formed by the neurons and synapses to find specific ideas in the brain when it is triggered by corresponding retrieval cues. These networks are sometimes referred to assemantic networks, and the retrieval mechanism asspreading activation(J. Anderson, 2015). This effect has also been found on a cognitive level, for example Kintsch, Welsch, Schmalhofer, and Zimny (1990) found that material is often not literally encoded, but rather as a set of abstract meaning units representing certain associations between concepts.
Elaborative processing
Introduction Developing a Tool for Learning Concept Maps
Craik and Lockhart (1972) conducted an experiment where students were to freely recall from a list of words after the students had to train the words by one of the following techniques: answering questions about structural details (e.g. is it in capital letters); about phonemical details (e.g. the word rhyming on another word); whether the word fits into a certain category; and whether the word fits in a certain sentence. They found that the more meaningful the task was, the higher the retrieval rate was, which was later confirmed by Barclay, Bransford, Franks, McCarrell, and Nitsch (1974). Furthermore, research conducted by Nelson (1979) presented students with paired associates that where either semantic or phonetic (in this case rhymes), and students showed a significantly higher recall of semantic associates. These studies demonstrate the importance of meaningful processing for retention.
Implications for concept mapping
Reflecting on the previously described theory of associated networks, it appears that a semantic network is very similar in structure to concept maps, and thereby the maps provide an accurate representation of the way information is retrieved from the brain. For example, Ca˜nas and Novak (2012) state that “the widespread use of concept maps is based on the notion that a concept map is a reflection of the builder’s cognitive structure and thus portrays his or her understanding of the domain depicted in the map” (p. 1). Nesbit and Adesope (2006) speculate that because of this, more and better retrieval cues are created when learning from or generating a concept map.
Cognitive effects with regard to retrieval practices
According to Karpicke (2012), many educational practices have placed an emphasis on finding optimal ways to encode knowledge and experiences, but retrieval practices have received less attention. Basic research has indicated however that retrieval is still important to consider in any analysis of learning, since information is not stored indefinitely. Two theories explaining why forgetting occurs have been proposed and debated over, namely it occurring because of interference by other memories congesting the semantic network, and it occurring because of decay of existing memories. Although both the effect of interference and decay have been proposed as separate theories and have been debated over, they are not mutually exclusive, and J. Anderson (2015) concludes that forgetting results from both interference and interference.
Power laws of forgetting and learning
When designing for memory retention, it is important to investigate with which rate people learn and forget. Already in 1885, Ebbinghaus discovered the power law of learning, referred to as the inversal exponential nature of forgetting (Edge et al., 2012; Pavlik & Anderson, 2005). The implication of this model is that memory not only systematically deteriorates with delay, but also that this loss is negatively accelerated, meaning that the rate of change gets smaller with increasing delay (J. Anderson, 2015). Wickelgren (1974) already proposed the formulam=λ(1 +βt)−ψ, wheremis memory strength (the probability of recognition),tis time,λis the state of long-term memory att= 0,ψis the rate of forgetting, andβis the scaling parameter (see figure 6a). This formula has also found to be accurate by Wixted and Carpenter (2007).
A similar effect has been found for the effectiveness of repetition: Newell and Rosenbloom (1981) have proposed a power law of learning, stating that a learning curve is inversal exponential (see also R. Anderson (2001) and Wixted and Ebessen (1991)). Murre and Chessa (2011) propose P = p(t) = 1 −e−µit as a function describing this power law, where P or p is the probability of
Developing a Tool for Learning Concept Maps Introduction
(a)The power law of forgetting, with m as the probability of recognition and t as the time passed since learning
(b)The power law of forgetting, with p(t) as the probability of recognition and t as the iterations of learning
Introduction Developing a Tool for Learning Concept Maps
Figure 7:Adaptive spaced-repetition learning (taken from Edge et al. (2012))
Spacing effect
The spacing effect is a well known effect occurring within paired-associate learning, and demonstrates that repeated items are better remembered when both occurrences are separated by other events or items than when they are presented in immediate succession (Verkoeijen & Delaney, 2008; Logan, Castel, Haber, & Viehman, 2012; Siegel & Kahana, 2014; Xue et al., 2011; Karpicke & Blunt, 2011). This effect has been demonstrated with diverse populations (Verkoeijen & Delaney, 2008; Logan et al., 2012), under various learning conditions (Verkoeijen & Delaney, 2008; Logan et al., 2012), and in both explicit and implicit memory tasks (Verkoeijen & Delaney, 2008). Items in immediate succession are called massed items, and items in separated succession are called spaced items. However, Wahlheim, Maddox, and Jacoby (2014) adds to this that the spacing effect only takes place when a student detects the repetition of an item, and therefore the interval between repeated items should not be too long.
Inspired by the power laws of learning and forgetting, Karpicke and Bauernschmidt (2011) conducted an experiment to test for a relative spacing effect, which entails that the intervals between the repetition expand, remain constant, or contract. From their findings they confirmed the effect of absolute spacing, namely that longer gaps between items do have an effect on long-term retention. They did however not find a relative spacing effect. This has not been tested for spacing with longer intervals, such as intervals spanning multiple days or weeks.
Implications for the flashcard system
Part II
Design Report Developing a Tool for Learning Concept Maps
The Project Description mainly described the needs which the Flashmap System might be able to accomodate, and on page 10 generic features of such a system are described. Although the term Flashmap System is intended for describing any system including these features, when having to evaluate the idea one has to evaluate one or multiple specific implementations of that idea. Therefore, this part specifies the design features of the specific tool developed within this project, along with arguments in favour of and against these choices and their considerations, and the process with which they are incorporated within the tool itself. The design process is based on the Generic Model (Plomp, Feteris, & Pieters, 1992), which is displayed in figure 8.
Figure 8:The generic model by Plomp et al. (1992)
Developing a Tool for Learning Concept Maps Design Report
Analyses
Before designing an educational product, it is important that the designer first acquaints himself with the relevant external factors. In order to discover these factors, Smith and Ragan (2005) enlist three types of analyses, which are an analysis of the context, of the learner, and of the learning task. Although these analyses are more targeted towards instructional design, and therefore more focused on a specific group being taught specific content, these analyses still provide relevant information for the design choices and the evaluation of generic learning tools. The steps are however adjusted, generalised, or even omitted in order to fit the design of the tool developed within this study. The information gathered in order to conduct these analyses mainly stems from meetings with one of the teachers. This might not be the most reliable source of information because of the lack of triangulation, and should therefore not be taken as insight in the curriculum of Dutch Literature courses in secondary education, but rather as context information relevant to the design. The most important findings are described within this chapter, along with their implications for the design of the software.
Analysis of the learning context
As already stated in the Evaluation section on page 11, the evaluation of the flashmap system will be evaluated within a Dutch secondary school, with students having to learn about the Renaissance genres in Dutch Literature. Although the general needs for a flashmap system are shortly provided within the Evaluation on page 11, it is still important to investigate the specific needs of the context where the programme will be implemented. Therefore, this context will be further investigated within this section, starting with the Needs Assessment (Smith & Ragan, 2005).
Needs assessment
There are multiple reason why teachers think it is important to learn about Dutch renaissance literature: one could argue that this way the knowledge is passed onto a new generation, keeping it relevant; understanding the history of literature is important for understanding modern literature; and literature can provide certain insights to the individual reading it (Slings, 2007; Dirksen, 2007). Furthermore, the school is extrinsically motivated to teach the subject matter, since subdomain E2 and E3 within the Dutch national exam programme state that a student has to recognise and distinct between literary text genres, apply literary concepts in the interpretation of literary work, provide the outlines of the literature history, and place literary works in this historical perspective (voor Examens, 2015).
Design Report Developing a Tool for Learning Concept Maps
From this test, more goals can be extrapolated, such as students having to not only distinguish different genres, but also having to define them or provide characteristics, and recognise the application of these features in both original and modern examples. Furthermore, they have to be able to relate famous writers and writings to their respective genres.
The learning environment
The school approached within this project is part of an openly denominated school organisation, con-sisting of 7 schools on different locations, and has been approved by the Dutch Inspection of Education (Kwaliteitsonderzoek in het kader van het onderwijsverslag 2016, Het Stedelijk Lyceum - locatie Kotten-park, HAVO, VWO, 2015). The course on Dutch renaissance literature consists of two different types of learning activities, which are classroom instruction, and individual learning at home by the students. There are two sessions of classroom instruction, both lasting 50 minutes, in which the 100 students are divided over the three teachers in fixed groups on separate locations. These lessons take place over the course of two weeks, with one lesson provided in one week. Within these lessons, the teachers transfer knowledge and provide exercises for the students. Outside of the lessons, the students still have to study the textbook Laagland individually (van der Meulen & Kraaijeveld, 2010), which contains all of the materials which will be prompted on a final written assessment. As already stated before, the teacher indicated this activity mostly to take place on the evening before the assessment, and only on a superficial level. Finally, this assessment takes place in the second week after the final instruction, and will be similar to the example test included in the appendix on page 75.
The teacher stated that the course mainly consisted of the rote memorisation of facts, and that she was still doubtful whether the students would actually be willing to participate in the evaluation of the Flashmap system. Yet, she did see the general use of the tool for achieving the learning goals, and therefore still seemed enthusiastic to cooperate with the research and to encourage the students to participate. The only two technical problems are that there is not too much time for extra activities within the lesson plan and the teachers being quite busy themselves, and that the technological possibilities within the classroom are limited. Within the classroom, only a couple of computers are available for use, and still run relatively old software. Therefore, the activities involved in using the flashmap have to target the individual learning of students in their own spare time, since they have more time outside of the lesson plan, and mostly do possess the hardware and software necessary to run the learning tool.
Analysis of the learner
Physiological characteristics
The physiological characteristics of the students’ brain provide important implications for the design of the software. The students are enrolled in grade 4 of Dutch secondary education, and therefore should be around the age of 16-17, with some deviations due to them either having skipped or repeated a grade. Therefore, the students are generally considered to be either at the end of puberty, or the beginning of young adolescence. The Cognitive theories chapter on page 13 already provides general theories about the learning process within the brain. However, during late puberty and early adolescence, the brain is still heavily in development, especially the prefrontal cortex (Blakemore, Burnett, & Dahl, 2010). In order to map out the changes in the adolescent brain, Giedd et al. (1999) performed a longitudinal MRI study of the brain development during this period, where three themes emerged within the adolescent development of the brain:
1. After a peak in growth of both brain cells, connections and neurotransmitters during childhood, one can see a decline in adolescence;
2. The connectivity between different regions of the brain increases; 3. A new balance is formed among frontal and limbic lobes.
Developing a Tool for Learning Concept Maps Design Report
which are activated during this time. The second theme refers to the strengthening of specific memories, which are enhanced during that period. For both of these themes, the flashcard system proves to be a useful tool, since it focuses on repeating specific associated pairs that the learner wants to remember.
Referring to the third theme, during adolescence a shift is made from “cold” to “hot” cognition, where the former relates to hypothetical, low-emotion reactions, and the latter to high arousal decision making, strongly influenced by peer pressure and real, direct consequences. This is highly related to the prefrontal cortex being heavily developed, resulting in the teenage brain to rely more on the amygdala which is the more emotional, impulsive area of the brain. This means that for students to be motivated to learn, they either need a strong intrinsic motivator, or they have to rely on what Powell (2006) describes as an “external prefrontal cortex”, which can be either a reward or a person reminding them to study (e.g. the teacher or a parent). Therefore, extrinsic factors such as the usefulness of the system to passing the school test, a voucher for ice cream, and the teacher are used to motivate the students to use the system.
Cognitive characteristics
All students should have learned about the relevant time period in their history classes prior to this course (e.g. the Spanish War and the Lutheran reformation), providing the relevant knowledge to understand the context of Dutch renaissance literature. Additionally, the students have received a similar instruction on Dutch medieval literature, which is also relevant for concepts in the renaissance literature such as Mecenas,LyriekandRederijkers. Therefore, these concepts form the root concepts from which to start within the concept map.
One difference between students is whether they chose technical or society-related subjects. This makes up for different specific aptitudes within this specific Dutch literature course. Furthermore, some of the students are also enrolled in classical subjects, and because the Dutch renaissance literature has a lot of connections with classical genres, these students might have an advantage in prior knowledge. Both technical and society-oriented profiles, and classical and non-classical profiles are therefore accommodated for within the concept map.
Social characteristics
Grever, Pelzer, and Haydn (2011) provide information on the perspectives on learning history by Dutch, English and French high school students. Within this study, students were asked several questions about what kinds of history, which periods of history are important or interesting for the students, and what the meaning of history is for their personal lives and what they believe to be its relevance for society. For Dutch students, this study found that the history of ones own family generally ranks high, and after that the history of the country where the parents come from (both for natives and non-natives). This means that native students might be more interested in learning about the subject than non-native students. Furthermore, the history of one’s own religion is mostly important for Moroccan and Turkish students (which are mostly Muslim), so the history of Christianity is generally not that interesting towards them. The study also found that the time period of early modern history is the least interesting for students, no matter the gender or nationality, despite that in the Netherlands the most important topic is the rise of the Dutch republic and the Golden Age (the historical context for the subject used within this study). Finally, the study states that there were no significant differences in perceptions of prevocational students and HAVO/VWO students in these respects, although one might expect Gymnasium students to be more interested in the classical revival of art during the renaissance than the Atheneum students.
Analysis of the learning task
Design Report Developing a Tool for Learning Concept Maps
relevant elements, and it is useful to investigate the specific uses of the instruction within the context of this project.
Learning goals
The direct learning goals of the instruction can be found in section 13.4 of Laagland, the specific instruction for the Dutch renaissance literature, where the sections before that only provide the prerequisite knowledge necessary to understand this paragraph. The different chapters describe theemblematiek, thelyriek, the sonnet, and the different theatrical genres (the tragedy, the comedy, and theklucht). One of the goals of this instruction is that the students are able to describe these genres, and are able to differentiate between the subgenres or terminology within these genres. However, the students also have to be able to relate these genres to the general context described in the previous chapters, which consist out of the political, the socioeconomic, and the cultural backgrounds.
Types of learning
Attaining these skills are mainly intellectual in the typology defined by Smith and Ragan (2005), because the students mainly have to be able to describe and discriminate between defined concepts. However, there is also a certain amount of declarative knowledge learning involved because students have to first learn and memorise certain definitions or conceptual organisations. Furthermore, within the book there are not only abstract concepts being defined, but also declarative knowledge such as names of important authors (Vondel, Bredero etc.), books or plays (e.g. theKlucht van de koe), and certain historic events such as the migration of Calvinists from Antwerpen to Amsterdam in 1585.
Concept map
Because the information has already been defined within the textbook (both the new content and prerequi-site content), the information-processing and prerequiprerequi-site analysis activities have been replaced by that of translating the content of the instruction within the textbook to a concept map. Within this map, not only the relevant concepts, names and events are presented, but also the relations between them, providing a more meaningful representation. Furthermore, the concept map also contains information about the order in which the concepts have to be learned, because of the direction of the relations. The data used for the concept map is uploaded on github1. A direct visualisation is too extensive to be feasibly included within this report, however a digital visualisation is available2(after a short initial rendering time due to its size). The Concept map construction design features section on page 26 will elaborate further on the design choices for the concept map. Finally, this map is directly shown to the students within the flashmap condition during the experiment.
Flashcards
The activity of specifying the learning objectives is replaced by that of formulating the flashcards, because the flashcards already form the specific knowledge-based learning objectives. They already contain the most important types of information which should be included in an objective, namely the statement of the terminal behaviour (the answer itself), the conditions of demonstration (given this question, the student can reproduce the correct associated answer). The standards or criteria for these objectives are globally defined, namely that the student has to be able to demonstrate that he knows the correct concept corresponding to a parent node and edge label. The flashcards are directly based on the previously defined concept map. Within this activity, edges and their corresponding parent nodes were transformed to a question, and the child node formed the answer to that question. For example, the nodesStrijdliteratuur andActualiteit, respectively connected by the edgeverwees naar, is translated to a flashcard ”Q: Waar
Developing a Tool for Learning Concept Maps Design Report
verwees de Strijdliteratuur naar?”→”A: Naar de actualiteit” (Translation:To which did the war literature refer? To actual events). Sometimes, multiple edges from one node to several child nodes having the same label or falling within the same category were translated to only one single flashcard. The data for the flashcards can be found again on github3.
Test specifications
The assessments conducted before and after the students have used the learning tool consist partly out of the questions from the flashcards for measuring knowledge reproduction, but also partly of questions targeted to measure the comprehension levels of the students (see Bloom et al., 1956). On both assessments for all questions, the students are asked to fill in an answer in a text box. In order to answer the questions for comprehension, a student has to be able to draw relations between not directly linked nodes, and thereby requires a higher degree of mastery of the content. It does however not yet contain any questions where students have to apply the content within different context, or have to think outside of the content directly taught, since these questions would rate on even higher levels on the taxonomy of Bloom. Finally, the questions are phrased according to the specified action verbs related to the level of learning. A more detailed elaboration of the test construction and analysis can be found in the Instrumentation section on page 48, and all of the comprehension level questions are included on github4.
Design Report Developing a Tool for Learning Concept Maps
Design frameworks
This chapter describes the general design frameworks used for the design and development of the software. First, the paradigm of supplantive versus generative instruction are expounded on, after which the frameworks for Concept map construction design features (Novak & Ca˜nas, 2008), flashcard learning design features (Nakata, 2011), and the ARCS model for motivational aspects (Keller, 2000) are described together with their design implications. Within the Software design and development chapter it is described what the actual product looks like from a user perspective, including whether the software does or does not adhere to these implications.
Supplantive or generative
The first important design choice which has to be made is whether the students are supplied with a concept map or flashcards, or that they generate the content themselves. The dichotomy of generative versus supplantive instruction is described in further detail by Smith and Ragan (2005), where the implications of both sides are enlisted for the learner, the task and the context.
One of the aspects of generative strategies is that the learner requires a higher amount of prior knowledge, a higher aptitude, and a wider and more flexible range of cognitive strategies, because the content still has to be (partly) researched and constructed. Greater mental effort generally leads to greater depth of processing and therefore better, more meaningful learning, which was also stressed by Ca˜nas and Novak (2012) and Nesbit and Adesope (2006). Furthermore, learners experience a higher motivation and a lower amount of anxiety when using generative strategies, and their attribution of success is internal rather than external. However, generative learning requires a higher amount of skills, and therefore if generative strategies are used for the flashmap system, the students should first learn how to effectively construct a concept map. Furthermore, when using more generative strategies, the learning task becomes more complex and ill-structured, and therefore requires effective scaffolding and time to complete. It also leads to a higher focus on cognitive strategies, but less so on the learning goals. These goals can also not become universal, since each student creates their own flashcards or concept map, and therefore decides on their own learning content.
Developing a Tool for Learning Concept Maps Design Report
Concept map construction design features
Unfortunately, little is written about the design of clear concept maps for supplantive use. Only one technical report by (Novak & Ca˜nas, 2008) is written on how students should construct concept maps, however the main focus of this document is on how this process can be scaffolded rather than discussing good design features of concept maps. The only two features mentioned are:
• Cross-links are important in order to show relationships between subdomains in the map (also mentioned by Eppler (2006))
• One should avoid “String maps”, which are maps mainly consisting of large sentences within the nodes
The developed concept map therefore focuses on meaningful relations between concepts rather than hierarchical structure, and divides nodes into smaller nodes whenever one node becomes to large.
Finally, Eppler (2006) describes that concept maps are top-down diagrams rather than radial diagrams, therefore the graph layout will be hierarchical with top-down orientation.
Flashcard learning design features
Nakata (2011) describes a framework for developing flashcard applications based on several design features generally present in all major flashcard systems, and findings of earlier studies. The framework is split up in features aimed at creation and editing of flashcards, and at learning of flashcards. However, the creation and editing features are not relevant to the design of the flashmap system, since the content is already developed for the students. Furthermore, the Flashcard systems reviewed by Nakata (2011) are aimed at vocabulary learning, so not all of the guidelines mentioned in the review can be fully generalised to the flashmap system. That being said, there is still quite some overlap between the functionality of these reviewed systems and the flashmap system, and even if a principle is not (completely) applicable it is still relevant to know why this is not the case and what should be the guideline instead.
The flashcard learning features can be split up in two subcategories, which are features related to how the cards are presented (Presentation and retrieval modes, Retrieval practices, Increasing retrieval effort, and Generative use), and features related to the rescheduling of cards for review (Block size, Adaptive sequencing, and Expanded rehearsal).
Presentation and retrieval modes
It is recommended to use two different modes, namely the presentation mode — where users can familiarise themselves with not seen before flashcards —, and the retrieval mode — where the user tries to actively retrieve a target when shown the associated cue. The presentation mode is introduced within the framework since retrieval of unfamiliar targets would only result in unsuccessful performance and negative effects on the motivation of the user. However, since the students have already familiarised themselves by listening to the teacher explanation and reading the book, it was decided to only include the retrieval mode within the software.
Retrieval practices
Retrieval practices relate to the ways the system prompts the user to recall a target from memory. Within vocabulary learning, there are four different categories of retrieval practices divided over 2 axes, which are reception versus production, and recall versus recognition.
Reception and production The first axis of reception and production relates to which part of the
Design Report Developing a Tool for Learning Concept Maps
retrieve when being shown ”Goedenmiddag”, whereas in productive recall ”Goedenmiddag” would have to be retrieved when being shown ”Good afternoon”.
Recall and recognition The second axis refers to how the retrieval takes place, namely whether the
student tries to recall the cue from memory (recall), or whether he chooses the correct answer from a list of possibilities (recognition). For example, when presented with ”Goedenmiddag”, when using recall the student should think of the correct answer on his own, where when using recognition the student should choose the correct answer from a list, e.g. ”Good morning”, ”Good afternoon”, or ”Good evening”.
It is difficult for students to acquire both the word form-meaning connection and the word form of a word simultaneously, mainly because of limited cognitive resources. Therefore, good vocabulary learning software should split these tasks into separate exercises, first using reception or recognition (or both), and then using specifically productive recall.
In the case of using flashcards for learning texts, reception and production could be interpreted as prompting the question versus prompting the answer. Recall and recognition still work in the same way, namely as an open prompt or a multiple-choice prompt. In flashmaps however there are not 2 elements but 3 elements per prompt — the parent node, the edge, and the child node — and this makes way for 6 options rather than 2 options for the reception-production axis, which are displayed in table 1. Within the table they are ordered from leaning towards reception to learning towards production, with the underlying hypothesis that retrieving the child node is more in alignment with reception whereas retrieving the parent node is more in alignment with production. This of course also depends on the concept map. The recall and recognition axis still stays the same, where in the latter case the possible options could be displayed next to the flashmap.
Parent node Edge Child node
1 X X
2 X X
3 X X
4 X
5 X
6 X
Table 1:The different possibilities for the reception-production axis in the flashmap system, with an hypothesised ordering from more leaning towards reception to more towards production. The shown elements for each retrieval mode are indicated by an X, whereas the other elements would be the targets for retrieval.
Only one retrieval practice was chosen for this experiment in order to keep the amount of variables to a minimum and thereby make a better comparison between the experimental conditions. For the flashcard condition, the receptive recall was chosen, since this was the skill most relevant to the test itself. The flashmap equivalent was retrieval practice 1 from table 1 combined with recall (in contrast to recognition). Other retrieval practices are however still worth investigating in further research.
Developing a Tool for Learning Concept Maps Design Report
Increasing retrieval effort
The design feature of increasing retrieval effort is strongly related to the choices made with regards to the previous design features. It entails that over the course of multiple presentations of one associated pair, the challenge of retrieval should be increasing. This can be achieved by starting with the presentation mode before introducing the retrieval mode, and by gradually shifting from recognition modes to recall modes and from receptive modes to production modes. However, since the presentation mode is omitted and only one retrieval practice is chosen within this project, increasing retrieval effort is not feasible in this way. This again could be incorporated in later prototypes where other retrieval practices are incorporated.
Generative use
Generative use of words refers to presenting words in novel contexts (in contrast to how generative was used in the first section of this chapter), which enhances the elaborative processing of certain concepts. Within the flashmap system, this is incorporated by presenting the concepts together with different edges, sometimes because a concept switches from child node to parent node, but in other cases because multiple unique edges direct from or to a concept. Within the flashcard system, this is also the case, but more implicit, because every edge (or group of similar edges) being translated to flashcards, and thereby having the concepts incorporated within multiple questions and answers. The only concepts appearing in one instance would be the concepts with only one outgoing edge (root node, K=1), since they only appear in one question, or only one incoming edge (leaf node, K=1), since they only appear in one answer. Of these, the root node problems can be eliminated by creating more direct subconcepts in the hierarchy or omitting the direct subconcept and linking its subconcepts directly to the root node. The leaf node problems are more difficult to eliminate, but can still be linked to other concepts by creating more cross-links, generating more incoming or outgoing edges on the lower levels. However, this is not always possible, since certain leaf nodes cannot be meaningfully connected to other nodes. In this case it is also worth considering whether this node could be eliminated altogether.
Block size
Within the Spacing effect section on page 17 it is described how repetition of an item is more effective when interleaved by other items (spaced items) than when repeated in immediate succession (massed items). The block size is therein defined as the length of items after which items are repeated again. When using massed items, one would have a block size of one, whereas when interleaving each repetition by 8 other items, the block size would be 9. The Implications for the flashcard system section on page 17 however describes why it is better to use adaptive spaced-repetition learning instead of fixed block sizes, which is also recommended by Nakata (2011). Therefore, no specific fixed block size is used within the scheduling algorithm.
Expanded rehearsal
According to Nakata (2011), expanded rehearsal is widely believed to be the most effective. The main difficulty for choosing the right slope for the expanded rehearsal curve is to balance between overlearning — repeating items too often and thereby reducing the effectiveness of each repetition — and the forgetting curve — repeating items too little and thereby leading to the students forgetting the card, frustrating the user and even causing ineffective studying.
Design Report Developing a Tool for Learning Concept Maps
an increased confidence within the user because of the higher percentage in correct retrievals, and can therefore also be beneficial (Edge et al., 2012). The Pimsleur system is also rather simple, reducing the amount of variables in the research. Because of these reasons, it is chosen as the basis for the flashmap scheduling algorithm.
Adaptive sequencing
An adaptive sequencing algorithm takes into account the learners’ previous performance on individual items when rescheduling an item for the next review. Within the original Pimsleur system, one would always increase the time interval for the next review, independent of whether the student could correctly recall the item or not. However, this does not account for the flashcards which are more difficult or forgotten at the time of the new review, resulting in the user not being able to keep up with those cards.
The first system to implement an adaptive sequencing element is the Leitner system, which is also the most basic adaptive sequencing system. Here, the user has a number of stacks, each representative of a expanded time interval, and a stack of physical flashcards. Each time a flashcard is answered correctly, it moves to the next stack, resulting in a larger time interval before the next repetition, and when answered incorrectly it would be moved back to the first stack. The rationale behind this system is that when an item cannot be retrieved it is forgotten, and the expanded rehearsal should therefore be reset to the lowest value.
The main problem with the Leitner system is that when it was introduced, managing the flashcards and different stacks was quite a hassle. This problem was resolved with the introduction of digital flashcards, since the computer could take care of the scheduling and bookkeeping of the flashcards and their reviews. The Leitner system is therefore still prevalent in most digital flashcard systems (e.g. superMemo, Anki, and FaCT).
When combining the Pimsleur and Leitner system as one system, one gets the formulai= 5cfor scheduling the flashcards, whereiis the time interval in seconds, andcthe amount of times the flashcard was correctly retrieved for this item since the last incorrect retrieval (or the total amount of retrievals when there were no incorrect retrieval).
Edge et al. (2012) introduced an even more sophisticated system, namely the adaptive spaced repetition system. On top of the Pimsleur intervals and Leitner adaptive sequencing, it also adapts the time intervals based on the amount of answers correctly and incorrectly answered by the student for each time interval. This results in specific time intervals better catered towards the user’s ability. This is not included within the scheduling algorithm used within this project, since it introduces another experimental variable. It can however still be included in a later prototype when aiming to improve the prototype.
The ARCS model
The Analysis of the learner section on page 21 already states that it is likely for the students to have a low intrinsic motivation for engaging into the subject matter. Therefore, it is also important to include a framework within the motivational domain next to the previous framework focusing mainly on the cognitive domain. A commonly used and well researched model for incorporating motivational features is the ARCS model (Keller, 2000), which is an acronym for Attention, Relevance, Confidence, and Satisfaction. The factors were applied within the application where possible, however many are also applied within the context outside of the application. They all can be expressed in three subcategories, described in the following sections.
Attention
Developing a Tool for Learning Concept Maps Design Report
Perceptual arousal This mainly refers to the simple events — such as whistles or strange imagery — in
order to capture the interest from the learner. In order to achieve this for drawing the user towards using the system, the researcher went to the classroom in the last lesson where the subject material was taught, where the attention was mainly gained from the effect of having someone else than the teacher appearing in the classroom. Within the system itself it was harder to achieve, since the content of the instruction was dynamically generated and therefore it is more difficult to find fitting content for each study session. It would then also add extraneous cognitive load, which is undesirable both for the learning achievement as well as the experimental setting.
Inquiry arousal This relates to the deeper, mentally stimulating problems which can be offered to the
student in order to activate engagement with the topic. Related to the content itself, this is mainly done by the teacher within the lessons and by the instructional material. The researcher also tried to stimulate inquiry by stating that this was an early opportunity for the students to experience what research on a university looks like. Finally, by continuously asking questions users are also stimulated to actively participate in the instruction.
Variability Finally, if the setup for every instruction is the same, learners will eventually get disengaged
because of the predictability. Using this system instead of the usual chapter reading in preparation of an exam might be an example of breaking such a predictable pattern. On the other hand, one of the downsides of drill and practice is its repetitive nature, so this could demotivate or disengage the students.
Relevance
Gaining arousal is not enough to keep the learner engaged over a long period of time. One method to keep the attention is for the user to understand why it is relevant to engage in the learning activity. The subject matter itself however is not that interesting towards the average high school students (see the Social characteristics section on page 22). Therefore, the presentation of the system by the researcher will mainly focus on how it can help students to effectively and efficiently prepare them for the exam, since this is likely to be their direct goal.
Goal orientation The first step in establishing relevance is to relate to the needs and goals of the learner.
In order to achieve this, the introduction by the researcher mainly delves into how a general flashcard system works and how it benefits learning, making the process more effective and efficient than purely reading through the book. Added to this, it is mentioned that some of the flashcard and test questions will be repeated on the actual test used for grading the students, making it extra attractive because of the sneak preview.
Motive matching This relates more to provide learners with appropriate choices, responsibilities, and
influences. One way to do this is by modelling, derived from the theory of planned behaviour (Ajzen, 1991). In order to convince the students that the software is reliable, the researcher adds an anecdote from his own experience of using the system, and that by using it he had a guarantee of being well prepared for exams because of how the algorithm works.
Familiarity This subcategory mainly refers to tying the content to the learners’ experiences.
Design Report Developing a Tool for Learning Concept Maps
Confidence
The learner must also be confident that he is able to learn the subject and to perform the learning activities successfully. This confidence can be boosted by creating the right expectations and providing positive feedback related to the learning activity.
Learning requirements One way the confidence can be boosted on beforehand is by assisting in building
a positive expectation for success within the learner. In this case this is done by the researcher first acknowledging within the initial presentation that learning and comprehending the core message of a text can be difficult, but that the system can assist this process greatly. Furthermore, within the presentation as well as within the software it is made clear that the researcher could support individual learners at any moment if they would get stuck using the application. Within the software, this is achieved by including a separate help page with explanations on how to use the software, a small text above the main content explaining what the user should do within the current step, and an email address in the navigation menu for contacting the researcher himself.
Learning activities Additionally, the learning activities themselves can also support or even enhance the
students’ beliefs in their competence. As explained in the Adaptive sequencing section, the expanded rehearsal slope is chosen to be relatively flat, which generates more overlearning and thereby increases the amount of correct retrievals and boosting confidence. A more steep slope would result in more failed retrieval attempts, increasing the frustration within the user and thereby requiring a more stoic attitude.
Success attributions Finally, the learner also has to attribute his success to the use of the system in order
to be motivated to use it. However, according to Logan et al. (2012), judgement of learning of students using spaced items does not appear to be higher than when using massed items. A separate overview is therefore included explicating the progress the learner has made by using the system and how much items are still left.
Satisfaction
Finally, in order to sustain motivation after the student is attentive towards, understands the relevance of, and is confident about performing the learning activities, satisfaction is required. This is mainly related to positive feelings stemming from the reward system, and are generally categorised in intrinsic and extrinsic motivation.
Self-reinforcement Intrinsic satisfaction is probably the most powerful satisfaction, since it works
directly on the short-term. This feeling can be instigated for example when the learner is intrigued by the subject, but also when he experiences some form of achievement. Since most students will most likely not be highly interested in the subject matter, the first category of intrinsic satisfaction will only be met in rare cases. However, successful retrieval does lead to a sense of achievement, next to it being a confidence boost and effective learning tool. Therefore, self-reinforcement might already be included within the nature of flashcard systems themselves.
Extrinsic rewards An important extrinsic motivator for the student is to pass the test at the end of
Developing a Tool for Learning Concept Maps Design Report
questionnaire, and spending 15 minutes every day over the course of 6 days on the system. This reward of ice cream seemed to be what the students were most excited about during the initial presentation by the researcher.
Equity Finally, it is important that each learner has a feeling of fair treatment. This entails that there
Design Report Developing a Tool for Learning Concept Maps
Software design and development
Within this chapter, the software is described from a user’s perspective and linked to the design implications provided in the Analyses and the Design frameworks chapters. The software is implemented as a web application in order to facilitate easy access from any web browser with internet connectivity. For a more technical description of the server and client, the full server documentation is included within the Flashmap Server Documentation appendix on page 79, and the client source code within the Source files of the client appendix on page 102. Finally, the complete source code is available on github5.
Page elements
Each page is represented as a web page containing 4 different page elements, which are the navigation menu, the instructions panel, the main viewer, and a button panel. Within the different views of the application, they generally preserve the same functionality and layout, and will be explained below after the description of the colour scheme.
Navigation menu
The navigation is centred at the top of the screen, displaying buttons for the pages of the applications and a button to contact the developer for help (see figure 9).
Instructions panel
The instructions panel is the next element is placed below the navigation menu, and is reserved for providing the user with extra instructions where needed. It does not have a background colour, but it does have a fixed height in order to keep all elements at the same place independent of the length of the instruction.
Main viewer
The main viewer is the central element, and expands from the instruction panel to the button panel. Within this container, the main content of the specific view is displayed, such as the flashcard or concept map, the questionnaire, or the log-in form. In order to stand out from the rest of the page, it has a separate background with rounded corners. The background colour is somewhat lighter in comparison to the general background colour in order for the text to be better readable. The main viewer is also the container for visjs, which is a JavaScript library for rendering graphs in browsers.
5https://github.com/mcvdenk/MasterThesis-Software