The Visual and Beyond: Characterizing Experiences with
Auditory, Haptic and Visual Data Representations
Trevor Hogan
Cork Institute of Technology
Cork, Ireland
[email protected]
Uta Hinrichs
University of St Andrews
St Andrews, UK
[email protected]
Eva Hornecker
Bauhaus Universität
Weimar, Germany
[email protected]
ABSTRACT
Research in sonification and physicalization have expanded data representation techniques to include senses beyond the visual. Yet, little is known of how people interpret and make sense of haptic and sonic compared to visual representations. We have conducted two phenomenologically oriented com-parative studies (applying the Repertory Grid and the Micro-phenomenological interview technique) to gather in-depth accounts of people’s interpretation and experience of different representational modalities that included auditory, haptic and visual variations . Our findings show a rich characterization of these different representational modalities: our visually oriented representations engage through their familiarity, ac-curacy and easy interpretation, while our representations that stimulated auditory and haptic interpretation were experienced as more ambiguous, yet stimulated an engaging interpreta-tion of data that involved the whole body. We describe and discuss in detail participants’ processes of making sense and generating meaning using the modalities’ unique characteris-tics, individually and as a group. Our research informs future research in the area of multimodal data representations from both a design and methodological perspective.
ACM Classification Keywords
H.5.m. Information Interfaces and Presentation (e.g. HCI): User Interfaces
Author Keywords
Qualitative evaluation; Sonification; Physicalisation; Phenomenology; Repertory Grid, Micro-phenomenological interview; Data interpretation; Embodiment.
INTRODUCTION
Information visualization, “the use of computer-supported, in-teractive, visual representations of abstract data to amplify cognition” [9, p.7], is arguably one of the most common ways to represent data. While originally applied mostly in profes-sional contexts by experts, visualizations has become ubiq-uitous, be it as part of online news [15], in public spaces [4,
Permission to make digital or hard copies of all or part of this work for personal or classroom use is granted without fee provided that copies are not made or distributed for profit or commercial advantage and that copies bear this notice and the full citation on the first page. Copyrights for components of this work owned by others than ACM must be honored. Abstracting with credit is permitted. To copy otherwise, or republish, to post on servers or to redistribute to lists, requires prior specific permission and/or a fee. Request permissions from [email protected].
DIS 2017,June 10-14, 2017, Edinburgh, United Kingdom © 2017 ACM. ISBN 978-1-4503-4922-2/17/06. . . $15.00 DOI:http://dx.doi.org/10.1145/3064663.3064702
18, 59], or to depict personal data [24, 58]. This expansion of InfoVis application areas comes with new target audiences and has motivated new research questions regarding the design of visualization: “beyond the desktop” [28], for non-experts [26, 16, 40], to tell stories [25, 51], or to promote engaging (per-sonal) experiences [18, 58]. This trend has also fueled research into alternative ways of representing data addressing haptic (cf. [22]), auditory (cf. [48]) or even gustatory (cf. [53]) senses. In parallel, recent work has started to investigate the interpre-tation of visualizations on a more personal level, beyond per-ceptual and usability questions [19]. However, little is known about how the modality of a data representation influences people’s interpretation process and their overall experience of the representation. How can we characterize haptic, auditory, and visual data representations when it comes to sense making and experiences beyond perception and usability?
In this paper we start to investigate these questions by drawing from recent trends in data visualization, sonification, and phys-icalization on the one hand, and recent empirical approaches of capturing people’s personal experiences with data representa-tions on the other (cf. [19]). We report on two phenomenolog-ically oriented comparative studies that capture rich accounts of people’s “lived” experiences with three different represen-tational modalities: haptic, auditory and visual—one applying the Repertory Grid technique [14] and the other based on the Micro-phenomenological interview technique [61]. Findings from our RepGrid study allow us to start characterizing peo-ple’s experience with these three different representational modalities, highlighting representational challenges as well as different hedonistic responses to variations of these modalities. The micro-phenomenological interviews revealed detailed ac-counts of people’s data interpretation processes through the different modalities, including processes of sense- and mean-ing makmean-ing and aspects that support and hamper these. Synthe-sizing our findings from both studies we uncover and discuss aspects of data representation that have received little attention in past work, including: the role of the body, and the social and tangible properties of data representation.
THE MODALITIES OF DATA REPRESENTATION
have studied how spatial-temporal visualizations of people’s personal data can facilitate reminiscing and storytelling [58]. Hogan et al. have presented the Micro-phenomenological interview technique1—a technique applied as part of our work presented here—to capture capture personal experiences of visualizations and their interpretation [19]. Their study shows that even plain graphs and charts can trigger vivid associations with past experiences which, in turn, heavily affects people’s interpretation of the presented data. Such research on how visualizations influence people’s interpretation and experience on a personal level, beyond efficiency and usability is still at is infancy. Similarly, little is known of how the experience of visual data representations compares to representations that address auditory and haptic perceptual channels, namely sonifications and physicalizations.
Sonification: Representing Data through Sound
Sonification has been defined by Kramer and colleagues as “the transformation of data relations into perceived relations in an acoustic signal for the purposes of facilitating communi-cation or interpretation” [34, p.3]. However, the use of sound to represent data is by far not as widespread as the use of visual representations. Arguably, the visual system is better equipped for processing and providing an overview of large amounts of data at once; sound is perceived sequentially, and making sense of nuances in sound sequences—in particular if they are unfamiliar—is difficult [45, p.7]. Also, in contrast to the field of information visualization where design principles have been established and are in constant review (cf. [3], [8]) there are few agreed principles to designing sonifications [1, 2, 34]. However, research suggest that sonification has potential. The human hearing system is capable of discriminating small changes in pitch and tempo [44]. Auditory representations perform well when it comes to trend analysis, the estimation of data values or comparison, and pattern detection [64], and can highlight subtle or gradual value changes and emphasize anomalies and outliers [13]. Nesbitt [46] suggests temporal data to be one of the most promising use cases for sonification (e.g., rhythm can represent changes of data across time).
While previous research has highlighted the potential of sonifi-cation, little is known of how people experience, characterize and interpret sonifications, not only at a cognitive, but also at a somatic and emotional level. Aiming to close this gap, our research starts to investigate how people characterize their experiences and interpretations of sonifications in comparison to visual and haptic representations.
Physical Representations
In contrast to visualization and sonification, physical data rep-resentations focus on haptic ways of representing data. Jansen and colleagues coined the termPhysicalizationas: “a phys-ical artifact whose geometry or material properties encode data.” [28, p.3228] and established a framework for visual-izations to help describe, compare and critique non-screen based data representations [28]. Data physicalization is now an active research area (e.g., [42, 54, 56]). Recent research has started to explore the perceptual traits of physicalization in order to develop design guidelines. Jansen and Hornbaeck
1Formerly known as the Elicitation Interview technique
found that size (as a visual variables) is perceived with with the same level of accuracy in 3D and 2D charts [30]. Willett et al. introduced the notion ofembedded data representationsas physicalizations and visualizations that are “deeply integrated with the physical spaces, objects, and entities to which the data refers” [66, p.461].
Another class of physical representation utilizes haptic or tactile feedback, instead of mapping data to physical form (e.g., [22, 57]). In tactilization information is conveyed through tactile stimulation [9]. In contrast to data physicaliza-tion, tactilization allows for the creation of dynamic displays supporting data-driven vibro-tactile feedback. Our work aligns with the tactilization variant of physical data representations in that the haptic design probe used in our studies presents data-driven tactile stimuli . Some work has been conducted to understand how people perceive data represented through vibro-tactile feedback. Brown et al. [7] found high recogni-tion rates representing data throughroughnessandrhythm. Hoggan and Brewster [23] explored amplitude modulation, frequency, and waveform included in textures as parameters for haptic data representations and found the use of amplitude modulation to be the most successful.
Similarly to sonifications, tactilizations and physicalizations seem to have the potential to promote unique experiences with data, however, apart from some notable examples (cf. [20]), not much research has compared haptic with visual and au-ditory representation modalities. Hogan and Hornecker [20] found that people appear to rely more on intuition and real-world experiences when making sense of haptic and sonic, compared to visual representations, and tend to engage in more personal, emotionally-driven interpretations. In contrast, a visual representation (a bar graph) was experienced more as a pragmatic tool. We expand this work by providing a more de-tailed and nuanced characterization of people’s interpretation and sense-making processes and their overall experiences with variations of visual, auditory and haptic representations, based on two phenomenologically-oriented studies: one allowed par-ticipants to explore, describe, and share their experiences with such modalities ad-hoc in form of a focus group; the other was based on interviews we conducted with participants who had used a visual/haptic/auditory data representation as part of their daily activities for one week.
RESEARCH APPROACH
To gather accounts of participants’ “lived” experiences (that go beyond usability and performance issues) with visual, haptic, and auditory data representations we conducted two studies that are both structured around the use of design probes—data-driven artifacts designed specifically to be used and studied in (open-ended) scenarios. The phenomenologically-driven methods applied in the two studies (the Repertory Grid for Study 1, and Micro-phenomenological interviews for Study 2) were chosen as both are specifically designed to capture per-sonal lived experiences with technology.
Design Probes
artifact (the typical procedure with TP), we designed three artifacts that differ in their representational modality, to start a comparative characterization of these particular aspects.
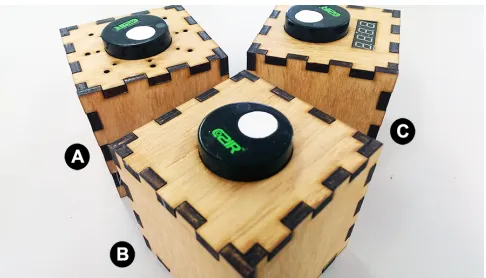
Our interest in studying moments in time when people ex-perienced and interpreted the data representations drove our process of designing the probes. We wanted to design for in-teractive experiences with the data that would require attention and interaction (in contrast to ambient displays [52]). Fur-thermore, we wanted participants to use the probes wherever they found them useful (employing Willett et al.’s notion of embedded data representations[66]) and to be able to pick up and handle the data devices freely. The final design probes have the shape of a cube that fits comfortably into an adult hand and that can be placed safely on a flat surface (see Fig. 1). This shape also enabled us to exploit the cube’s surfaces for user interaction and to display information.
Each design probe represents the same set of data: indoor air quality (IAQ) as dynamically measured by the sensors embed-ded in the cubes. The probes also have the same form factor, however, each represents the data using a different modality; a particular variation of an auditory, visual, or haptic representa-tion. The design space for each of these representation modal-ities is large, e.g., there are many ways of enabling the haptic experience of data, even when focusing on tactilizations. Our probes therefore can be considered as one particular example of each modality that allows a first comparative characteriza-tion of how such modalities influence people’s interpretacharacteriza-tion and experience of the represented data. Our methodology and findings informs future studies to gradually form holistic insights on how representational modalities compare.
The auditory probe maps data to the frequency of a computer-generated sound using a 50mm (diameter), 0.5W, 8-ohm speaker. The data is transformed into sound by mapping each quantitative value to a particular sound frequency within a pre-defined range: a low value causes a low-frequency sound and visa versa. The haptic probe represents the data through vibra-tions accentuated by eight five-volt vibration motors fixed to the inside walls of the cube. Once triggered, the data is mapped to the speed of the motors. The visual probe shows this data as digits on a 4-digit, 7 segment LED display. In contrast to the auditory and haptic probe, this visual-numerical display represents the data in a highly familiar format to remind our participants of the purpose of the probes (the representation of IAQ measurements). Figure 1 shows all three probes in their final form. Real-time IAQ level readings can be triggered by shaking the probe; knocking on one side of the probe triggers the probe to display (in its particular modality) the highest cur-rent data value while knocking on the opposite side displays the lowest current IAQ value.
Study Methodologies
[image:3.612.322.565.60.199.2]Working within a phenomenological tradition, studying peo-ple’s experience of data requires empirical grounding in actual lived experiences. However, capturing lived expe-riences directly is notoriously difficult as it requires self-awareness which can be clouded in retrospect through post-hoc rationalization [61]. With the RepGrid tech-nique and Micro-phenomenological interviews we apply two
Figure 1. The three design probes: auditory probe (A), haptic probe (B), and visual probe (C).
phenomenologically-driven study methods that have been de-signed to capture people’s lived experiences with technology while minimizing such threats. We used the RepGrid tech-nique in Study 1 to gather participants’ characterization of each probe that they agreed upon within a focus group, while Study 2 used the Micro-phenomenological interview tech-nique to shed light on specific moments of the experience and the cognitive processes people employ when interpreting the data represented in different modalities. While findings from Study 1 shed light into participants’ shared ad-hoc impression of the different modalities, Study 2 provides deeper insight into people’s impression of the prototypes after more elabo-rate individual interactions over a week. We highlight that the purpose of running these two studies was not to compare the methodologies, but what these would reveal about people’s experience of the representational modalities.
THE REPGRID STUDY
The aim of the Repgrid study was to explore immediate re-sponses to different variations of representational modalities— as manifested in the three design probes—and to gather first-hand accounts of how people collectively characterize each probe and their interpretation of and/or interaction with it. The RepGrid is a cognitive mapping technique and a methodolog-ical extension of George Kelly’s Personal Construct Theory (PCT), used to systematically elicit the way in which people construe their experience of objects, people, and events [32], and has been proven to be a valuable technique in phe-nomenological studies to understand, for instance, user experi-ence [17], perceived qualities of computational objects [12] and to reveal rich design-relevant insight [21]. In contrast to similar methods that are typically based on predefined, given constructs (e.g., Semantic Differential [60]), the RepGrid elic-its personal constructs from participants first-hand. While a typical RepGrid study is conducted with individual partic-ipants, we conducted it as a focus group sessions [21], to enable participants to explore, compare, and discuss the repre-sentational modalities in form of our design probes, leading to richer characterizations of their experiences.
Participants & Procedure
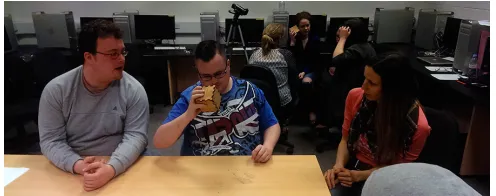
Figure 2. Participants exploring the design probes during the RepGrid familiarization phase.
triad procedure [14], which involves investigating three objects in the same study; in our case the three design probes.
Familiarization Phase.The study commenced with a 1-hour familiarization session. Participants were first introduced to the three design probes, the data these represent, and how to interact with them. After this, we randomly divided partic-ipants into three groups of four, with each group spending 20 minutes with one probe before moving on to the next, until all groups had explored each probe. Participants’ approaches to exploring the probes during this phase can be characterized as a shared activity, facilitated by the probes’ form factor: The probes were passed around so that one participant could individually interact with it, while verbally sharing their ex-periences with the other participants. Other group members typically participated in such explorations passively through comments (see Fig. 2). Group discussions revolved around the interpretation of the data represented by the probe through their haptic, visual or auditory modality.
Construct Elicitation Phase.The familiarization phase was followed by a focus group session where all participants to-gether established a list of personal constructs that described their experience of and with the probes. A personal construct is a bipolar dimension, which describes the meaning people apply to an object or event [32]. To establish a range of per-sonal constructs participants were asked to describe how two probes are similar (Convergent pole) but differ from the third (Divergent pole). Once consensus was reached, the personal construct and the position of each probe on the bipolar dimen-sion was recorded (see Table 1). This process was repeated until the participants agreed they could not come up with any further personal constructs.
A researcher was present during both the familiarization and construct elicitation phase to answer any questions, and both phases were video- and audio-recorded.
Data Analysis
In total 15 personal constructs emerged from the construct elicitation phase and form the basis of the RepGrid. 13 of these were established directly by the participants, while the last two were derived from our transcript analysis as described below. Table 1 presents the personal constructs (PC) in the order they were recorded during the focus group session, so PC 1 (Ambiguous – Precise) was the first to be established by participants. The RepGrid not only contains the list of agreed upon personal constructs, but also includes indicators that show at which end of the dimension the participants choose to place each probe. For example, PC 1 shows that there was
Table 1. The RepGrid produced by participants. PC1–13 were agreed by the participants. PC14 & 15 were derived from our analysis.
an agreement that the haptic and auditory probe should be described asambiguous, unlike the visual probe, which was described asprecise(see Table 1).
All participant statements during the familiarization and con-struct elicitation phases were fully transcribed. The established personal constructs were then linked back to the transcripts of the familiarization and construct elicitation session. The aim for establishing such links is fourfold: (1) to trace the emer-gence of the personal constructs, (2) to examine the meaning participants’ attribute to constructs, (3) to search for further constructs that may not have been recorded in the focus group, and (4) to establish themes around personal constructs.
We describe our findings below. Participants’ statements can be distinguished by their identifier in square brackets.
Findings
The constructs formed by participants encompass three themes: Describing Characteristics of Modalities, Issues with Interpre-tation, and Experiential Responses.
Describing Characteristics of the Modalities
While the primary aim of our RepGrid study was to shed light on how participants experienced the probes, five constructs reference aspects of the modalities that are more easily dis-cernible; they directly characterize the probes based on the modalities they incorporate. These include PC5:Sonic – Silent, PC12:Invisible – visible, and PC10:Tangible – Non-tangible, which are arguably obvious constructs to apply to the probes.
[image:4.612.52.300.62.160.2]only shows one number at a time, the others seem to get bigger or smaller without you even knowing about it.”[P2].
Finally, PC15*:Mixed Senses – Single Modalityis the result of our transcript analysis. It refers to the notion of multi-modality. Eight participants experienced the haptic probe to incorporate more than one modality—a haptic and auditory representation—and six participants explicitly stated that they would focus on the sounds emitted from the vibrations when trying to interpret the data. This was not the case with the au-ditory or visual probes. Participants seemed to experience the redundant representation of data through multiple modalities as positive. Four participants mentioned a desire to augment the other two probes with additional modalities to make their representation more engaging and easier to understand.
Issues with Interpretation
Tracing the personal constructs back to the study transcripts, we identified five constructs that reflect on participants’ inter-pretations of the data through the probes’ modalities. These include PC1:Ambiguous – Precise, PC2:Difficult to interpret – Easy to interpret, PC4:Wide – Narrow, PC11:Interpretive –
Informative, and PC13:Instinctual – Knowledgeable.
PC1 reflects participants’ characterization of the probes based on the accuracy in which data could be perceived:Ambiguous – Precise. In contrast to the visual probe, the haptic and
audi-tory probes were described asambiguous(see Table 1; PC1). Participants’ discussion provides explanations, as illustrated in the following extract of a group comparing the accuracy in which data can be experienced:
[P3]“It [the audio] is better than the haptic one. Like, when you are trying to understand where the shaky [haptic] one is.” [P2]“Yeah, but do you know that we are not getting an exact measurement? Like, we cannot tell if it is exactly 70 or whatever in here. What if there were three or four distinct sounds, like a high sound and a low sound and then something that would be more precise in the middle.”
This dialogue reveals participants’ awareness that the data represented through sound is more precise than through haptic feedback such as vibration, but neither is as clear as the number display. Typical words to describe the visual representation included:clear,precise,accurateandexact. Similarly, PC2: Difficult to Interpret – Easy to Interpretreflects on how much the modalities facilitate understanding of the represented data (see Table 1; PC2). Although all participants managed to generate meaning from all three probes, participants agreed that, compared to the visual probe, the haptic and auditory probes were difficult to interpret. This is not surprising as the visual probe shows the data as definitive digits.
While Constructs PC1 and PC2 reflect on the ease in which meaning is ascribed to the representations, PC4:Narrow – Wide relates to how nuanced changes in the data were perceived (see Table 1; P4). The visual probe allowed for the perception of fine-grained “narrow” changes in the data, while changes had to be more pronounced or “wide” in order to be perceived in the other probes. While large differences in data are eas-ily recognized (“You know a low tone, and you know a high tone.”[P2 about the auditory probe]), all participants men-tioned struggling with more subtle changes.
Related to the level of interpretation allowed by each probe, our participants agreed to describe the haptic and auditory probe asinterpretive, but considered the visual to be infor-mative(see Table 1; PC11). The last construct within this theme relates to participants’ process of interpretation (PC13: Instinctual – Knowledgeable). Again, the auditory and haptic probes were grouped together as with them participants had to rely on their instinct when interpreting the data, in contrast to the visual probe, as reflected in the following extract:
[P4:]“I suppose it is the exact reading you are getting [with the visual probe], and there is nothing else influencing it: you just look at the numbers and it should be clear.”[P2:]“Yeah, not like the sound or vibration. They are influenced by what you know already or what your feeling is about the sounds or vibration.”[P1:]“This one [the visual probe] is pretty much straightforward, there is no messing around with it. A number is a number to me and all of us, isn’t it?”
Experiential Responses
Five personal constructs reflected on how the different probes shaped participants’ experiences of the data, ranging from PC3:Engaging – Non-engaging, PC6:Unfamiliar – Familiar, PC7: Passive – Harsh, PC8: Playful – Logical, and PC14: Evocative – Straightforward(see Table 1).
In contrast to the auditory probe, participants described their experience of the haptic and visual probes asengaging(see Table 1, PC3). Their discussions reveal that reasons for this characterization of the haptic probe lie in its multimodal nature. Four participants mentioned that they found the sounds emitted from the motor to reinforce the sensation felt in their hands when handling the haptic probe: they experienced the data through two sensory channels instead of only one, as with the auditory and visual probes. One participant remarked:“I think the sound is reinforcing the vibration, and it is more engaging than when you just read off a screen [referring to the visual probe]”[P6]. However, all participants found the visual probe to be most engaging because the representation of data through simple digits easily showed even subtle changes in the data. It is likely that this is the reason why we observed participants shaking the visual probe more frequently, requesting data updates more often than with the other two probes.
Participants also found differences in the intensity of the rep-resentational feedback experienced through each probe. They considered this experience to bepassivewith the haptic and visual probes, whereas the auditory was experienced asharsh as illustrated in the following extract:
[P2]:“The sounds seem to alert you more than the vibration, these sounds are almost painful, something like it is trying to warn us. Where the vibration was just like a sensation, it didn’t really hurt me.” [P1:]“The vibration was more subtle than this, subtle or maybe a bit boring. Not boring, the numbers are boring, but the vibration didn’t really alert or warn us.”
dis-cussed in the previous paragraph. The probes considered to be playful seemed to allow for increased exploration, whereas the visual probe returned a logical stream of numbers. This is closely related to PC6:Unfamiliar – Familiar, which relates to participants’ acknowledgment that the haptic and auditory probes are unusual data representations, whereas the numerical display used in the visual probe is more familiar.
PC14:Evocative – Straightforward, the final construct under this theme, was not established during the construct elicitation phase, but emerged when we examined the study transcripts. We found that participants’ experience of the auditory and haptic probes evoked memories of past events and objects. For example, when exploring the auditory probe, participants continuously compared its sounds to other sounds they heard in the past, including an ambulance siren, an alarm, buzzing bees, or dogs howling. The following dialog illustrates this and shows how such connections are used when interpreting the meaning of the represented data:
[P6:] “It sounds like Morse code.” [P8:]“No, more like a dial-up tone.”[P4:]“Yeah.”[P6:]“But Morse code is more like it, because that’s a kind of communication as well, it could be words or numbers in sound.”[P8:]“The dial-up is numbers as well.”[P6:]“Is it?”[P8:]“Well, yeah, zeros and ones—it’s the sound of data being transferred from one place to another, like this device.”
Similarly, on six occasions, participants mentioned recalling past experiences that were similar to the sensation provided by the haptic modality. Sometimes this helped them make sense of the data, such as comparing weak vibrations to a mobile phone’s buzz and strong vibrations to traveling on a train. One participant used this continuous spectrum of vibration strength to judge the real-time data readings. In other instances, participants discussed the communication of information through vibration, for example, how difficult it is to communicate precise information using the analogy of vibrations of an alarm clock: the vibration alerts you to wake up but cannot indicate the time directly. In contrast, for the visual probe, while more straightforward to understand, there is no evidence that it evoked familiar real-world analogies, nor did participants use past experiences to interpret the numbers.
To summarize our findings, our analysis of the RepGrid pro-duced by participants (see Table 1), alongside the transcripts from the focus group session, shows that the auditory and hap-tic probes produce similar experiences (in 10/15constructs). Our participants described their experience of the auditory and haptic modality to be: ambiguous[PC1],difficult to in-terpret[PC2],narrow[PC4],sonic[PC5],unfamiliar[PC6], playful[PC8],interpretive[PC11],invisible[PC12], instinc-tual[PC13], andevocative[PC14*]. In contrast, the visual probe was only considered to be similar to the auditory probe in four constructs: both were characterized aswide[PC4], dig-ital[PC9],non-tangible[PC10], andsingle modality[PC15*]. Similarities between the visual and the haptic probe were only found once with participants characterizing their experiences with both these probes asengaging[P3]. Our findings can be partly explained by the implicit nature of the audio and haptic modality which provides a sense of the represented data, in contrast to the visual probe which shows the actual numbers.
While the RepGrid allowed us to uncover how participants characterized their experience with the different representa-tional modalities, these are based on brief ad-hoc interactions in a study environment. In order to capture more nuanced details on how the different modalities influence experiences with data representations, we conducted a second study that allowed people to interact with the probes over a longer time and in a more familiar environment.
MICRO-PHENOMENOLOGICAL INTERVIEW STUDY For our second study, participants were given one of the three probes to take home for one week to use and explore in their own time. We then conducted an Micro-phenomenological in-terview with them to capture their experiences with the probe. The Micro-phenomenological interview is a retrospective in-terview technique, and a method of the phenomenological tra-dition known as psycho-phenomenology [62]. First developed by Pierre Vermersch [61] to be used in an educational context, it is a non-inductive approach that elicits information through an in-depth interview about the experience at increased levels of “granularity”. To accomplish this, the participant is guided back toward the re-enactment of the experience under investi-gation in order for them to provide an account, not only about conscious acts but also those actions or cognitive processes that occur sub-consciously [49].
Participants & Procedure
Twelve participants (19-45 years; mean 28.1, SD 9.2; 5 male) took part in the study; none of them had participated in the RepGrid study. Unlike the RepGrid study the participants’ professional backgrounds vastly varied and ranged from com-puter programmers, teachers, athletes, to secretaries as we sought to study a wider user group and use scenarios. Each participant was assigned one type of probe to take home so that each modality was explored by four participants over the course of one week. During this time, participants used the probes as they saw fit, but they were encouraged to use it as much as possible. A researcher contacted the participants each day to monitor the use of the probe and to answer questions.
Data Analysis
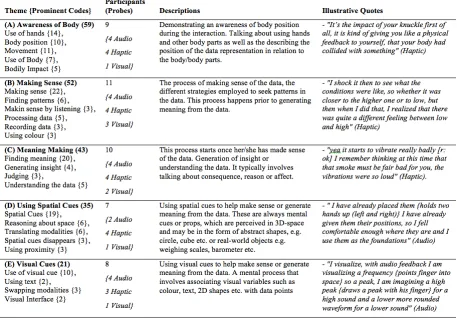
We transcribed the video- and audio recordings including all verbal data and some non- and para-verbal cues, including speech tempo, pauses, facial expressions, body gestures and eye directions. These transcripts were then analyzed using a Thematic Analysis approach [5] which involved five discrete phases: (1) familiarization, (2) thematic coding, (3) extracting themes, (4) reviewing themes, and (5) defining and naming themes [19]. In an open coding approach, 72 unique thematic codes emerged from the transcripts. These were reviewed and grouped into broader themes in relation to the research question that applied across transcripts [6]. A total of 22 initial themes emerged from the analysis, 16 of which included more than 10 codes, that is, they were apparent in more than ten statements across participants. Since a full description of all sixteen themes would exceed the space limits of this paper, we will present the five most prominent themes in detail (see Table 2). A list and description of all 22 themes is included as additional material to this paper2.
Findings
The five most prominent themes that emerged from our inter-view analysis are: awareness of the body during interaction (Theme A), making sense of data (Theme B), finding meaning in the presented data (Theme C), and using spatial cues to as-sist sense- and meaning-making (Theme D & E)(see Table 2).
Awareness of Body
9/12 participants referenced their body when recalling their experience with the probes (Theme A, see Table 2). Compared to others, this theme is composed of more codes (59), which suggest an importance of people’s embodied experience when they interacted with the probes. The distribution of the codes across the probes—haptic: 29, auditory: 27 and visual: 3— suggests that the auditory and haptic probes heighten people’s awareness of their body. For example, participants who used the haptic and auditory probes more often mentioned their hands, illustrated in this comment by a participant talking about using the auditory probe for the first time:“I do the high value first, so I hold it on the low side, with my left hand and knock with my right hand where it says high.” [CN]. As this statement already suggests, participants also frequently talked about their interactions with the probes (knocking and shaking, holding, touching, grasping, and feeling the probes). This is further illustrated in the following statement of a participant talking about their first time using the haptic probe: “[...] it felt solid, it felt strong, it felt secure, and the next step, I tried the low and the high to see the difference in sound [mimicking a shaking gesture] and then I shock it to hear [brings hands up to his ear] to see what the sound was.” [FS].
Eight participants stated to recall haptic sensations through particular body parts, as illustrated in the following interview excerpt (statements from the interviewer in bold italic).
[KP; haptic probe:] “I feel the vibration and I think back to what it was like before.” How do you think back? [KP:]
“I have a feeling stored in my mind, and I recall that when I want to compare it.”So you recall the sensation from the morning. How do you recall this, how does this appear?
2http://www.tactiledata.net/elicitationthemes/
[KP:]“It doesn’t appear, I don’t see it.”Ok, so you don’t see it. So how does it appear to you? If I ask you to try to recall it now, could you?[KP:]“Yes, I am sure I can. [pauses for a few seconds, stares into space] Yeah, it is like, it is in me. [points to his chest].” In your chest? [mirrors the gesture]
[KP:]“Yeah in... somewhere in there [points to chest again].” Ok, so if we go back to when you are standing, holding the cube in the air, and you are feeling the sensation, do you feel it now?[KP:]“Not at the same time, I feel the new sensation in my hands and the old one inside me.”
Two other participants who used the haptic probe described feeling sensations from within their body (e.g., in their head, chest, or hands) in similar ways. Six participants, who used the auditory and haptic probes also talked about their body po-sition when interacting with the probes, for example, standing, sitting, walking or bending down, as the following statements illustrate: “I actually stood up and brought it over to the door, because I wanted to see what the levels were outside: were they any different outside?” [DME, auditory probe]. We also found examples where participants mentioned moving the probe towards themselves to facilitate the interpretation of the data: “I put it up to my ear, so I could hear it better because of the ambient noise in the room.” [MC, auditory probe].
While the tangible interface of the probes may have triggered such mentions of the body, we only found three such com-ments in relation to the visual probe, compared to 27 with the auditory and 29 with the haptic probes. This suggests that it is the representational modality and the way in which it is mani-fested in the probes that influenced participants’ awareness of their body when interacting with the data probes.
Making Sense vs. Meaning Making
Our interview analysis revealed episodes where participants experienced moments of insights, and we grouped these into two themes: Making Sense and Meaning Making (Themes B and C, see Table 2). Both themes represent key phases when generating insight from data. Their differences are subtle but became apparent in participants’ statements. The theme “Making Sense” includes codes regarding theprocessof under-standing the representation and its underlying data, whereas the theme “Meaning Making” refers to instances where the participants were trying to interpret their observations to arrive at higher-level insights—anoutcome. For example, in some episodes, participants recalled moments where they were at-tempting to interrogate or find patterns in the data (Making Sense); in others they were trying to contextualize the data to gather a general meaning (Meaning Making). The following excerpt illustrates this distinction:
[JC; haptic probe:]“I was trying to find a pattern. [pauses 1 sec.] I was trying to find a pattern between the vibration levels.”The high and the low?[JC:]“Yeah, between the high and the low. And I was wondering then if the room, because this room was... It was a little bit stuffy, it wouldn’t have a lot of air going into it. I was wondering whether that was hampering the results that I was getting.”
Table 2. Themes and their corresponding codes that emerged from the transcript analysis. The numbers in the theme column refer to the number of occurrences of the codes. The numbers in the particpants column refers to amount of particpant transcripts that the codes were applyed to
then, however, she tries to put her observations into context; explanations that would justify the data readings she is experi-encing through the representation. This excerpt illustrates a fluid transition from making sense to meaning making—the process of discovery from first making sense of the data and then finding a justification/interpreting for this observation.
Using Spatial Cues
7/12 participants recalled episodes where the appearance of “mental images” helped them to make sense of and interpret readings from the data probes. For example, five participants working with the auditory and haptic probes described that handling the probes triggered a mental image where data val-ues were transformed into objects arranged in space. The proximity between objects within this mental image helped them to interpret the difference between data values.. The following interview extract illustrates this:
[TH; auditory probe:]“I have one sound here [points his two hands out in front] and then the other one is here [moves his left hand to his left]. They are on this bar, and if they are the same they will be on top of each other but these are not. There is a bit of distance between them so they are different.”
Ok, so do you see this bar? [TH:]“Aehm... [pauses for 2 sec. and stares into space] No, I don’t. It is there but I don’t see it. It’s like I know there is something there, but I don’t see a picture of it. But there are two sounds on it.”
Interestingly TH acknowledges that he does not see the bar that he uses to place the markers on, although he is sure that it is there. Five participants using the haptic and auditory probes described similar episodes. One participant, for in-stance, mentioned how he recalled and compared the haptic data representations: “It is just like... [pauses for 2 sec.] It’s just how I placed it with my head maybe... I just place it closer to the high sound than to the low.” [KP, Haptic]. Another participant described a similar strategy comparing two data readings (past and real-time) of the auditory probe: “I see it as two sides. It is closer to the lower side or the higher side [waves his hand from left to right], and so there is a... It is like a pendulum, which way is it going towards.” [MC, Auditory].
Only one participant using the visual probe described such mental images. Recalling her experience of comparing three data points this participant stated: “I am just thinking about... [pauses for 3 sec.] Where it [the current value] would fall between the two [previous values] on a number line. Would it be closer to this end of the scale [draws a line with her hands and then moves both hands to the left], then it would be up here [moves right hand over to the right].” [AS, Visual].
Partic-ipants described these markers as three-dimensional shapes, such as boxes, blocks, or spheres, except the one participant who used the visual probe: who described them as being actual numbers, but different from those used on the probe: “They are numbers. Yeah, they are characters... [pauses 3 sec., then draws the number in the air with her fingers] That kind of font, it was from my old maths book or something...” [AS, Visual].
The mental images that some participants described were simi-alar to typical visualizations such as scatter plots or spectro-graphs that are used to visualize audio frequencies. While this similarity could be due to the ubiquitous nature of such visualizations in everyday life, we know from previous studies on how children communicate complex math problems, that such visual mental models are quite common to make sense of data [39]. What is interesting is that, in particular, the haptic and auditory modality seem to trigger these mental images.
Sharing Discoveries and Data Experiences
Although the Micro-phenomenological interviews focused on an episode where participants felt they formed meaning from their interaction with the data probes, the transcripts also revealed how they share their experiences with others. On occasions participants talked about being eager to tell others about their latest reading and to alert them about low air quality. This is illustrated in the following extract:
[AS; visual probe:]“Well it is not just bad for me, it’s bad for everyone”For everyone? [AS:]“Yes for the rest in the room, it is their air as well, so I should tell them about it.”
How do you tell them? If you go back to the time when you realised that you should tell them, how do you realise you should tell them? [AS:]“[Pauses for 3 seconds] I am looking at the cube, the sound is in my head and I say to myself: ‘Jezz, this is not good, let’s tell Margaret [daughter] about it.’”
And what do you do next? [AS:]“I go over, with the cube to talk to her about it.”
There were also occasions when participants wanted to confirm the real-time readings with others who shared the space.
These findings confirm and expand the RepGrid study in that they show similarities in experience of the haptic and auditory probes that differ from the visual probe, but reveal more details on how people formed an understanding and meaning through their interaction with the probes and the role of embodiment as part of this. In the following we discuss the findings from both studies, also in the light of previous work.
DISCUSSION
Synthesizing our findings from both studies, we discuss the characteristics of peoples’ experience with different probes and their inherent modalities, further elaborate on issues re-lated to their shareable and tangible nature, and highlight research questions that our findings inform.
Characterizing Experiences with Different Modalities When examining the results of both studies it becomes appar-ent that the haptic and auditory represappar-entational modalities as represented through our probes are experienced similarly, in contrast to the visual modality, in particular when it comes to the interpretation of data and embodied experiences.
Data Interpretation & Process
Both studies show that data interpretation using haptic and auditory probes was more difficult and lacked accuracy com-pared to the visual probe, in particular when it came to rec-ognizing subtle changes. This is not surprising, given we typically rely much more on our visual senses than on hap-tic and auditory perception. However, our analysis of the micro-phenomenological interviews shows that participants’ interpretation process of the probes not only consists of sense-making, that is trying to decipher the represented data val-ues and seeking patterns or correlations in this data, but also ofmeaning-making, a phase which typically follows sense-making and that involves trying to understand what the data readings actually mean and what their implications are in a particular context (e.g., is the air quality concerning or not).
Regarding the strategies that participants employed to interpret the data, our findings confirm previous research [20]: partic-ipants tried to find analogies between the readings from the data probes and familiar sounds or sensations that they had previously experienced to make sense of the data. However, the micro-phenomenological interviews indicate that partici-pants subconciously made use of mental images to make sense of the data (e.g., translating sounds into points on a horizon-tal line, revealing higher and lower values), which parallels previous research on children solving math problems [39] and how people experience simple graphs and charts on a personal level [19]. What is interesting about these findings is that these mental images seemed to be triggered predominately by the haptic and auditory probes but not by the visual one. These results expand previous research on how insight is generated through visualization (cf. [47, 50]), but also raise new ques-tions. For example, how significant are these mental images for sense- and meaning making and for recall? Do such mental images play a role in non-numeric visual or multimodal repre-sentations? Our findings suggest that auditory and haptic data representations may be more successful in combination; partic-ipants found the haptic probe to be richer in representing data as it also emits sounds as a side-effect of the vibrations. Fu-ture research has to investigate if and how haptic and auditory modalities in combination with with visual representations enrich or change experiences.
Our findings on data interpretations are influenced by the par-ticular design of our probes which represent one data point at a time upon request. However, previous studies indicate that au-ditory and haptic modalities can also facilitate the recognition of patterns in continuous data streams (cf. [44]). Future studies will investigate how people experience different representa-tional modalities designed in different ways with continuous data streams as well as other types of data.
The Role of the Body
other body parts such as the chest. Similarly, participants mentioned experimenting with the auditory probe, holding it far away from their body, or closer to their ears, or holding it in different ways to hear how the sounds changed. These observations can be better understood by aligning them to Merleau-Ponty’s concept ofMaximum Grip, which pertains to how people continually strive toward an equilibrium with the world. In other words, people are solicited by objects that emit stimuli by placing themselves in the best position to expe-rience and perceive these stimuli [41, p.302]. The transcripts show that the haptic and auditory modalities seem to heighten this sense of solicitation, as our participants recalled numerous episodes where they positioned themselves, or the probe to enhance their perception of the data representation; partici-pants interacting with the visual probe did not employ these actions. While the HCI community has embraced the role of the human body in interaction design and cognition [31, 33, 36, 37, 38, 43, 55, 63], the role of the body in data representa-tion has received little attenrepresenta-tion, with notable exceprepresenta-tions [26, 29]. Our findings suggest that representing data beyond the visual modality affords designers opportunities to promote full-body experiences of data; encouraging people to use their body in way that is not commonplace today with information visualizations. This could prove useful in beyond-the-desktop scenarios such as public spaces, museums, or classrooms [28].
From a methodological perspective, we highlight that these reflections by participants on the role of their body as part of the data exploration were not so apparent in the RepGrid study. This may be due to the study design, as the RepGrid was con-ducted in a lab where particpants interacted with the probes sit-ting on a table, whereas the probes were deployed in more nat-ural surroundings during the micro-phenomenological study. It may also be a factor of how reflections were elicited during the RepGrid vs. the micro-phenomenological interviews, em-phasizing the importance of employing different methodolog-ical approaches when studying concepts such as experience beyond the perspective of usability.
The Value of Tangible, Shareable Data Interfaces
In both studies, our participants not only described their expe-rience of the probes in relation to their own body but also in a larger tangible and social aspect. Their experiences relate to the concept ofembodimentwhich, from a phenomenologi-cal perspective, refers to the phenomenal body—beyond the physiological entity—and to the role it plays in our direct ex-periences of the world. Embodied interaction as “the creation, manipulation and sharing of meaning through engaged inter-action with artefacts” [11, p. 126] is a well-known concept in HCI. Our design probes employ the fundamental characteris-tics of embodied interaction; they afford natural interaction and are embedded in the world to which they refer. The use of a portable device allows people to sample data around them, and we found that this creates a sense of personal meaning.
Previous research has suggested that tangible, shareable vices to monitor data can stimulate engagement and de-bate [35]; our findings suggest that this may expand to data representations. Our design probes stimulated conversations and debate during the RepGrid study, and we found similar
ten-dencies during the micro-phenomenological interviews where participants mentioned sharing of the probes as well as insights gained from their readings. Supporting the social aspects of data representation is especially important today, as they play a role in almost every aspect of our lives. Our findings show that tangible and shareable data representations that employ modalities beyond the visual can play an important role in the future design of tools for data exploration.
Limitations
We acknowledge that our design choices manifested in our probes of how to represent data through visual, auditory and haptic means may have have influenced participants’ expe-riences. Future research therefore will show how much the findings presented in this paper generalize to other variations of representational modalities. As mentioned earlier, the de-sign space is large here, and other dede-signs and representational mappings may trigger new discussions around similar or dif-ferent aspects. In particular the sounds emitted by the haptic probe technically make it a multimodal representation which may have contributed to participants’ similar characterizations of the haptic and audio modality. Future studies have to inves-tigate how our findings apply to different designs. An obvious next step would be to design visual probes that represent data using typical visualization techniques as opposed to numbers. What our study contributes are first insights into this inter-esting research area alongside a methodological approach of elicitating experiences from participants directly—within a both an lab or everyday life setting.
CONCLUSION
REFERENCES
1. Matt Adcock and Stephen Barrass. 2004. Cultivating design patterns for auditory displays. InProc. of the International Conference on Auditory Displays (ICAD).
2. Stephen Barrass. 2003. Sonification design patterns. In 9th international conference on auditory display.
3. Jacques Bertin. 1983.Semiology of Graphics: Diagrams, Networks, Maps.University of Wisconsin Press,
Madison.
4. Jon Bird and Yvonne Rogers. 2010. The Pulse of Tidy Street: Measuring and Publicly Displaying Domestic Electricity Consumption. InWorkshop on energy awareness and conservation.
5. Richard E. Boyatzis. 1998.Transforming Qualitative Information: Thematic Analysis and Code Development. Thousand Oaks, California: Sage Publications.
6. Virginia Braun and Victoria Clarke. 2006. Using thematic analysis in psychology.Qualitative Research in
Psychology3, 2 (jan 2006), 77–101.DOI: http://dx.doi.org/10.1191/1478088706qp063oa
7. Lorna M. Brown, Stephen A. Brewster, and Helen C. Purchase. 2005. A First Investigation into the Effectiveness of Tactons. InFirst Joint Eurohaptics Conference and Symposium on Haptic Interfaces for Virtual Environment and Teleoperator Systems. Institute of Electrical and Electronics Engineers (IEEE), 167–176. DOI:http://dx.doi.org/10.1109/whc.2005.6
8. Stuart K. Card and Jock Mackinlay. 1997. The structure of the information visualization design space. In Proceedings of VIZ '97: Visualization Conference, Information Visualization Symposium and Parallel Rendering Symposium. Institute of Electrical and Electronics Engineers (IEEE).DOI:
http://dx.doi.org/10.1109/infvis.1997.636792
9. Stuart K. Card, Jock D. Mackinlay, and Ben Shneiderman. 1999.Readings in information
visualization: using vision to think. Morgan Kaufmann Publishers Inc.
10. William S. Cleveland and Robert McGill. 1987. Graphical Perception: The Visual Decoding of
Quantitative Information on Graphical Displays of Data. Vol. 150. Journal of the Royal Statistical Society, Series A (General).
11. Paul Dourish. 2004.Where the Action is. MIT University Press Group Ltd.
12. Daniel Fallman. 2003.In Romance with the Materials of Mobile Interaction: A Phenomenological Approach to the Design of Mobile Information Technology. Ph.D. Dissertation. Umea University, Faculty of Social Sciences, Informatics.
13. Sam Ferguson, Kirsty Beilharz, and Claudia A. Calò. 2011. Navigation of interactive sonifications and visualisations of time-series data using multi-touch
computing.Journal on Multimodal User Interfaces5, 3-4 (nov 2011), 97–109.DOI:
http://dx.doi.org/10.1007/s12193-011-0075-3
14. Fay Fransella, Richard Bell, and Don Bannister. 2003.A Manual for Repertory Grid Technique. JOHN WILEY & SONS INC.
15. Tong Gao, Jessica Hullman, Eytan Adar, Brent Hecht, and Nicolas Diakopoulos. 2014. NewsViews: An Automated Pipeline for Creating Custom
Geovisualizations for News. InProc. of CHI. 3005–3014. DOI:http://dx.doi.org/10.1145/2556288.2557228
16. Lars Grammel, Melanie Tory, and Margaret-Anne Storey. 2010. How Information Visualization Novices Construct Visualizations.IEEE Transactions on Visualization & Computer Graphics16, 6 (2010), 943 – 952.
17. Morten Hertzum, Torkil Clemmensen, Kasper Hornbæk, Jyoti Kumar, Qingxin Shi, and Pradeep Yammiyavar. 2007. Usability Constructs: A Cross-Cultural Study of How Users and Developers Experience Their Use of Information Systems. InUsability and
Internationalization. HCI and Culture. Springer Nature, 317–326.DOI:
http://dx.doi.org/10.1007/978-3-540-73287-7_39
18. Uta Hinrichs, Holly Schmidt, and Sheelagh Carpendale. 2008. EMDialog: Bringing Information Visualization into the Museum.IEEE TVCG14, 6 (2008), 1181–1188.
19. Trevor Hogan, Uta Hinrichs, and Eva Hornecker. 2016. The Elicitation Interview Technique: Capturing People's Experiences of Data Representations.IEEE Transactions on Visualization and Computer Graphics22, 12 (dec 2016), 2579–2593.DOI:
http://dx.doi.org/10.1109/tvcg.2015.2511718
20. Trevor Hogan and Eva Hornecker. 2012. How Does Representation Modality Affect User-Experience of Data Artifacts? InHaptic and Audio Interaction Design. Springer Nature, 141–151.DOI:
http://dx.doi.org/10.1007/978-3-642-32796-4_15
21. Trevor Hogan and Eva Hornecker. 2013a. Blending the repertory grid technique with focus groups to reveal rich design relevant insight. InProceedings of the 6th International Conference on Designing Pleasurable Products and Interfaces - DPPI '13. Association for Computing Machinery (ACM), 116–125.DOI: http://dx.doi.org/10.1145/2513506.2513519
22. Trevor Hogan and Eva Hornecker. 2013b. In touch with space. InProceedings of the 7th International Conference on Tangible, Embedded and Embodied Interaction - TEI '13. Association for Computing Machinery (ACM).DOI:
http://dx.doi.org/10.1145/2460625.2460671
23. Eve Hoggan and Stephen Brewster. 2007. New parameters for tacton design. InCHI '07 extended abstracts on Human factors in computing systems - CHI '07. Association for Computing Machinery (ACM).DOI:
24. Dandan Huang, Melanie Tory, Bon Adriel Aseniero, Lyn Bartram, Scott Bateman, Sheelagh Carpendale, Anthony Tang, and Robert Woodbury. 2015. Personal Visualization and Personal Visual Analytics.CG&A(2015).
25. Jessica Hullman and Nicolas Diakopolous. 2011. Visualization Rhetoric: Framing Effects in Narrative Visualization.TVCG(2011).
26. Samuel Huron, Yvonne Jansen, and Sheelagh Carpendale. 2014. Constructing Visual Representations: Investigating the Use of Tangible Tokens.IEEE Transactions on Visualization and Computer Graphics20, 12 (dec 2014), 2102–2111.DOI:
http://dx.doi.org/10.1109/tvcg.2014.2346292
27. Hilary Hutchinson, Heiko Hansen, Nicolas Roussel, Björn Eiderbäck, Wendy Mackay, Bo Westerlund, Benjamin B. Bederson, Allison Druin, Catherine Plaisant, Michel Beaudouin-Lafon, Stéphane Conversy, and Helen Evans. 2003. Technology probes. InProceedings of the conference on Human factors in computing systems - CHI '03. Association for Computing Machinery (ACM).DOI: http://dx.doi.org/10.1145/642611.642616
28. Yvonne Jansen and Pierre Dragicevic. 2013. An Interaction Model for Visualizations Beyond The Desktop.IEEE Transactions on Visualization and Computer Graphics19, 12 (dec 2013), 2396–2405.DOI: http://dx.doi.org/10.1109/tvcg.2013.134
29. Yvonne Jansen, Pierre Dragicevic, and Jean-Daniel Fekete. 2013. Evaluating the efficiency of physical visualizations. InProceedings of the SIGCHI Conference on Human Factors in Computing Systems - CHI '13. Association for Computing Machinery (ACM).DOI: http://dx.doi.org/10.1145/2470654.2481359
30. Yvonne Jansen and Kasper Hornbak. 2016. A Psychophysical Investigation of Size as a Physical Variable.IEEE Transactions on Visualization and Computer Graphics22, 1 (jan 2016), 479–488.DOI: http://dx.doi.org/10.1109/tvcg.2015.2467951
31. Vivek Kant. 2015. Extending the Repertoire of Activity Theory in HCI: N. A. Bernstein and the Role of the Body. Interacting with Computers28, 4 (jul 2015), 479–500. DOI:http://dx.doi.org/10.1093/iwc/iwv019
32. George Kelly. 1955/1991.The Psychology of Personal Constructs(second ed.). London Routledge.
33. David Kirsh. 1995. Complementary strategies: Why we use our hands when we think. InSeventeenth Annual Conference of the Cognitive Science Society. Lawrence Erlbaum Associates Mahwah, NJ, 212 ˝U217.
34. Gregory Kramer, Bruce Walker, Terri Bonebright, Perry Cook, John H. Flowers, Nadine Miner, and John Neuhoff. 1999.Sonification Report: Status of the Field and Research Agenda. Technical Report. Santa Fe: The International Community for Auditory Display.
35. Stacey Kuznetsov, George Davis, Jian Cheung, and Eric Paulos. 2011. Ceci N’Est Pas Une Pipe Bombe:
Authoring Urban Landscapes with Air Quality Sensors. InProceedings of the SIGCHI Conference on Human Factors in Computing Systems (CHI ’11). ACM, New York, NY, USA, 2375–2384.DOI:
http://dx.doi.org/10.1145/1978942.1979290
36. Astrid Twenebowa Larssen, Toni Robertson, and Jenny Edwards. 2006. How it feels, not just how it looks. In Proceedings of the 20th conference of the
computer-human interaction special interest group (CHISIG) of Australia on Computer-human interaction: design: activities, artefacts and environments - OZCHI '06. Association for Computing Machinery (ACM).DOI:
http://dx.doi.org/10.1145/1228175.1228236
37. Lian Loke and Toni Robertson. 2011. The lived body in design. InProceedings of the 23rd Australian
Computer-Human Interaction Conference on - OzCHI '11. Association for Computing Machinery (ACM).DOI: http://dx.doi.org/10.1145/2071536.2071565
38. Laura Malinverni, Edith Ackermann, and Narcis Pares. 2016. Experience as an Object to Think with. In Proceedings of the TEI '16: Tenth International Conference on Tangible, Embedded, and Embodied Interaction - TEI '16. Association for Computing Machinery (ACM).DOI:
http://dx.doi.org/10.1145/2839462.2839477
39. Andrew Manches and Sara Price. 2011. Designing learning representations around physical manipulation. In Proceedings of the 10th International Conference on Interaction Design and Children - IDC '11. Association for Computing Machinery (ACM).DOI:
http://dx.doi.org/10.1145/1999030.1999040
40. Gonzalo Gabriel Méndez, Miguel A Nacenta, and Sebastien Vandenheste. 2016. iVoLVER: Interactive Visual Language for Visualization Extraction and Reconstruction. InProceedings of the 2016 CHI Conference on Human Factors in Computing Systems (CHI ’16). ACM, New York, NY, USA, 4073–4085.DOI: http://dx.doi.org/10.1145/2858036.2858435
41. Maurice Merleau-Ponty. 1965.Phenomenology of Perception. London: Routledge & Kegan Paul.
42. Meshu. 2014. website. (2014).https://meshu.io/
43. Jin Moen. 2005. Towards people based movement interaction and kinaesthetic interaction experiences. In Proceedings of the 4th decennial conference on Critical computing between sense and sensibility - CC '05. Association for Computing Machinery (ACM).DOI: http://dx.doi.org/10.1145/1094562.1094579
44. Brian Moore. 2013.An Introduction to the Psychology of Hearing. BRILL ACADEMIC PUB.
46. Keith Nesbitt. 2000. A classification of multi-sensory metaphors for understanding abstract data in a virtual environment. In2000 IEEE Conference on Information Visualization. An International Conference on Computer Visualization and Graphics. Institute of Electrical and Electronics Engineers (IEEE).DOI:
http://dx.doi.org/10.1109/iv.2000.859802
47. Chris North. 2006. Toward measuring visualization insight.IEEE Computer Graphics and Applications26, 3 (may 2006), 6–9.DOI:
http://dx.doi.org/10.1109/mcg.2006.70
48. Sandra Pauletto and Andy Hunt. 2009. Interactive sonification of complex data.International Journal of Human-Computer Studies67, 11 (nov 2009), 923–933. DOI:http://dx.doi.org/10.1016/j.ijhcs.2009.05.006
49. Claire Petitmengin. 2006. Describing one’s subjective experience in the second person: An interview method for the science of consciousness.Phenomenology and the Cognitive Sciences5, 3-4 (nov 2006), 229–269.DOI: http://dx.doi.org/10.1007/s11097-006-9022-2
50. Purvi Saraiya, Chris North, and Karen Duca. 2005. An Insight-Based Methodology for Evaluating
Bioinformatics Visualizations.IEEE Transactions on Visualization and Computer Graphics11, 4 (jul 2005), 443–456.DOI:http://dx.doi.org/10.1109/tvcg.2005.53
51. Edward Segel and Jeffrey Heer. 2010. Narrative Visualization: Telling Stories with Data.IEEE
Transactions on Visualization and Computer Graphics16, 6 (Nov. 2010), 1139–1148.DOI:
http://dx.doi.org/10.1109/TVCG.2010.179
52. Tobias Skog, Sara Ljungblad, and Lars Erik Holmquist. 2003. Between aesthetics and utility: designing ambient information visualizations. InIEEE Symposium on Information Visualization 2003 (IEEE Cat.
No.03TH8714). Institute of Electrical and Electronics Engineers (IEEE).DOI:
http://dx.doi.org/10.1109/infvis.2003.1249031
53. Moritz Stefaner and Susanne Jaschko. 2015. Data Cuisine. http://data-cuisine.net/. (2015). Link visited Jan. 2017.
54. Simon Stusak, Jeannette Schwarz, and Andreas Butz. 2015. Evaluating the Memorability of Physical
Visualizations. InProceedings of the 33rd Annual ACM Conference on Human Factors in Computing Systems -CHI '15. Association for Computing Machinery (ACM). DOI:http://dx.doi.org/10.1145/2702123.2702248
55. Dag Svanæs. 2013. Interaction design for and withthe lived body.ACM Transactions on Computer-Human Interaction20, 1 (mar 2013), 1–30.DOI:
http://dx.doi.org/10.1145/2442106.2442114
56. Faisal Taher, John Hardy, Abhijit Karnik, Christian Weichel, Yvonne Jansen, Kasper Hornbæk, and Jason Alexander. 2015. Exploring Interactions with Physically Dynamic Bar Charts. InProceedings of the 33rd Annual ACM Conference on Human Factors in Computing Systems - CHI '15. Association for Computing Machinery (ACM).DOI:http://dx.doi.org/10.1145/2702123.2702604
57. Faisal Taher, Yvonne Jansen, Jonathan Woodruff, John Hardy, Kasper Hornbaek, and Jason Alexander. 2017. Investigating the Use of a Dynamic Physical Bar Chart for Data Exploration and Presentation.IEEE
Transactions on Visualization and Computer Graphics23, 1 (jan 2017), 451–460.DOI:
http://dx.doi.org/10.1109/tvcg.2016.2598498
58. Alice Thudt, Dominikus Baur, Samuel Huron, and Sheelagh Carpendale. 2016. Visual Mementos:
Reflecting Memories with Personal Data.TVCG(2016).
59. Nina Valkanova, Sergi Jorda, and Andrew Vande Moere. 2015. Public Visualization Displays of Citizen Data. International Journal of Human-Computer Studies: Special Issue on Transdisciplinary Approaches to Urban Computing81, C (2015), 4–16.
60. Tibert Verhagen, Bart van den Hooff, and Selmar Meents. 2015. Toward a Better Use of the Semantic Differential in IS Research: An Integrative Framework of Suggested Action.Journal of the Association for Information Systems16, 2 (2015).
61. Pierre Vermersch. 1994.L’entretien D’explicitation. ESF.
62. Pierre Vermersch. 1996.Pour une psychophénoménologie. Expliciter no 13.
63. Julie Wagner, Mathieu Nancel, Sean G Gustafson, Stephane Huot, and Wendy E Mackay. 2013.
Body-centric design space for multi-surface interaction. InProceedings of the SIGCHI Conference on Human Factors in Computing Systems - CHI '13. Association for Computing Machinery (ACM).DOI:
http://dx.doi.org/10.1145/2470654.2466170
64. Bruce Walker and Michael A Ness. 2005. An agenda for research and development of multimodal graphs.. InProc. of the International Conference on Auditory Display (ICAD). 428–432.
65. Colin Ware. 2010.Visual thinking: For design. Kaufmann.
66. Wesley Willett, Yvonne Jansen, and Pierre Dragicevic. 2017. Embedded Data Representations.IEEE
Transactions on Visualization and Computer Graphics23, 1 (jan 2017), 461–470.DOI: