t-<(
__.
LL
en
t!)
z
__.
0
a::
A
a.
a..'
8
Gd.
E:.
e
f
{,( f:)
F(~P)
f5Ct)
. f,,.,..
~O;oo'IC
~(t:-)G(l.J)
j
(~)-/..(T)
H(,.,)
~(T)~
H
.ff...l
!e;,"'
1
.e
N
1.f
v
X
t
t
(
1
l
1
'
)
(
)
t
(
( 1
)
1
(
"
1
( 1
(1
t
(
1
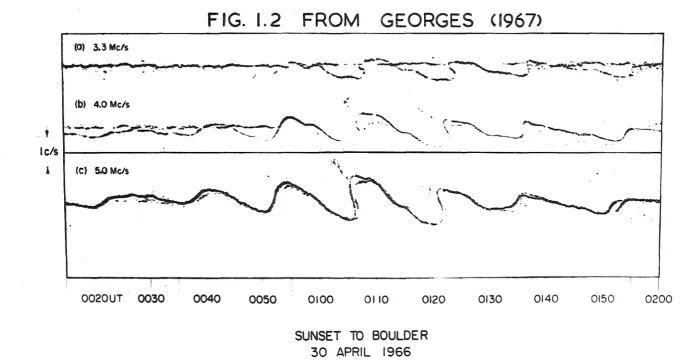
FIG. 1.2 FROM GEORGES <1967>
--
.
-~.. ---
...-w
--- "" vx;- I{ o . . . + -... ..,.. -~- ~- ~-,
...__ ' ...._ ... -...-- .... ~-~-~~~--~~____... '- • ,... - -... ...___
.,
~·--...."
:-.
.
~-
~._ ~'~- ~~· ~-·
"
..
--
~
.
,.
~
,...,_
~-·,.---~
\--
~---...___r
0020UT- 0030 0040
0050
0100
0110 0120SUNSET TO BOULDER
30
APRIL 1966
0130 0140 0150
Figure 6-13a. Dopplet' record of small traveling disturbances (figure courtesy of D. M. Baker, ITSA).
[image:37.844.69.758.113.473.2]450
400
t
-
::E
~
350
-
t-:I:
0
300
w
::s:
260
200
J..300
JICAMARCA-
PERU
JANUARY 10, .1987
X X X-LOG
10N (electrons/ems)
1400
1500
TIME
1900
1700
(75°W)_..
> '
1800
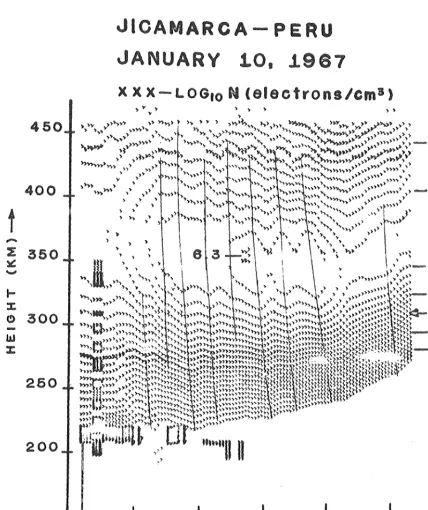
Figure 7-3. Observations of wavelike disturbances with thl·
Jicamarca radar (figure courtesy uf D. L. Stl'rling
and R. C.)hcn, ITSA).
FIG. 1.3 FROM GEORGES <1967>
[image:39.639.86.515.142.653.2](
\'~~" MHz 3·2MHz 3·1 MHz
TRANS· MODUlAIDR ... REFERE--N:E
~;..
DE-
/RECEI
R
\
tvODULATffi
MITTER
,
,
\_]
J
II'\'"
":"
5·5 MHz.
L 1!'---.
LOCAL OSC
'
-·
lOOkHz
SU Hr PUL:£5
100kHzTRIGGER
IO
LLATOR A~IPUFIERGEN.
l
'
"'~-' y,.
1
TRIGGER
'
c.
R.
0.
1
' GEN.
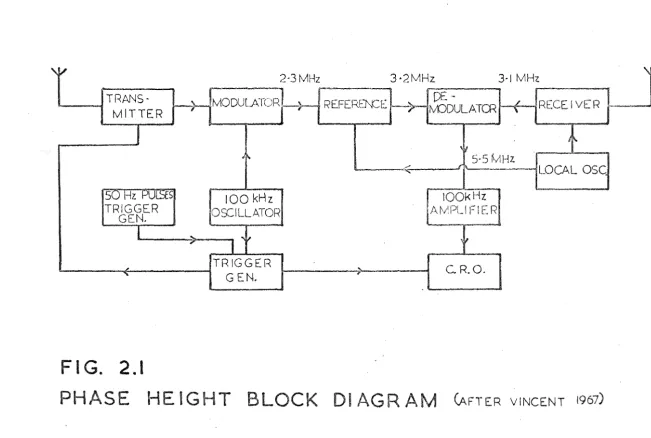
FIG. 2 .I
[image:45.846.73.725.76.514.2]0
a:
0
trl
a:
I-I
C)
w
J:
w
(/)
<(
I
a.
•
F
lG* 2.3
ASE
FROM
TRANSiviiTT
OSCILLATOR
'-V
-'~-,
R.
F.
AMP.
R. F.
AMP.
JI
ATTENUAlO<
'
~RELAY]
G
! - - ) -
M! XER
+
LOCAL OS::.
t
'
MIXER
-.
....
RECEIVER
f -;.
l
#
LIMITING
DIFFERE-AMP
NTJATE
+
FLIP-FLOP
1
~l
LIMITING
DIF
RE-
'
'
AMP.
NTI ATE
I
~.
INTEGRATE
C.R.O.
;f5
0
N
.
l?
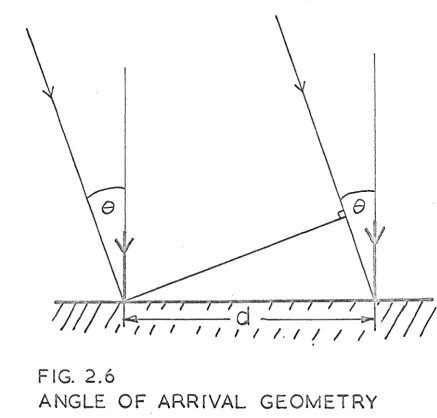
FIG. 2.6
[image:53.597.66.503.257.675.2]v:ave
)
f'
1
t
\
!I
\v
'
V'
NORTH CENTRAL
TX
RF.AMP.
R.
F.
AMP. TRANS~MITTER
t
JLOCAL OSC.
...
t
I
I
MIXER
MIXER
i'
t
LIMIT lNG L1 MIT lNG
'
AMP. AMP.
t
-t
DIFFEREN-
D!FFEREN-TIATE TIATE
t
I
I
r
\..II
FLOP I HEIGHT TRIGGER
·GATE GEN.
+
,I
I
Dl REN- FLIP-FLOP2
TlATE
t
I'
r
PULSE STRETCHER
t
CHARY RECORDER
Fl . 2.7
c'
"
· Fl
2B
Vari
t
~
100
"'
y
c(i,;E
-12v
-12v
!OOpF
!OK
(C") __.__
IOJVFT
-
-R ~~,
12v
T
c.
. -12v -12Y
-12v
-12v
-(2vIK
101<.
IOK
lOOK
<
5J<6
!OK
...,.
scr
•
o:t" more
will
1
8. d
..
1
t~ 'W(1
)
U~36Sre
s
p
. t
(1
)
ana~
,
\lSUas
sea
(normal or
v,
=
a,
C-o:;. (w
t
+
¢
/2-)
"'1
V:z..
-
~
2-<--0> (
u
t- -
tP
I
-z.)
¢
=
21Tc.l
5-&:..f\.e
=---~ "
..
-::\
t
v
2- ::::.~ ~r-
cos. ( wt
~
1 ( , -
cPri-J .. )
,...::::,
t
II
V
V, ::::
t:\1eos (
l4't
+?,fa)
+
A2.c.os(t..:>
t-+
7f
+
P£/
2 )V
~
=
a,
~
(
&.>t -
p,
/2- )
+
v...'1-
(AY'.j {t..:>t
+
If -
cfz/2-)
-
~
v
.Sit18
/\
t
t
"
8
e+dB
P{B)dB.
V
1-vz..
!+1\
, =
z. ,;::P(e)
cJe
-11'
+1t
V, •
v.
=
f_.,.
P(e)
c.o~
(>
de
e
.,..1(
1
p(e)
c.o~ (~
s<Ae)
de
-
f"p(e)
de
:.
-n
s~e=e
-t1f
Ji\
P(
e)
cos (
.:tn
~
e)
c1
e
+~
j
P(e)
ae
-11
AERIAL S
C:i
North
E
,,
)\T
Tx
3
0~---~~---~
I
co
c
LATI
N
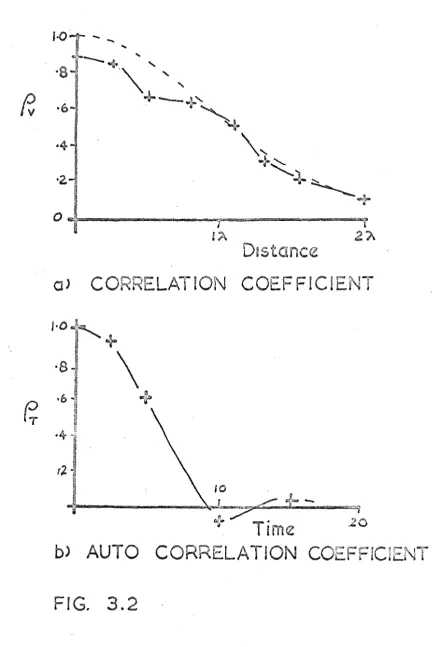
COEFFlC!
~'\jTI ' i
1·0
+
•8
\
~
·6
+
·4
,~,
10
-
"
.
2
1m
b)
AUTO
co
ATION COE
,,_l
[image:71.598.71.504.125.773.2]1
)
( 1
) ..
~t
-f
"
"
(1
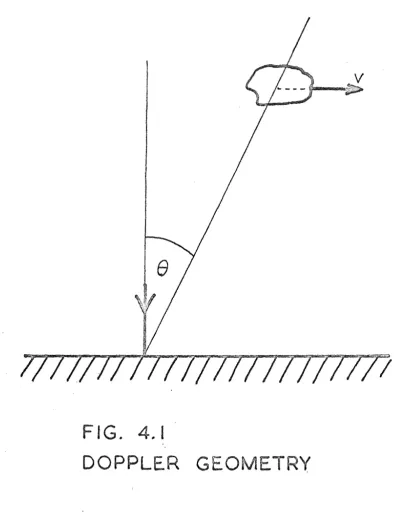
FIG. 4.1
[image:77.598.94.489.204.724.2]..
~I
I
a..
COS.(_
1/
X- &...:>1-t.) -
-(;A 1
ho
k
I..
I
k'x-
w'e
t
(
)
h.,::::
tOO~
I
k :::::.
0· I b..;1X
·e
1
I·5
a'=
0·1 km
x e
5
"l5
,
a =0·625km
{;~
~---~---~
-1
. X
8
10
.L5
a=
I0·9
km
[;-~
-5
-~
5
X 8
210.20
5
~
~20
-10s
FIG.4.2
-20
ANGLE OF ARRIVAL 8 AND
I
a=
2·0 km
[) IS;-l_ACEMENT FROM OVERHEAD
X
(kM)FOR THE LAYERS
SHOWN IN FIGURE 4.3
(
H
H
1
·~
0·1
a'=
0·1 km
Lll-l
l
//
\~.
f-....,..
...
,
.
- 0·1
.J-...'
"
I
1· 0.,
,.
::..'
....a
=0·95
km
L\Hj
.. Jl
\
....
t~I
- 1· 0
Fl
CALCULATED PHASE HEIGH
0·6
cf=0-625 km
bH
I
If
\\
/;:..:::.r-
~\ \
\
\.
- 0·6
~
,_y-
~'
~
I2·
o,
a=
2-0
km
I
,1
/ I
I
,!).
s
II
I! /
- 2·0
height 100km
wavenumber
0·1
km
amplitude a'
,;
I I
\
.
t--7"-A
A
-
'
)~..
'
-
r"r
=
ho
ctl.*'
-
.,n,.,
ol
)('1.Ct'i.
t:
"
,
I\
1· 0 5 ,
~a=·1 km
1·5,
a'=·625km
1· 2 5
1'
A
1·0
i I
\
t~A 1· 0 I
0·7 5
I
1:
1/
"'-0 9 5
4
1
4
- ·95 k
3
.I
II
Jill
'
3
i
I \
0=2·0k
t
2
t
A
2
A 1
1
I
Ill
lUUIH
t~0
0
Fl
4.
)
b)
e)
re
byas
to crtlculn
as1.
~
_ v(t)
~
e
(t)
cit
eLt:)
may
from
cting
c<[t)
d
ly ..
'fhus
a. of'au / .
OCt
~'-'e
g
the
as a
thif; mt~'>.'if
a
"'(~)
p(i;)
ing
-v{t)
as
t
' oc..
/->
aerials,A
le
(>{t)
t
d
ion
t
..
dH
-({f)
(
l
A
on
..
l
North
LA
:I:
DIFF
I
"-.ll •Central
I I·..,
. I I
'\8 I
West
=t:
AS
LO
OCK Dl
on
0
C(
0
u
UJ
CJ::
r-J:
(.!)
w
:r:
UJ
(/)<(
:r:
0..
I I,
"
'
"
Jet
" :>/
:z
r::l/
t
1.\l IZ
:> I oa
,' lj I"
"
II
'
'
'
I
1
I I I
'
~'
.... .... I)
"
•'
I I ( D I 0 .' (ft •, Lll I f.>-j...t
<
I
J) Ill(
<
2 I 0 QI
--1 ~>-1 t: I VI 0 II :;, \j:
z
'
-' .tu
"
I/
"
II
,
t
i
'
'
II I I I' I I
'
'
I'
I"'
"'
II I I I
'
'
'
I,
I I•
,
,
I'
'
....'
I,
, ,
I .L I,
,
£"
0(\!
-' -'
)
•'
I
I
I
I
I
I
,'
t
l
A
..J
<(
>
-0
w
0
~-~-~
-~-~-~~_:--~
-E---'
·~
-4,)
-a
1000
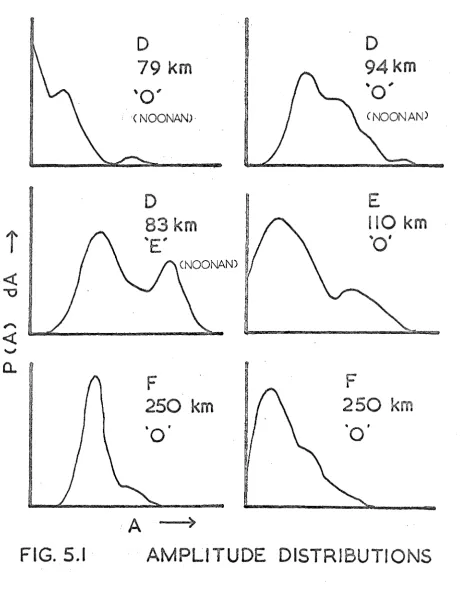
D
D
79
km
94km
\0'
"'o'
'(NOONAN>· <NOONAN)
D
E
83km
110 km
i
"'E"
"'0'
<!
-o
,...
<(
...,.;
a.
F
F
250 km
250 km
·o.
·a'
A
>
[image:104.598.64.525.127.722.2](1
(1
t
(\J
Lti
0
(1
(
)
'11
or7lot
N
'f+o(Jly
fl.o(f<.
YKo-Kl'(N
t
(
LJ
rlo
2
z
a),
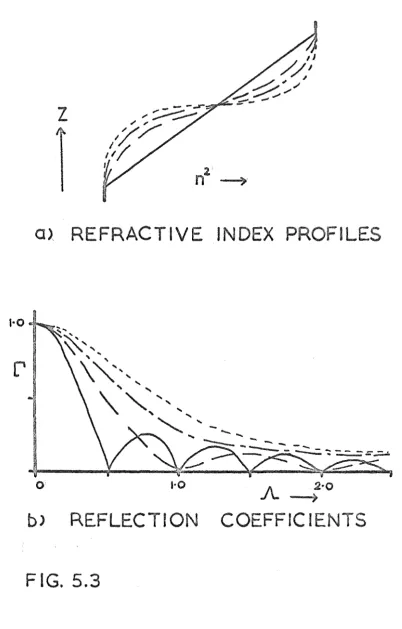
REFRACTIVE INDEX PROFILES
0 1·0
A
2-o
REFLECTION
COEFFICIENTS
[image:111.597.107.509.78.707.2]1
t10
(
(i
( 1
) "
1
\
F lG. .
SC
IN
-.
F,
1-..
,_
,.
r"e
t
( 1 ' ) ~
..
a.
s
'
(1
\,f
can
{ Ro/1.
'--c.
1(0o-o
e
-
-
a-"1
?>
-
-
•
l
R"'
I
l- o-~e-(..."1:.. ~')(
-"l-( )
··~
(
(1
).
(
i
13
0 .. 1
1·0
1'
f
·5
+\
+
,-4-
/
+
0+---~~---r----~----~~
/·0
t
p
·S
60
7o
t?D
'to
lt>O0~----~---~----~----~
60
7D
eo
9o
too
~
{ km)
-=p-FJG.
5·5
.A
0
-A~-CORRELATION
or
)
1
A
'0'
t •
h
60
70
90
100
IIOKm
(
.
60
70
80
90
100
I!Okm
I G.
.I
BLOCK-
I GR
FOR DIFFE ENTIA
PHAS
X
RIMENT
RF
Ml
I l t iL
p
/F
C
IS
-~
~
IIN
0
(\J
0
0
0
cO
C\1
.
'\()
•
C)
~
(t)
T
t,o
tuJ .,
jp
j {
t--• )
-t
UJ
d'
F('-")
,G(w)
H((,..:>)
J-1 {
t..>)
lt(l:)
I
G (
w)
I
"
I
G (
LJ)/
1-l(w)
"
ORDINARY
(
a>
OVERLAPPE
\VOLUIVIES
r;{
ATTERING
\7{
X
-.t:-~7
b> VOLTAGES
[image:142.598.130.490.112.772.2]t
1
·- '"""
::~
1
0
1"
160~~~~----~----~----~
.
Q
0qo~»
'/80°
2.10°
360
qo
10
PHASE DIFFERENCE
o
D.A.E.
+
D.P.
E.
60~~~--~~--~~~--~~~
0
500
N (
e
J /cc.)
-;a.1000
110
d
N~S
PHASE Dl FFERENCE
- .• ,<-= ~ ~~~ ... . ~ . . . . -: -
=---~ =---~·'· • • !' ... 0
60
80
HEIGHT"' KM
FIG. 6.8b
ICO
N.ZST
12·30
12·35
12•40
[image:153.606.103.516.75.744.2]E-W PHASE DIFFERENCE
60
80
100
H :_: I
G
H
T '""
KM
FIG., 6. Ba
N.Z.S.T.
12·30
12·35
12~0
1
1
)
..
..
7
)t)-~1..£
4; , 2
j._2.
-+
4-1\
2.-G
+
1 10
.£_/lOb-(
(
/._:::=. (
00~
t
0
r:
n.
j , '"J
' · f>.') r; .
' ·'
( , ,)
r . n
(; . f
·'
. r. r, 0 0 (. . "
r . n
0 . (}
() . C
.) . l
f) . (
''·"
c. r
''"'
o. o
1) . 0 c. n
t . t:
• r
c . r
kii
c 0 0
c. o
c. r
0 . o
e, . r.
o. " c . n
r . o
o. n c. n c. n o. c o. c o. o o. r o. o c. c o. n
~ . o
c . o o. r fJ . O
o. o
o. c o. o o. o o. o r . o o. o
(J . (J
o. c c. c
o. n
u. n
C . f.' o. 0 o. 0 o. o
o. n c . r, OoO o. o o. n o. o
o. r
1') . ("1
o. o
c . o
c. n o. o o. n . n . n . ;
r; . o
r . ')
: n
; . v . o
r.n
~
.
~·... : 0
r . n
C o J
r· . ~ ·'
- . o
. n
. o
, . n ~ ·"'
• n
.. o
c . o
':2
.. o
() . 0
o. n
o. o n. r ,). o
v. o o. o
o. o
'J , f;
J . 0
c. o c . o . n
)·II 1·1
r , ;
c . ~ r .
n . ~ · " ~ : ~' r · ' ?>"
n .
r .• r . r
c . 1 0 . o
r . u
~ . ,
r .
( .
~ 0
t~F'J. G~:
n. o .
~ . 1') ,
" . C 4
r
f) . n
o. c ,.. ,, r: .
6:8 r' :o ,. 0
(1 , r'l 1"1 :
2 :~. :"' n •
o.o ,( ,...: )
n. o . r " . ·. o . n r . c ' r
") , C . c :r
lj , t:' · "' , r
o. ('l 1 . r ,., .
o. o r) . ( r . r1 0 . o r . 0 r .
g : ~ ;~ : ~ ~ .
t') . () (J . v 0 . J o. o ,.. . f) ~" . 0
I! . 1"1 . r. ,.. . r
b:g ~ . r
C . o t . n
n . o t . C:
o. o r . c
~ . o L . 0 r . o . 0
o. o . r
0 . 0 . L 0 .o c . ~
c . o o . o
Q . f') t . (
r-, . o r . r
c. o o. o ( . c r . :"..
o . o . n
'1 . 0 o. c
3:8 ~. : ~
o.o {\ . (' n. o o.o
n . o f"' . 'l Q . (J . ()
o. o n .
~.-Q . O 0 . 0
" · 0 l . (1
o. o ( · "
o. n n . r
o . o ,. . r
o . o c.o
0 . 0 r . C'
0 . 0 r) . IJ
l"l n . r. r .
n:
n. r.
0 0
r . n .
r . o C o l
o . r
• f
('l:r
~ . o
. L
r . r
(} . 1·
r .
r.-n. •
o .
~ · "
1·5 1·8
0 ~
,.. : ~ . r. 0:{ . c . r ' . ' ;, o. c
0 : ~
c : c
':) . f
o .r
c . r o. r
0
0-V. l
~ . r
,. .c
, . c ' . c 0 . ('
' .r ' . r
" . (
·'
. r . c
n .r
0 · '
'.-0 r
v:c
0 . (
c .c
·' . c ~ - ~
r:
c- . '·c 0
~< r:
c .
r · "
c 0
r .
(' , (1
('
...
0 · '
c 0
r .
r . '
' ·'
c. . r
C. "
~ :~
c ·'·
r . C
r . c
(I . ~
l • .
c. o
( . '
( . c
r •
-c .(
t· . o
c 0
c . r
. n
' .r
r . r r. . r
r . n c . l'
' ·'
c •'
' 0 0
r · '
(
..
~ 0;
:r - ~
.,
:r
~ - ,.
r . :,
. n • r . c
, . (
(. . C
. r.
c = ~
. r;
r, . o c. c - ~
, :~
o . r
"· C . c
•·' . c
- ~
. c
0 . 0
:f
. c
c . r " . n
·' . (
. c
" .o
( , (';
' .r . ( . r
' · ~
0 •
0 • r
c. J
r .
r . c
r . •
o J
( . o
r. c
r . ~
c 0 )
' ··
r.r
t: . Q
c. :')
o. o
c. o
0 . 0
r . o
~ . o r. . o c. o
n . o
~ ·"
r . o r . o
r. . o
c.'
r. . l 1') . 0
c. c .
C . l')
c.o
~ - 11
c. J
r. . o o. o
~ - ~
. n . r .
(<
.-:;
>
&: ~
r . r.
t . r;
( , t;
r · '
~ - ~
·'
n. c
r . ':'
r . c C• . fl
~ : r
r· .c
0 . o
':J . C
c . r
'·"
. ~·'
o. r
r . n c. r
•) . c
~ - " . o
c . r
c. (
('1 . ~
- . 1
6 : ~ n · "
c . n
r .
( .
c.
r .
c 0
2:0 2·2 l ·+ 2·8 '5·0 3 ·S "f·O + ·5 '5 ·0 ~· S ,.0 '7·0 C·O 'f·O U>·O
1
t'
..
Exper
c>
lH·high pnwer
1puJ.sed,
H1e f're
ncy,
low
quency
r· nnd
their regions of applicAtion end obse
ional efficiency •.
:S':f\I"'T
D RIWI
E SPOFU\DIC E REGION F.:REGIONs Yes Yes Yes I Yes
-~·" -~-··-···--·~···-·-~·
t
No Yes
30"1"
Yes10%
Yes3o%
/()Yes
i ~'l-.4n
Group .tie
I
-
I
YeBI
Yes!
YesBe :i. Yes
1 Yes
50%
s
ti
1J:1G01s
(
se
)
D. /1 .• li'.
Reprinted from AMERICAN JoURNAL oF PHYSICS, Vol. 35, No.9, 869-870, September 1967
Printed in U. s. A.
Nature of Radio
Waves Reflected from an Undulating Surface
G. L. AusTIN
Department of Physics, University of Canterbury, Christchurch, New Zealand
(Received 5 December 1966)
The character of signals reflected from a sinusoidal-shaped surface is discussed with par-ticular reference to the ionosphere and an experimental verification of the essential features obtained using a model and microwaves is presented.
T
HE problem of calculating the total signal received due to reflections from a sinusoidal layer in the ionosphere is important because of current discussions about the existence of inter-nal gravity waves.1 The problem has been solvedexactly by Rayleigh2 and for a shallow sinusoidal
layer by Hewish. 3 The first of these solutions
has been found to be too complex for normal use and the second is not applicable to gravity waves several radio wavelengths high. It is evident from a consideration of the method due to Rayleigh that a large contribution to the reflected radio wave is only made from points on the gravity wave near a specular reflection. White-head* and Landmark5 have considered curved
surfaces of the type exhibiting only one specular reflection and Landmark, in the above paper, also considers the specular reflections from two plane surfaces inclined to the horizontal. A
Gaussian surface has been considered by White-head4, and Bramley6 discussed a geometry
some-what. similar to that which is described below but did not point out the effects of tl1e gravity-wave parameters on the type of fading observed.
The equation of the reflecting surface is as-sumed to be
z
= 1/J where 1/J is a periodicfunc-tion of 'X. and the time t with a mean height h
and an amplitude a (see Fig. 1). We consider specifically
1f
a sin ( h wt)+
h,1 C. 0. Hines, Can.
J.
Phys. 38, 1441 ( 1960).2 Lord Rayleigh, Theory of Sound (MacMillan and
Co. Ltd., London, 1937), Vol. II, p. 89.
3 A. Hewish, Proc. Roy. Soc. (London) A209, 81
(1961).
4
J.
D. Whitehead,J.
Atmosph. Terr. Phys. 9, 269( 1956).
J.
Atmosph. Terr. Phys. 24, 715 ( 1962).5 B. Landmark,
J.
Atmosph. Ten, Phys. 10, 288(1957).
6 E. N. Bramley, Proe. Roy. Soc. (London) A220,
39 (1953).
FlG. 1. Parameters of the layer.
where k is the wavenumber of the gravity wave
and w is its frequency. For a specular reflection,
we have
d1f/dx - x/tfl.
Neglecting a in comparison with h, we obtain cos (kx-wt) x/ah k.
This equation may be solved either graphically or numerically to give the values of x for points where specular reflections occur.
Let
kx- wt-u.,
then
cos tt
= -
u/a k2 h wt/a k2 h.The graphical method of solution is indicated in Fig. 2. It may be seen directly from this figure that if lc
<
(a h)--% then only one specular re-flection can ever occur at any one time. The condition that three specular reflections should always occur is that the straight line should justFm. 2. Graphical solution.
870 G. L. AUSTIN
0 50 d·crn
h= 75cm
0 50 d·cm
100
100
FIG. 3. Microwave measurement 1.
FIG. 4. Microwave measurement 2.
FIG. 5. Microwave measurement 3.
touch the cos u curve in two places. This condi-tion is given by u
=
tan u which immediately gives that three or more specular reflections will always occur when k> (
4.49/ a h) '12. If k liesbetween these limits then the records of ampli-tude against time should show deep fading with several reflections and shallow fading with only one reflection.
In order to check this theory, a model of an ionospheric gravity wave was constructed. It
consisted of a piece of hardboard approximately 250 X 100 em bent so as to form an approximate sinusoidal surface with a wavelength of 100 em and an amplitude of 5 em. This was supported on a wooden frame and covered with aluminium foil. A 3-cm microwave generator and detector
h=125cm
~ .\~j..
..
-
~
..., ..
\·~.-· ·~
.. · ... · ·-. )
~~
I
... + • II • v'\,,w•0 50 d·cm 100
h = 150crn
0 50 d ... cm 100
t
·~ ~ ~ ~·
•
~..!
· · II / . ·
J\
c: '
··V \ 'I' \
I \
~
I \ ···'·. <1> ... ,, \ ~ f ....
c:
... ... ... ,.._
+ ... ... t I- '•
\
...
\
..
~· 'h=200cm
0 50 d-cm 100
FIG. 6. Microwave measurement 4.
FIG. 7. Microwave measurement 5.
FIG. 8. Microwave
measurement 6 .
were then set up on an optical bench to simu-late the transmitter and receiver, respectively. The limits obtained above give that for one specular reflection h
<
50 em while for three specular reflections h>
225 em. Figures 3-8 show the result of plotting the intensity received against distance along the optical bench for dif-ferent values of h in the region defined above. The heavy line represents the region of deep fading predicted by this theory. It may be seen that the results cross check as required. [image:173.595.61.526.89.441.2]Amplitude
Dist:l.'ibutiom;
Resul tir,.:_ ::.·orr. Cur·-.ratureDistributions
of aReflector*
G,.L .. AUSTIN and
J.r.tt.
TEORPEPhysics Depurtmont
University of
Ganterbur'J
·christchurch, New Zealand.
A s:Lul)le theory of focusing is discussed and ampli tuO.e prot~.0i2.::.. -;.J
dis J;:ributions are related to distributions of curvature at the re:;:-.lect,:.:..~.
'''he results are e.pplicable to amplitude distributions of radio sign-:.ls
reflected fror;:. the
ionosphere.
1
1. Intrcduction
In a :recent paper (Khastgi:r et
al,
1968) the observed a.'":lplitudes rz.:turned from sporadic E layers frequently shoy; double peaked amplj.tuC.ep::.·ob~bility &istributions. The authors su,::e;ested that th.e t1o 11e:::lcs
cotlld be duo to r,:flections from t'.N sirr:ul taneous and indeLJendent
superimposed processes. In this note we shall extend the analysis of
Yihitehead (
'\962)
who interpreted the observed fading il.1 terms offocusint;; to show tc.at a. satisfactory explanation can be obtained frcm.
2
2. Observed Distributionb
If the radio wave returned from the ionosphere is scattered from
irregularities in randmn motion then the amplitude distribution will be
the fumiliar Reyleigh (
1899)
distribution and if there is a constant specular component as well then the distribution will be that of Rice(1945).
However, man;y people have observed reflections from the D, Eami F regions and obtained a.mplituC.e distributions which are not very
similar to those above. The major features w.i"ich require some
e;.."?lana.-tion are the occasional occurl'ence of distribue;.."?lana.-tions having two peaks
r.hich ue will call '1; shaped 1 and. the lo·.-1 freq~Jency of occurrence of
amplitudes of very siiall value civinc rise to an 'offset'.
~he 111 scaped' distributions have been noted by Dasgupta and
Vij (
1960)
and Kushnerevsky and Zayarnaya (1960)
for the ~, region and Khastgir et al (1968)
for sporadic· E., We have noted. 11 shapeddis-tributions from the E region. The offset, which is the dis?lacement f:.";_.::.
zero of the lower bound of the amplitude distr~bution, hasl:een previous:.y
3.
AnalysisConsider a reflecting surface having a cylindrical undulation
~~th
a
radius of curvature R and a range h from a radar(fig.
1).Following Whitehead
(1956, 1962)
simple geometry gives the width oftho area illuminated in the region of the reooivGr as
3
( 1)
where L is the width of the illulf.inated region of the reflector
assumed constant and much larger than a Fresnel zone. The distance
from the reflector to the virtual image of the transmitter is v. If we
now eliminate v from
(1)
by using the usual mirror equation we obtain 1=
2Lt
1 - hjRI
The amplitude A
1 of the signal received is determined by the area
illwLinated in the :region of the receiver and is given from (2) by
If ·we define tne norn:alized curvature h/R as f we may then write
A 2
=
11
I
1 -fl
(2)
(4)
The probability distribution of the received amplitudes is the
same as the distribution off, except that the amJ?litude probabilities
are weighted in proportion to the area over which that amplitude occurs.
This area is inversely proportional to A 1
2
and consequently
Now from
(4)
we obtain
d.A1
df
=
2
-A3
1
'
and consequently
4
(6)
(7)
5
4•
Comments on the liumerical ResultsIt may be noted that all the derived amplitude distribution::~ show
a distinct offr.et and~omparing the distributions of amplitude for
normal oistributions of f with two different standard deviations (curves
a and b'in figure 2), we see that the offset
can
be interpreted to indicate the relative spread of P'(f). If a suitable spectrum of sinusoidalatmospheric waves is considered the distribution of f is J,! shaped (fig. 2,
curVe c) but as may be seen this does not neces:w.rily produce an M
shaped amplitude distribution. Curve d in fiGUre 2, however, does lead
5 •
.Amplitude Distribution for the Second Reflection
If the amplitude, E
2
, measured at the ground of the radio wave
twice reflected from
th~ionosphere is re-defined by
6
2E
=
_.6p
(8)
where
p
is the apparent reflection coefficient, then A
2
is unity for
a plane reflector. Geomet1•ical optics similar to that of section
3
then gives
A
2
2
-1
i (
1-f) ( 1-2f)l
so that combining
(5)
and
(9)
we obtain
(9)
( 10)
The distribution of the second reflection amplitude for the normal
curvature distribution (curve a in figure 2) is shown in figure
4~7
6.
Lirni tB.tions of iha AnalysisIt may appear tha.
t
the analysis would ~l~eak down if the curved scree were 1rough1• This has been invostiga.t~d by Whitehead ( 1960) and he s::oweclthat the screen should have a polar diagram which has a reflecting. cone
"
ancle of not more than a fev1 degrees. 1'he E and F regions have been
in-vestigated byBrigga anc1 Phillips (19.50) who came to the conclusion that
this conditjon vms satisfied for radio mwelenc.;ths t,;reater than about 200m.
It is evident that the very lnrge values of arnvlitude predicted for perfect
focusinc events at f
=
1 for example will not occu1~ for the roueh screen but these have a very low probabilit _ _. due to the 1/A 2 term ir. the analysis.There is, !·.ow;;ver, a theoretical difficulty with the method in that
for cases ;;Len f is r;reater than + 1 the condition. for three or more
specular reflections to occur at the s1liJle time is satisfied (Brarr.la.ly,
1953
and Austin, 1967). It is impossible to take t}:is into account wi thou-;,
making some asstm;ptions about the shape of the screen. However,
invJ5-tigation indicates tho. t the result of neglecting the second<3.l:'Y reflections
p,...ints is to alter the 11I1lplitude distribution by a few percent.
It micht be thought that this analysis could be used in reverse to
obtain P'(f) from theroadily mea.sur€lable P(A
1). However (4) does not
uniquely define f if A
1 is known since there are two values of f related
by f1
+f
2= 2 which both. satisfy the equation. The two solutions co:crespor::6. to the cases where the focus occurs above or below grounci level and thereis no wa:y in which the ~elative probabilities maybe assigned unless P'(f)
8
7.
Conclusions'i/e have tried to show that simple geometrical o;;tics provides
"'
an explanation oft he observed characteristics of reflected rad.io 7;ave
nm~:litudes. The theory has b·JOn primarily aimed at the totally reflected signal from the ::..:; and F regions but as far as we are awn.re no
8.
References
Austin,
G.~.(1967),
Nature
ofradio waves reflected from an undulating
sur:f'o.oe,
Am.
J •.Phys.
,l2,
No. 9,
869-870.
Bramley, E.N.
(1953),
Direction-finding studies of large-scale ionospheric
h•••oe;ularities, Proo. Roy. Soc. A,
ggg,
39-61.
Brisgs, B.H. and G.J. Phillips
(1950),
A Study of horizontal irregularities
of the ionosphere, Proc. Phys. Soc .. Lond. B,
.§2.,
907-923.
Dasgupta, P. and K.K. Vij
(1960),
Statistical
ana~sisof fading of a
single downoorning wave, J. Atmosph. Terr. Phys. 18, No.4, 265-275.
Khastgir, S.R., S. Ganguly, and S. Samanta
(1968),
The double-peak
dist-ribution of the radio wave returned from the -sporadic E layer,
Radio Sci. _2, (New Series),
I•:o.6,
535-537.
Kushnerev sl<y, J. V. eLnd E. S. Zayarnaya (
1960),
The dri:ft of small scale
irregularities in the F
2
-layer, Some Ionospheric results obtained
during the I.G.Y., Ed. \,'.J.G. Beynon, 313-321 (Elsevier Publ. Co.,
London).
Piggott,
'li.l~., 'II.J.G.Be,:,mon, G.i.l.
Broim,and C.G. Little
(1957),
?2-"''meastu•ement of ionospheric absorption, Annals of the
I.G. Y.,
,.2,
171-226.
Pit;gott, W
.R. (
1960),
Discrepancies in the ionospheric absorption de(1uced.
from tho first order and multiple order reflections, Some
Iono-spheric Results obtained during the International Geophysical Year,
Rayleigh, Lord ( 1899), Collected works
j,,
495 (Camb. Univ •. Press).Rice,
s.o. (
194-5), I·,!athematical analysis of randorr, noise, Bell. Syst.Teoh. J.
1J±,
No;' 1, 46-108.10
von Biel, H.A. (1965), 1965 Solar eclipse partial reflection experiment,
CAL Re1lort No. VS-2025-P-1, Cornell Aeronautical La bora tory, Inc.
Whitehead, J.D. (1956), The focusing of short radio waves reflected from
the ionosphe1·e, J. Atrr.osph. 'L'err. Phys.
,2,
269-275 •. Whitehead, J.D., (1960), Focusing of radio
w
ves reflected from a rough curved ionosphere, Aust.J.
Pi~s.j2,
621-624.i'fl.iteh0ad, J.D. (1962), Distribution of echo amplitudes from an undulating
FIGtJ:R:B CAPTIOTS
Figure
1Geometr,y of the model considered.
Figure
2Distributions of f:
a) normal, standard deviation one
b) normal, standard deviation two
c) for a spectrum of sine waves;
P'
(f)
<411!:
(x
2
'l:f/4
2 2/
6)-i .
2
- 7t f 1
sl.n x dx
d) which gives rise to an
l1lshaped distribution of A
1
•
Figure
3
Distributions of
a.mplitu(;e,A
1
corresponding to the
distributions of f in figure 2.
Figure
4
Distribution of the amplitude, A
2
of
iilesecond
:..~ eflev;ion [image:185.595.39.515.71.503.2]h
v
[image:186.595.44.469.196.757.2]I
3~
1
0
I
FIG. B. 4
(\
/ I
[image:189.608.32.524.97.742.2]Radio Science, Volume 4, Number 1, pages 35-40, January 1969
On the nature of the irregularities that produce
partial reflections of radio waves from the lower io11osphere (70-100 km)
G. L. Austin
Physics Department, University of Canterbury, Christchurch, New Zealand
A. H. Manson
Institute of Space and Atmospheric Studies University of Saskatchewan, Saskatoon, Canada.
(Received Aprill, 1968; revised August 22, 1968.)
The irregularities that produce the partial reflection of radio waves ( 1.5-6.0 MHz) from
the D region are investigated. Experimental evidence indicates that reflection usually occurs
from localized irregularities rather than from a region of smaller scale turbulence.
1. INTRODUCTION
In recent years there has been a growing number of experiments in which medium and high frequency radio waves (1.5-6.0 MHz) are partially reflected from the lower ionosphere. One of the first quantita-tive experiments was the differential absorption ex-periment (DAE) for measuring electron number densities [Gardner and Pawsey, 1953]. These experi-ments assumed that the refractive index irregularities were due to changes in electron density and that the reflection coefficient of these irregularities could be calculated by using the Fresnel equation
R
=
(n2 - nt)/(n2 n1) (1) where n1, n2 are the refractive indices for anelectro-magnetic wave in regions of the ionosphere where the refractive index changes rapidly within one wave-length. It was then shown that the amplitude ratio of the ordinary and extraordinary components of the partial reflections as a function of height could be used to produce an electron number density profile. Gardner and Pawsey considered two main types of ionization irregularity. The first is a sharply bounded, horizontally stratified irregularity of extent com-parable with a Fresnel zone, to which the Fresnel equation clearly applies. The other type is a series of random irregularities or blobs. Gardner and
Pawsey [1953] concluded that the details of the reflection mechanism made no difference to the elec-tron number density profiles obtained by the DAE. It is very important to know more about the nature and cause of these D-region irregularities, both for
35
their possible relationship to the dynamics of the upper atmosphere and for their effect ou the DAE and other radio wave experiments. Several experi-mental and theoretical methods for investigating the nature of the irregularities are discussed in this paper. In section 3, reflection coefficients for two extreme cases are developed. In section 4, the percentage changes in electron number density required to give the observed partial reflections are found by using these equations in conjunction with measurements of reflection coefficients and electron number density profiles. A possible origin of these irregularities is discussed briefly in section 5. Arising from the devel-opment in section 3, experimental tests are suggested whereby a definitive statement can be made about the actual reflection mechanism (section 6). The consequences of these ionospheric models upon radio wave experiments are discussed in the con-cluding section.
(B, B, c, c., E, E'
'
H, N(h),P,
R,2. NOTATION
total number of blobs in the scattering region. total number o( layers in the scattering region. velocity of light in vacuo.
velocity of sound.
energy density observed on the ground accord-ing to saccord-ingle layer theory.
energy density observed on the ground accord-ing to saccord-ingle blob theory.
height of reflecting level.
electron number density as a function of height. peak power transmitted in the pulse.