The costs of single species programs and the budget constraint
Emma Moran a, Ross Cullen a*, Kenneth F.D. Hughey b
a
Commerce Division, PO Box 84, Lincoln University, New Zealand
[email protected], 64 3 768 5986
[email protected], ph. 64 3 325 3807, Fax 64 3 325 3847
b
Environment, Society and Design Division, PO Box 84, Lincoln University, New
Zealand
[email protected], 64 3 325 2811
Abstract
Despite the scarcity of funding for species conservation programs, estimation of the
cost of threatened species programs occurs in only a few countries. This paper
examines the reasons for the lack of species program cost estimates and the likely
impacts of this on conservation management. We report methodology used to estimate
cost for eleven New Zealand species programs and their estimated costs over a ten
year period. Differences between species in the costs of the programs and the
breakdown of the costs are highlighted. The estimated costs are compared with
expected levels of expenditure on each species to illustrate the existence of a budget
constraint for threatened species. The likely effects of cost of species conservation
exceeding expenditures on species conservation are examined. Annual cost data is
used together with information on rate of conservation progress to estimate time and
total cost for each species to reach ‘Not Threatened’ status.
Keywords
Threatened species, costs, expenditure, budget constraint
INTRODUCTION
In most countries the number of threatened species requiring direct management
intervention is much greater than the number that can be managed with the funding
million (1) allowed about 15 percent of the 2,400 native and endemic species listed as
threatened to be specifically targeted for management (Department of Conservation,
2004). Although most of these species are included within New Zealand’s extensive
system of reserves, some require specific intervention. A goal of the New Zealand
Biodiversity Strategy (2000) is to halt the decline in biodiversity by maintaining and
restoring viable populations of all native species and subspecies across their natural
range (DoC and MfE, 2000: 18). Yet it has been increasingly recognized over the past
few decades that funding is insufficient to maintain the growing number of species
known to be at risk of extinction (Bell, 1975; Williams, 1986; Towns and Williams,
1993; Hitchmough, 2002). Given the funding limits faced, the costs of managing
individual species are clearly important, but in most countries little attention is placed
on these costs.
The purpose of this paper is to investigate the future costs of New Zealand single
species programs and to consider the possible impact of a budgeting constraint on
threatened species management. Before proceeding some essential definitions are
required: ‘cost’ is defined as the amount of money required in order to accomplish a
particular purpose (Brown, 1993: 521); ‘funding’ is the amount of money set aside for
a particular purpose; and, ‘expenditure’ is the amount of money actually used for that
purpose (Brown, 1993: 1042 and 886). The paper is largely based on the results of
cross-case analysis of data collected from a survey conducted in 2002 of 11 single
species programs operating over the period 2003-2012. Some reasons are outlined for
why managers consider the task of estimating costs to be extremely complex and the
results are, therefore, subject to significant uncertainty. Notwithstanding this
the ten year timeframe are presented. These costs are then compared with expected
levels of expenditure to show the existence of a budget constraint for threatened
species management. The effect on outcomes of underfunding is speculated upon in
considering how the budget constraint delays the recovery of those species already
benefiting from management and, as a result, other threatened species that are still on
the waiting list. Although the total costs of a program for a limited time horizon
provide a picture of the funding that is needed in the short or medium term, they give
little indication of the commitment that is needed over a longer time horizon. To gain
some idea of a program's total cost over time, the average estimated costs of the
outcomes of management for a species are examined. These costs are compared with
average expected expenditure to indicate the extent to which a budget constraint may
reduce the cost-effectiveness of threatened species management and so, ultimately,
increase the level of financial commitment that is needed in the long-term.
Lack of attention to costs
Beyond countries like the United States and Australia, accurate estimates of costs of
programs are not, as a rule, included in either the preparation of recovery plans or
applications for funding. Furthermore, cost does not generally appear as a factor in
systems for determining a species’ priority for management and analysis of the
cost-effectiveness of management is rarely conducted. In New Zealand, the species priority
ranking system that is used takes into account non-financial considerations, such as
threat, vulnerability, and taxonomic distinctiveness, and funding decisions for
cost omissions may be that it requires the use of further resources, it is subject to risk
and uncertainty, and it can create expectations of funding. A more basic reason may
simply be that the importance of cost is not recognized by conservation managers or
policy makers. Despite these reasons, information on the costs of programs is likely to
be essential to the success of attempts to gain sufficient funding as it provides funding
agencies with a more realistic understanding of the level of commitment required.
Applications for funding that lack specific and detailed cost information can be more
easily dismissed or underfunded, whereas applications that include such information
must demand more serious attention. Cost estimates are also required for forecasting
the effects of different policy goals, and for cost-effectiveness analyses. On a more
fundamental level, such information is crucial for efforts to achieve greater
effectiveness and efficiency in use of conservation resources. In threatened species
management there has been some analysis of patterns of expenditure (for example
Simon et al. 1995; Metrick and Weitzman, 1996; Restani and Marzluff, 2001), but
only a handful of examples of research involving costs of individual species (for
example Doerksen et al. 1998, Wilcove and Chen, 1998; Main et al. 1998; Fairburn et
al. 2005).
METHODS
Department of Conservation (DoC) managers of single species programs were
surveyed to gather cost estimates because, unlike the United States Fish and Wildlife
Service, the DoC does not, as a rule, include estimates of costs in its recovery plans. A
pilot survey was conducted of the managers for three single species programs to show
Based on this experience, the Department supplied general species information, such
as habitat area required by a species and the types of threats facing a species, and data
on past expenditure and its associated outcomes. Future cost and expenditure data and
its possible outcomes, however, were at the discretion of regional managers because it
was not information held by the Department, and it was expected that it would be of
limited value to the Department and not of interest to the general public (A. Ross,
personal communication, August 12, 2002). If a request for data on the future costs
and expenditure for a particular species program was declined then an alternative
program was chosen, preferably for a species from the same taxon. Although efforts
were made to choose an equal number of species from each taxon, this was
problematic because there are only seven native terrestrial mammal species and four
native amphibian species in New Zealand. As well, all requests for future cost and
expenditure data for the costs of programs for reptiles or freshwater fish were
rejected. Furthermore, a disproportionate number of recovery programs exist for avian
species. In general, the following set of criteria, in general order of importance, were
used to select programs for this study:
1. Species programs for which there was a draft or published recovery plan.
2. Programs for species that are representative of different taxa.
3. Programs for species within each taxon that require different habitat types.
4. Programs for species that occur within one or two conservancies, rather than
multiple conservancies.(2)
5. Programs for species that have a high threat classification, such as ‘Nationally
Critically Endangered’, ‘Nationally Endangered’, or ‘Nationally Vulnerable’.
7. Species programs that are of particular interest for research.
The Species Managers Survey was eventually completed for 11 single species
programs (listed in Table 1), which despite the use of selection criteria, covered
almost all of the set of possible programs. It also represented about 24 percent of the
recovery plans developed at the time, even though some of these had yet to be
implemented.
Table 1 11 single species programs
Taxon Common name Scientific name
Vascular plants Pittosporum patulum Pittosporum patulum
climbing everlasting daisy Helichrysum dimorphum
Terrestrial invertebrates Stephens Island ground
beetle
Mecodema costellum
costellum
flax snail Placostylus ambagiosus
Amphibian Stephens Island frog Leiopelma hamiltoni
Terrestrial mammal South Island long-tailed
bat
Chalinolobus tuberculata
Avian species black stilt Himantopus
novaezelandiae
kakapo Strigops habroptilus
North Island kokako Callaeas cinerea wilsoni
mohua Mohoua ochrocephala
The outcomes of management for a species were evaluated using a continuum based
on the New Zealand Threat Classification System (Molloy et al. 2002). Under this
classification system, a species is assessed using a range of status and trend criteria as
being in one of seven threat categories (listed in decreasing order of risk): ‘Nationally
Critical’, ‘Nationally Endangered’, ‘Nationally Vulnerable’, ‘Serious Decline’,
‘Gradual Decline’, ‘Range Restricted’, and ‘Sparse’. In the survey, managers started
with the species’ existing classification and identified the species’ possible
conservation status category for each year of the time horizon using the NZ Threat
Classification System. They then selected a number from within the range on the
continuum for that category reflecting the extent to which the species was predicted to
fit that category’s criteria, assuming the program is fully funded (3). A species’
conservation status was used to quantify outcomes, rather than more common
measures, such as a species’ probability of survival over a certain timeframe based on
population viability analysis, because managers were more familiar with the system
and species’ existing classification gave them a definitive starting point. Applying the
classification system to a continuum allowed managers more flexibility in
determining a species’ status than the seven categories, and through the use of a
quadratic scale, change in the status of more endangered species was given a higher
value (Cullen et al. 2005).
The annual cost data used in this research were derived from the sum of the managers’
estimates of the annual costs of the actions needed to be taken in order to achieve each
objective developed for a species as stated in its recovery plan. The costs of managing
other activities undertaken by the Department were generally not included because the
intention was to examine only the additional costs that are incurred as a direct result
of the decision to manage a species.
Estimating cost by objective is based on the approach used in recovery plans by the
United States Fish and Wildlife Service. Species managers estimated costs for 2003
until 2012 to the nearest $10,000 in constant December 2002 New Zealand dollars.
All estimates of costs, expenditure and changes in species’ conservation status are
discounted to their present value (PV) using the same constant exponential discount
rate of six percent to allow incidences of each one occurring at different points in time
to be directly compared across single species programs. The six discount rate reflects
the public’s preference for the conservation of a threatened species earlier rather than
later and is based on the real cost of government borrowing in New Zealand (Cullen et
al. 2001: 59).
RESULTS
The PV of estimated total costs of the 11 single species programs for 2003 until 2012
indicate that the costs of management are specific to each program (Figure 1). The
results show that the variations in the costs of programs are striking: the PV of total
costs for the ten year period covers a large range, from under $12,000 for the Stephens
Island ground beetle program to over $9 million for the North Island kokako program.
The large range in the PV of total costs means that the higher cost programs account
for the majority of the costs of threatened species management over the timeframe:
The variation in costs is also reflected in the difference between the median PV of
total cost of just over $1.6 million and the average PV of total cost of around $3
million for the ten year period. Discounting reduces the costs of species programs,
which may be of value when competing for funding, but it does not alter their ordinal
ranking because the incidences of costs over time are similar for all of the 11 single
species programs studied.
Figure 1 Present Value of estimated total costs of NZ species programs 2003-2012
The PV of estimated total costs of a program for 2003 until 2012 are derived from
estimates of the annual costs of the actions that need to be taken to achieve the set of
individual objectives developed for a species. The estimated cost of a program is,
therefore, dependent upon both the set of objectives developed for a species and the
estimated costs of achieving those objectives. The individual objectives for the 11
programs are categorized as follows: advocacy and/or public education, research,
survey and monitoring, translocation, habitat restoration, protection from threats,
control of threats, breeding program in the wild, and breeding program in captivity.
Using the typology, the PV of the estimated cost of the objectives for 2003 until 2012
is presented as a percentage of the PV of estimated total cost (Figure 2). The types of
objectives can be characterized as allocations of either the base resources required to
sustain a species or management services needed to prevent their decline
(Swanson,1994). Habitat restoration and translocation indicates the supply of
additional base resources to a species. The remaining types of objectives indicate
characterization depends upon the type of threat facing a species. For example, if the
threat being controlled predates on the species in question then the objective indicates
services for the management of direct threats, but if the threat is in competition with
the species then this points towards services for managing indirect threats. Advocacy
and education, research, and surveying and monitoring objectives indicate the creation
of a management regime for a threatened species. The objectives are roughly ordered
from the provision of base resources at the bottom to the supply of management
services at the top in Figure 2.
Figure 2 Present Value of costs of objectives as a percentage of total cost 2003-2012
The results showed that the three most common objectives for which there are
recorded costs for 2003 until 2012 are survey and monitoring, research, and
translocation, but there is wide variation in the proportion of costs attributed to these
different objectives. All of the non-avian programs have survey and monitoring costs
except for the program for Stephens Island ground beetle. The mohua, black stilt, and
North Island kokako programs have survey and monitoring costs, but only mohua and
black stilt programs have significant research costs (7). The costs for survey and
monitoring, and research for South Island long-tailed bat, mohua, black stilt and
Stephens Island frog account for over 20 percent of the PV of total cost of each
program over the ten year period. The Stephens Island frog program and all five bird
programs have costs for translocation, ranging from a PV of $28,000 for Stephens
Island frog to a PV of $467,000 for kakapo. The costs for advocacy and/or public
$633,000 for black stilt, and are less than ten percent of any program’s PV of total
cost for 2003 until 2012. The costs for survey and monitoring and research objectives
appear to be affected by the level of existing knowledge about a species. The kakapo
program had a PV of total expenditure of $16,615,000 from 1989 to 2002 and it has a
PV of total cost of $3,330,000 for 2003 until 2012, of which one percent is for survey
and monitoring, or research objectives. Unlike many other single species programs,
the kakapo program has 100 percent of its annual cost funded, which means that
expenditure is equal to cost. By comparison, the South Island long-tailed bat program
has a PV of total expenditure of $553,000 from 1995 until 2002 and a PV of total cost
of $5,875,000 for 2003 until 2012, of which 50 percent is for survey and monitoring,
and research. The conservation status of South Island long-tailed bat is unlikely to
improve through management, however, until those objectives are accomplished (J.
Lyall, personal communication, July 2002).
In total, the lowest cost objective over all 11 programs is habitat restoration (Table 2).
Much of the costs of habitat restoration are, however, included in the management of
the conservation estate generally, in the form of activities such as weed and pest
control, and not the protection of threatened species. The program for Stephens Island
ground beetle has only a cost for habitat restoration, which focuses on the placement
of recycled wooden fence posts as refugia. The more intensive management
objectives exhibit the highest costs: the control of particular threats, like possum
control operations, and breeding programs in the wild, followed by breeding in
captivity and then protection from threats, such as the use of predator proof fencing.
Over 70 percent of the PV of total cost for Pittosporum patulum, flax snail, mohua
threats. Part of the costs for the control of pests, however, may be covered by
management of the conservation estate.
Table 2 Costs of objectives across 11 programs for 2003 until 2012
Objective type No. of programs Average cost Total cost
Habitat restoration 4 $215,000 $860,000
Translocation 6 $198,000 $1,190,000
Breeding in wild 2 $1,650,000 $3,300,000
Protection from threats 4 $782,000 $3,130,000
Control of threats 5 $2,758,000 $13,790,000
Captive breeding 5 $788,000 $3,940,000
Survey and monitoring 8 $422,000 $3,380,000
Research 7 $460,000 $3,220,000
Advocacy and education 5 $176,000 $880,000
With the exception of the Stephens Island ground beetle program, the programs can
be divided into those for non-avian, which have costs for managing threats, and those
for avian, which have costs for breeding programs either in addition to or instead of
costs for the management of threats. Stephens Island frog, climbing everlasting daisy,
and South Island long-tailed bat have costs for protection from threats, P. patulum has
a cost for the control of threats, and flax snail has costs for both types of objectives.
The five avian programs have costs for captive breeding programs, and black stilt and
kakapo also have costs for breeding programs in the wild. Together, the average cost
$1,450,000, but this ranges from $29,000 for mohua to around $6,430,000 for black
stilt. For mohua, black stilt, and North Island kokako, the costs for breeding programs
are in addition to costs of controlling threats.
The cost structure for the 11 single species programs raises three points for
consideration. First, most programs have costs for the creation of a management
regime, such as survey and monitoring or research, but these costs appear to be
affected by the level of existing knowledge about the species. Second, the costs of
habitat restoration and the control of threats may not have been fully reported if they
did not occur as a direct result of the decision to manage a species. Finally, intensive
management objectives, such as control of threats and breeding programs, are
comparatively high cost and may be more commonly used for avian species for
whatever reason. All of these points suggest areas for further research.
The budget constraint
As in most countries around the world, threatened species management in New
Zealand operates under a budget constraint. Based on past patterns of expenditure and
existing budgets, the PV of expected expenditure for the 11 single species programs
of NZ$15.1 million for 2003 until 2012, compared to the PV of estimated total costs
of NZ$33.7 million over the same timeframe (Figure 3). The size of the gap between
future cost and expenditure for the 11 species programs is NZ$18.6 million. The
impact of the budget constraint on threatened species management is that a decision to
implement a species program will have an opportunity cost in terms of the
however, will depend on the program. Clearly, higher cost programs are far more
likely to require more funding and so have higher opportunity costs than programs
with lower costs. Decisions to implement higher cost programs will reduce the overall
number of single species programs that can be established within a particular budget.
Consequently, there needs to be a strong justification for higher cost programs at the
expense of lower cost programs and an explicit understanding of the trade-offs
involved. The varying costs of single species programs and the budget constraint will,
therefore, have a significant impact on an organization’s ability to achieve its goal for
threatened species management.
Figure 3 Present Value of total cost and expected total expenditure 2003-2012
Programs for Stephens Island ground beetle, climbing everlasting daisy, P. patulum,
Campbell Island teal, and flax snail have a relatively low cost but are allocated
minimal funding, sometimes on an irregular basis, or have to source funding from
general budgets. The irregular basis of funding for such programs appears to be
because funding tends to only become available when it can be spared from other
programs that are given a higher priority. In contrast, programs for mohua, South
Island long-tailed bat, black stilt, and North Island kokako have a higher cost but are
only allocated partial funding. In particular, the South Island long-tailed bat program
appears to be critically under funded: it expects to receive less than two percent of the
cost of achieving the species’ objectives. The Stephens Island frog and kakapo
minimal or partial funding, average future expenditure is expected to cover 28 percent
of the costs. As a consequence, management of a species will be delayed, which puts
the species at risk of further decline and may add to the total cost of the program. The
issue is similar to that which can exist in the health sector, where under-funding
creates waiting lists for treatment, increasing the risk to the well-being of the patient
and, ultimately, the total cost of healthcare.
The effect of under-funding on outcomes can be speculated upon by considering the
additional gains in species’ conservation status that could be achieved by 2012 if the
gap between future cost and expenditure for the 11 species programs of a PV of
NZ$18.6 million is met (Figure 4). Fully funding these programs could possibly
improve the conservation status of P. patulum to ‘Range Restricted’; climbing
everlasting daisy and North Island kokako’s conservation status to ‘Gradual Decline’;
flax snail and mohua to ‘Serious Decline’; and the conservation status of black stilt
from ‘Critically Endangered’ to ‘Endangered’. It is not, however, expected to improve
the conservation status of Campbell Island teal beyond that which the expected
funding could achieve by 2012, or that of South Island long-tailed bat, and additional
funding is essential if any gains are to be made in the species’ conservation status in
subsequent years.
Figure 4 Present Value of possible additional gains in conservation status if fully funded 2003-2012
The 11 programs directly represented less than two percent of the 603 New Zealand
‘Nationally Critical’ using the NZTCS (Hitchmough, 2002). Although this is a small
proportion of New Zealand’s threatened species, it can be argued that other species
indirectly benefit from the programs, which may create the potential for economies of
scope. For example, management of P. patulum, climbing everlasting daisy, and
South Island long-tailed bat would significantly reduce the management costs of other
species, and kakapo, North Island kokako, mohua, and black stilt act as ‘umbrella
species’. The protection of large tracts of habitat for black stilt automatically protects
wrybill (Anarbynchus frontalis), black-fronted tern (Sterna albostriata), and robust
grasshopper (Brachaspis robustus). The effectiveness of an umbrella species as a
‘short-cut’ in threatened species management is, however, yet to be proved
(Simberloff, 1998; Caro and O’Doherty, 1999; Andelman and Fagan, 2000). Not all
of the 603 species classified as ‘Nationally Vulnerable’, ‘Nationally Endangered’ or
‘Nationally Critical’ require direct management. In many instances, ecosystem
management will provide some benefit to species that are found within the ecosystem.
It should also be noted that the 11 programs may include a disproportionate number of
higher cost programs, such as that for kakapo, but they do not include the kiwi
program, which receives more funding than any other program (C. Carter, personal
communication, October 18, 2002). Managers’ predictions of the outcomes that could
be achieved if programs are fully funded may be considered by some to be overly
optimistic and further research is needed to check this against actual results.
The costs of programs over time
The PV of total cost for each of the 11 single species programs for 2003 until 2012
gives little indication of the total cost of a program over time. As the task of
estimating costs is subject to uncertainty and the objectives of a program are usually
developed for a five to ten-year timeframe, any attempts to accurately estimate the
annual costs of the programs beyond 2012 would be unrealistic. An alternative
approach is to calculate the average cost of one outcome unit, which in this case is a
unit improvement in a species’ conservation status for 2003 until 2012. Average cost
gives a rough idea of the cost-effectiveness of a program and the commitment to
management that is needed over the long-term. The PV of average cost for each of the
11 programs over the timeframe alters the relative positions of four of the species
programs from their order by total cost and appears to be related to a species’ taxon
(Figure 5). Programs for Stephens Island frog, kakapo, and possibly South Island
long-tailed bat have higher average costs when compared to other programs, and the
average cost of the North Island kokako program is comparatively lower. The
Stephens Island frog program, however, has a similar average cost to the four plant
and invertebrate species. Average costs for the plant and invertebrate programs,
excepting that for flax snail, are lower than for any other species programs. The
annual costs for the flax snail program may also be somewhat overstated because they
cover eighteen Endangered and Critically Endangered sub-species, some of which are
undescribed, but the conservation status of the species is only assessed for the twelve
Critically Endangered sub-species (A. Booth, personal communication, September 10,
2002). The Campbell Island teal program has a significantly lower PV of total cost per
conservation status unit than the other four avian programs because much of the actual
costs of the program has already occurred or is hidden. For example, the cost of
feeding for the captive breeding program is included in the overheads for the Mt
covered by the Southland Conservancy’s quarantine budget (P. McClelland, personal
communication, September 17, 2002). The average costs for the remaining avian
programs are higher than for any other species, except for possibly South Island
long-tailed bat.
Figure 5 Present Value of average costs of NZ single species programs 2003-2012
The average cost for the South Island long-tailed bat program is unknown because
management of the species is not expected to improve its conservation status over the
next ten years even if the program is fully funded. Research, survey and monitoring
account for half of the future costs of the program, but will not necessarily bring about
any direct improvement, even though they are essential for its management. Bats are
the only land mammal species native to New Zealand and their management is
expected to be effective at the sites that are managed, which is similar to the
management of forest avian, such as mohua and kokako (J. Lyall, personal
communication, December 2002). Past expenditure on the preparation of a recovery
plan for climbing everlasting daisy did not improve the species’ conservation status
because no extra funding was allocated for its implementation (N. Head, personal
communication, September 19, 2002). Similarly, past expenditure for P. patulum
enabled a full survey of historical sites to determine the best example of habitat for
protection but it was insufficient to allow for any mitigation of threats (N. Head,
personal communication, September 12, 2002). Such intermediate outputs of single
usually need to be carried out together with direct interventions for them to be
translated into final outcomes. Managers’ observations suggest that past patterns of
expenditure and expectations of future funding for different taxa could influence
estimates of costs and the development of objectives, which suggests these as
additional areas for further research.
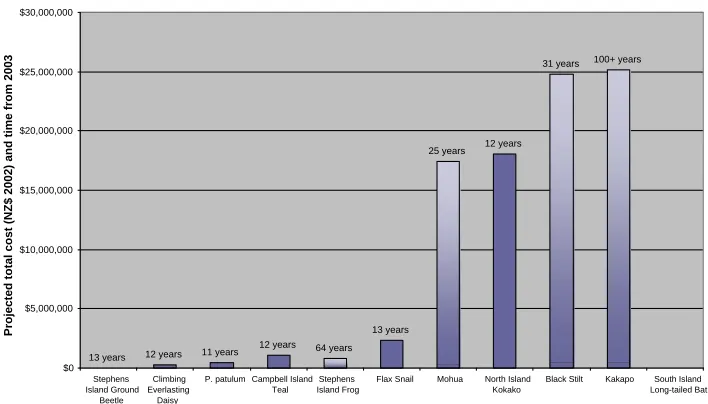
The projected total costs of the 11 programs show how a species’ initial conservation
status and its rate of progress potentially influence the total costs of a program (Figure
6). All 11 species were classified as either ‘Nationally Vulnerable’, ‘Nationally
Endangered’ or ‘Nationally Critical’ in 2002. The number of years that it would
potentially take for each species to improve from its conservation status in 2002 to
‘Not Threatened’ is recorded above each result. The projected total costs for Stephens
Island frog, mohua, black stilt and kakapo programs are shaded from dark to light to
reflect increasing uncertainty in the medium to long-term. The projected total cost of
the South Island long-tailed bat program is not presented because the recovery rate of
the species for 2003 until 2012 is unknown. The effect of differences in the
timeframes can be seen by comparing the projected total costs for different single
species programs. Stephens Island frog was more threatened than Campbell Island
teal and less threatened than flax snail in 2002, but its program has a similar projected
total cost because it has lower estimated annual costs and a lower predicted rate of
recovery. North Island kokako was more threatened than mohua in 2002 but its
associated program has a similar projected total cost, even though its estimated annual
costs are higher, because it has a higher predicted recovery rate. Black stilt and
kakapo were both Critically Endangered in 2002 and have similar projected total
because black stilt has a higher predicted rate of recovery than that for kakapo. If the
PV of projected total costs is discounted using a positive discount rate then the effect
is to reduce the projected total costs of the programs (Figure 7). The higher the
discount rate that is used, the greater the reduction in the total costs over time will be.
The effect, however, is relatively uneven across the 11 programs because of
differences in the timeframes needed for management of each species. The strongest
effect is on programs that are likely to have extremely long timeframes. The PV of
projected total cost for the mohua, black stilt and kakapo programs are reduced to less
than the cost of the North Island kokako program because they occur over a longer
time horizon. Despite this, existing budgets in recovery plans for threatened species
either in New Zealand or overseas do not tend to discount management costs.
Figure 6 Projected total costs of NZ single species programs from 2003
Figure 7 The effect of a positive discount rate on projected total costs
DISCUSSION
Six main reasons became apparent from the Species Managers Survey as to why the
task of estimating the costs of programs is complex and subject to uncertainty. First,
projects for particular populations of a threatened species may have multiple
objectives or the program may share resources with other programs at certain sites (J.
Hudson, personal communication, September 5, 2002). The costs of the North Island
kokako program are markedly different from other species programs because much of
inextricably linked. Similar costs are not included for other programs. Second, the
costs of species programs may be partly met by sponsorship from other public or
private organizations. As well as not being directly comparable, part of the reported
cost of the North Island kokako program is funded by other agencies, such as
Regional Councils and community groups, which are expected to take a greater share
of costs in the future (J. Hudson, personal communication, September 20, 2002).
Similarly, the kakapo program is sponsored by Comalco New Zealand and the Royal
Forest and Bird Protection Society. Third, programs may benefit from voluntary
community involvement. If any of these costs are not easily quantified then the task
will be complicated. The fourth reason for the task being complex is there may be a
lack of knowledge about a species if existing management is limited, as it is for South
Island long-tailed bat (C. O’Donnell and J. Lyall, personal communication, March 20,
2003). Fifth, even when there is knowledge about a species, costs may depend upon a
complex range of environmental factors that are often beyond the control of
managers. The results for the mohua program, and those for many other threatened
species, are dependent upon the variable effects of factors relating to threats from
predators (A. Roberts, personal communication, October 3, 2002). Finally, costs may
change over time through the application of knowledge gained either from the use of
adaptive management strategies or the management of other threatened species.
Despite such limitations sufficient data was gathered to enable a substantive
evaluation of the role of costs in managing endangered species.
Together, the varying costs of single species programs and the budget constraint have
a significant influence on an organization’s ability to achieve its management goal.
they often remain unquantified. The task can be complex, particularly if there is
limited knowledge about a species, and as a result, cost estimates are subject to a great
deal of uncertainty. Given the importance of cost information, however, this does not
provide sufficient justification for such an exercise not to be undertaken. The results,
illustrate that there are highly varying costs of single species programs. It also showed
that there are significant differences in the proportion of costs for specific recovery
plan objectives, such as research, habitat restoration, and translocation, between
programs.
In New Zealand, as in many other countries, the management of threatened species is
limited by a budget constraint. The impact of the budget constraint is that a decision
to implement a program for one species will have an opportunity cost in terms of the
management of other species at risk. This impact is apparent both in the persistent
underfunding of programs for some species and a complete lack of funding for those
still on the waiting list. A decision to implement a higher cost program will reduce the
overall number of single species programs, and so, there needs to be a strong
justification for the implementation of higher cost programs and an understanding of
the trade-offs involved. As in the health sector, insufficient funding delays a species’
program, putting it at risk of further decline, and potentially increases the total cost of
management. It also reduces the cost-effectiveness of programs and increases the
level of financial commitment that is ultimately required to manage a species over
time. Yet without cost information, measured as present values of costs of programs
Fundamentally, however, the thesis of this paper is not whether programs should be
fully funded or whether some programs should be allocated funding ahead of others.
It is that information on costs and possible outcomes should be sought and
understood, and that it is to a conservation organisation’s advantage to do so. The
likelihood of achieving improvements in effectiveness and efficiency, and the
increased ability to gain additional funding provide a strong incentive for conservation
organizations to generate such information. Perhaps part of the problem is that
organisations tend to set laudable but potentially unrealistic conservation goals.
Achieving these goals may have far greater costs than is envisaged and can be
provided for by funding agencies and society, and as a result, there may be wariness
about estimating costs and possible outcomes on the side of the conservation
organisation. Yet with better information and an increased understanding this situation
could be resolved.
ACKNOWLEDGEMENTS
We thank the New Zealand Department of Conservation species managers who took
the time to answer our survey. Without their co-operation this research would not
have been possible. This research was funded by the Ryoichi Sasakawa Young
References
Brown, L. 1993. The new shorter Oxford English dictionary on historical principles.
Clarendon Press, Oxford.
Bell, B.D., 1986. The conservation status of New Zealand wildlife. N.Z. Wildlife Service Occasional Publication, No.12.
Cullen, R., Fairburn, G.A., Hughey, K.F.D., 2001. Measuring the productivity of threatened species programs. Ecological Economics. 39(1): 53-66.
Cullen, R., Moran, E.M., and Hughey, K.F.D., 2005. Measuring the success and cost effectiveness of New Zealand multiple species projects to conservation of threatened species. Ecological Economics, 53: 311-323.
Department of Conservation (DoC). 2004. Annual report: for the year ended 30 June
2004. Department of Conservation, Wellington.
Department of Conservation (DoC), and Ministry for the Environment (MfE) 2000. The New Zealand Biodiversity Strategy: our chance to turn the tide; whakakohukihukitia te tai roroku ki te tai oranga. Department of Conservation and Ministry for the Environment, Wellington.
Doerksen, H., Leff, C.S., and Simon, B.M. 1998. Policy goals for endangered species recovery. Society and Natural Resources. 11: 365-373.
Fairburn, G., Hughey, K.F.D., and Cullen, R., 2004. Cost effectiveness of endangered species management: the Kokako (Calleas cinerea) in New Zealand. New Zealand Journal of Ecology. 28(1): 83-91.
Hitchmough, R. 2002. New Zealand Threat Classification System lists 2002. Threatened Species Occasional Publication, 23. Department of Conservation, Wellington.
Main, M.B., Roka, F.M., and Noss, R.F. 1998. Evaluating costs of conservation. Conservation Biology. 13(6):1262-1272.
Metrick, A. and Weitzman, M.L. 1996. Patterns of behavior in endangered species preservation. Land Economics. 72(1): 1-15.
Molloy, J., Bell, B.D., Clout, M., de Lange, P., Gibbs, G., Given, D., Norton, D., Smith, N., and Stephens, T. 2002. Classifying species according to threat of extinction: a system for New Zealand. Threatened Species Occasional Publication, 22. Department of Conservation, Wellington.
Simon, B.M., Leff, C.S., and Doerksen, H. 1995. Allocating scarce resources for endangered species recovery. Journal of Policy Analysis and Management. 14 (3): 415-432.
Swanson, T.M., 1994. The economics of extinction revisited and revised: a generalised framework for the analysis of the problems of endangered species and biodiversity losses. Oxford Economic Papers. 46: 800-821.
Towns, D.R., and Williams, M. 1993. Single species conservation in New Zealand: towards a redefined conceptual approach. Journal of the Royal Society of New Zealand. 23(2): 61-78.
Wilcove, D.S., and Chen, L.Y. 1998. Management costs for endangered species.
Conservation Biology. 12(6):1405-1407.
Williams, M.J., 1986. Native bird management, Forest and Bird. 17 (November) 7-9.
World Conservation Union (IUCN) Species Survival Commission 2000. 2000 IUCN Red List of threatened species: confirming the global extinction crisis. www.iucn.org/redlist/2000/news.html
Endnotes
1. The April 2007 NZ$/AU$ exchange rate was 0.88 and NZ$/US$ rate 0.74.
2. The Department of Conservation has a decentralized organizational structure that divides New Zealand into thirteen conservancies or management areas that are not necessarily aligned with natural species distributions.
3. The NZTCS was developed to complement the IUCN (World Conservation Union) Red List of Threatened Species but to also consider New Zealand’s relatively small land area, the period over which recent declines have occurred, and the high number of taxa with small population size and naturally restricted
Figure 1: Present Value of estimated total costs of NZ species programs 2003-2012
$11,802 $106,099 $167,315 $385,480 $3,330,223 $5,311,145 $5,874,754 $7,146,709 $9,314,082 $409,075 $1,640,655 $0 $1,000,000 $2,000,000 $3,000,000 $4,000,000 $5,000,000 $6,000,000 $7,000,000 $8,000,000 $9,000,000 $10,000,000 Stephens Island ground beetle Stephens Island frog climbing everlasting daisy
P. patulum Campbell Island teal
flax snail kakapo mohua South Island
long-tailed bat
black stilt North Island kokako P V ( 6%) o f t o tal co st ( N Z $ 2002)
Figure 2: Present Value of costs of objectives as a percentage of total cost 2003-2012
0% 10% 20% 30% 40% 50% 60% 70% 80% 90% 100% Stephens Island ground beetle Stephens Island frog climbing everlasting daisy
P. patulum Campbell Island teal
flax snail kakapo mohua South Island long-tailed bat
Black Stilt North Island kokako T h e P V o f to tal co st o f o b
jectives as %
Advocacy and education Survey and monitoring Research Captive breeding
Control of threat
Protection from threats
Breeding in wild
Translocation
Figure 3: Present Value of total costs and expected total expenditure 2003-2012
100% >100% 23% <2%
32% 19% 44% 67% 100% 26% 10% $0 $1,000,000 $2,000,000 $3,000,000 $4,000,000 $5,000,000 $6,000,000 $7,000,000 $8,000,000 $9,000,000 $10,000,000 Stephens Island ground beetle Stephens Island frog climbing everlasting daisy
P. patulum Campbell Island teal
flax snail kakapo mohua South Island long-tailed bat
black stilt North Island kokako PV ( 6 %) of t o ta l a nnua l c o s t a n d to tal an n u al fu n d in g (NZ $ 2002)
PV of total annual cost 2003-2012PV of expected total annual expenditure 2003-2
Figure 4: Present Value of possible additional gains in conservation status if fully funded 2003-2012
0.38 0.24 0.31 0.30 0.10 0.06 0.33 0.44 0.12 0.08 0.30 0.40 0.08 0.54 0.13 0.18 0.09 0.08 0.07 0.54 0.58 0.44 0.40 0.11 0.17 0.03 0.04 0.00 0.00 0.00 0.00 0.00 0.00 0.00 0.10 0.20 0.30 0.40 0.50 0.60 0.70 0.80 0.90 1.00 Stephens Island ground beetle climbing everlasting daisy
P. patulum Campbell Island teal
Stephens Island frog
flax snail North Island kokako
mohua black stilt kakapo South Island
long-tailed bat
P
V
(6%) of change i
n speci es' conservati on status where 0. 00 i s exti n cti
on and 1.
00 i
s
not
Figure 5: Present Value of average costs of NZ single species programs 2003-2012
$292 $2,727 $6,231 $7,521 $8,176 $26,228 $191,639 $282,243 $296,704 $954,241 $0 $100,000 $200,000 $300,000 $400,000 $500,000 $600,000 $700,000 $800,000 $900,000 $1,000,000 Stephens Island ground beetle climbing everlasting daisy
P. patulum Campbell Island teal
Stephens Island frog
flax snail North Island kokako
mohua black stilt kakapo South Island
long-tailed bat
PV (6%) o
f averag
e co
st (NZ
$
2002)
Figure 6: Projected total costs of NZ single species programs from 2003
100+ years 31 years 12 years 25 years 13 years 64 years 12 years 11 years 12 years 13 years $0 $5,000,000 $10,000,000 $15,000,000 $20,000,000 $25,000,000 $30,000,000 Stephens Island Ground Beetle Climbing Everlasting Daisy
P. patulum Campbell Island Teal
Stephens Island Frog
Flax Snail Mohua North Island Kokako
Figure 7: The effect of a positive discount rate on projected total costs
$0 $5,000,000 $10,000,000 $15,000,000 $20,000,000 $25,000,000 $30,000,000
Stephens Island Ground
Beetle Climbing Everlasting
Daisy
P. patulum Campbell Island Teal
Stephens Island Frog
Flax Snail Mohua North Island Kokako
Black Stilt Kakapo South Island Long-tailed Bat
PV (
6
%)
of
pr
oj
ect
ed t
o
ta
l cost
(
N
Z$ 2002)