Page | 16
Optimization of Cutting Rate for AISI A2 on
WEDM Using Response Surface Methodology
Anish Taneja
1, Sandeep Kumar
2, Ravinder Chaudhary
3, Jatin Taneja
41Research Scholar, Department of Mechanical Engineering, MIET, Shahabad, Kurukshetra, India 2HOD & Asst. Professor, Department of Mechanical Engineering, MIET, Shahabad, Kurukshetra, India
3HOD & Asst. Professor, Department of Mechanical Engineering, SKIET, Kurukshetra, India 4Asst. Professor, Department of Mechanical Engineering, JMIET, Radaur, Yamunanagar, India
Abstract— AISI A2 steel is an air hardened cold work
steel. It is a 5% Chromium steel that provides high degree of hardness after heat treatment with good dimensional stability. It offers good toughness with medium wear resistance and is comparatively easy to machine. Wire Electric Discharge Machine (WEDM) seems to be a good option for machining the complicated profiles. This paper, identify effects of various process parameters of Wire EDM such as pulse on time (Ton) ,pulse off time
(Toff), peak current (Ip) and servo voltage (Sv) for analysis
of cutting rate (CR) while machining AISI A2. Central Composite Design is used to plan the design of expert. The output response variable being cutting rate will be measured for all number of experiments conducted. The optimal parameter level combination would be analyzed which gives desired cutting rate. These optimized values of different parameters would then be used in performing the machining operation in order to obtain the desirable outputs.
Keywords— AISI A2, Wire EDM, Process Parameters, RSM, Cutting Rate, CCD.
I. INTRODUCTION
The main purpose of this paper is to analyze the effect of different process parameters like pulse on time (Ton)
,pulse off time (Toff), peak current (Ip) and servo voltage
(Sv) of Wire EDM using response surface methodology
(RSM), in particular the central composite design (CCD), to develop the empirical relationships between different process parameters and output response namely CR. Mathematical models so developed are analyzed and optimized to yield the values of process parameters producing optimal values of the output responses.
II. LITERATURE REVIEW
In 2004 Singh, P.N. et al [1] investigated the effect of Pulse on Time, Current and Flushing Pressure on Tool Wear Rate (TWR), Metal Removal Rate, Radial Overcut
Page | 17
approach. In 2012 Sivakiran, S. et al [5] studied the effect of various machining parameters like Pulse off, Pulse on, Current and Bed Speed on Material Removal Rate (MRR) and surface roughness. The relation between the control parameters and the output parameter was developed with the help of linear regression. Taguchi’s L16 Orthogonal Array (OA) has been implemented on EN-31 steel to achieve the maximum Material Removal Rate. The best parameter combination was Pulse off 6 μs, Pulse on 24μs, Bed Speed 35 μm/s and Current 5A to obtain the maximum Material Removal Rate. Regression Analysis implemented to predict the MRR with 6.77% error. In 2013 Chaudhary, R. et al. [6] identified the effects of different process parameters of Wire EDM such as Peak Current, Servo Voltage, Pulse on and Pulse off for the analysis of the Material Removal Rate while machining the EN5 mild steel material. Central Composite Design was used for the purpose of plan and Design of Experts. The output response variable was Material Removal Rate calculated for all experiments conducted. Because the lowest value of MRR showed the poor cutting rate, the optimum parameter level combination was analyzed which gave the required material removal rate. These optimized values of different process parameters were then used in performing the machining operation in order to obtain required outputs. In case of Material Removal Rate Ton was the most significant parameter. For both the response parameters, the estimated values of the responses were in close range with experimental results. In 2014 Khundrakpam, N.S. et al [7] studied the effects of various process parameters of Wire EDM like Peak Current, Wire Feed, Pulse on Time, Pulse off Time and Wire Tension to disclose their effect on surface roughness of EN-8 steel work piece using Taguchi's L-27 Orthogonal Array (OA) designs. The optimum combination of process parameters has also been envisaged to minimize the surface roughness. It was observed that with decrease in Pulse on Time and Peak Current, the surface roughness will decrease considerably. The significant factors were Pulse on time, Wire Feed and Peak Current; however the other factors were insignificant. In 2015 Murugan, T.P. and Rajasekaran, T. [8] proposed the optimization of the micro electrical discharge machining parameters using the Taguchi’s technique for AISI 1040 steel because of its economically feasibility to produce dies at cheaper cost and higher hardness. Experimentation was done as per the Taguchi’s L9 orthogonal array. Each experiment was done under the different machining conditions of capacitance, gap voltage, threshold and feed. Two responses namely
surface roughness and material removal rate were taken for each experiment. The optimal machining parameter combination was obtained making use of analysis of signal to noise (S/N) ratio. The level of importance of machining parameters on surface roughness and material removal rate was determined by using the analysis of variance (ANOVA).The most effective parameters on both the surface roughness and MRR were found as capacitance and gap voltage.
III. EXPERIMENTAL METHODOLOGY
3.1 Machine tool
In this research work, CR is response characteristics. This response characteristic is investigated under varying conditions of input process parameters, which are namely pulse on time (Ton) ,pulse off time (Toff), peak current (Ip)
and servo voltage (Sv). The experiments were performed
on Electronica make ELEKTRA Sprintcut 734 CNC Wire cut machine as shown in figure 3.1. ELEKTRA Sprintcut 734 provides full freedom to operator in choosing the parameter values with in a wide range. A brass wire of 0.25 mm diameter is used as the cutting tool material. De-ionized water is used as dielectric, which flush away metal particle from the workpiece.
Figure 3.1 WEDM Setup for experimentation 3.2 Workpiece
AISI A2 steel is an air hardened cold work steel. It is a 5% Chromium steel that provides high degree of hardness after heat treatment with good dimensional stability. It is heat treatable and will provide hardness in the range of 57-62 HRC. It offers good toughness with medium wear resistance and is comparatively easy to machine. It is used in various applications which require good degree wear resistance as well as good toughness. AISI A2 steel is characterized by:
• Good machinability
• Good wear resistance
• Better stability after hardening
Page | 18 • High hardenability
• Better non-deforming properties
Table 3.1 gives the chemical composition of the material AISI A2.
Table 3.1 Chemical composition of AISI A2
Element C Mn Si Cr Ni Mo V
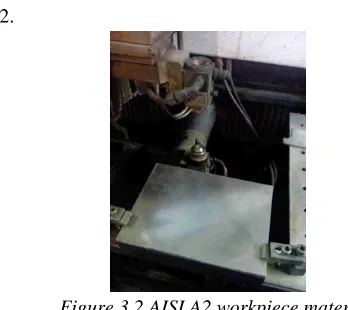
% age 1.01 0.62 0.25 4.77 0.34 1.02 0.28 The work material used is in rectangular form of dimensions 210mm x 160mm x 27mm as shown in figure 3.2.
Figure 3.2 AISI A2 workpiece material 3.3 RSM and design of experiment
Response surface methodology is a collection of the statistical and mathematical methods which are useful for the modeling and optimization of engineering science problems. Response surface methodology explores the relationships between controllable input parameters and obtained responses. There are in total 21 experiments carried out according to design of experiments. The average values of CR (mm/min) are shown in Table 3.2.
Table 3.2 Design of experiment and CR
Std Run Ton Toff Ip Sv CR
1 6 125 50 150 15 2.1 2 11 125 50 70 15 1.05 3 21 125 30 150 35 2.85 4 17 105 50 70 35 0.197 5 18 125 30 70 35 1.85 6 8 105 30 150 15 1.2 7 10 105 50 150 35 0.4 8 14 105 30 70 15 1.1 9 5 98 40 110 25 0.57 10 16 129 40 110 25 2.3 11 20 115 23 110 25 1.9 12 2 115 57 110 25 0.52 13 3 115 40 40 25 0.9
14 13 115 40 180 25 1.863 15 12 115 40 110 8 1.853 16 1 115 40 110 42 1.23 17 4 115 40 110 25 1.58 18 9 115 40 110 25 1.57 19 15 115 40 110 25 1.59 20 7 115 40 110 25 1.56 21 19 115 40 110 25 1.57
IV. RESULT AND DISCUSSION 4.1 Analysis of cutting rate
According to fit summary obtained from analysis, it is found that the quadratic model is statistically significant for CR. The results of quadratic model for CR in the form of ANOVA are presented in Table 4.1. If F value is more corresponding, p value must be less and corresponding resulting in a more significant coefficient. Non significant terms are removed by the backward elimination for fitting of CR in the model. Alpha out value is taken as 0.05 (i.e., 95 % confidence level). It is found from the Table 4.1 that F value of model is 2625.833 and related p value is < 0.0001, results in a significant model. The lack of fit is a measure of failure of model to represent data in experimental domain at which the points are not included in regression variations in model that cannot be accounted for by the random error. If there is the significant lack of fit, as indicated by the low probability value, response predictor is discarded. Lack of fit is non significant and its value is 0.1356. From Table 4.1 it is found that R² of model is 0.999746, which is very close to 1. It means that 99.97 % variation can be explained by the model and only .03% of the total variation cannot be explained, which is the indication of good accuracy. The predicted R² is in the logical concurrence with adjusted R2 of 0.997063. Figure 4.1 shows normal probability plot of residuals for CR. Most of residuals are found around straight line, which means that the errors are normally distributed. Adequate precision compares significant factors to non significant factors, i.e., signal to noise ratio. According to results obtained from software, ratio greater than 4 is desirable. In this, adequate precision is 198.78. So signal to noise ratio is significant. By applying multiple regression analysis on experimental data, empirical relation in terms of actual factors is obtained as follows, equation 4.1.
CR = -10.54228 + 0.11904*Ton + 0.26207*Toff -
Page | 19
0.0016411*Ton*Toff + 0.000545938*Ton*Ip + 0.0000478125*Toff*Ip – 0.000689076*Toff*Sv (4.1)
Table 4.1 ANOVA for response surface of Cutting Rate
Pooled ANOVA for Response Surface Reduced Quadratic Model
Analysis of variance table [Partial sum of squares - Type III] Sum
of Square
s D F
Mean Square
F Value
p-value
Source Prob > F
Model
8.860 12 0.738 2625.83 < 0.0001 signi
fica nt A-Ton 1.369 1 1.369 4869.62 < 0.0001 B-Toff 2.274 1 2.274 8090.51 < 0.0001 C-Ip 1.154 1 1.154 4105.84 < 0.0001 D-Sv 0.194 1 0.194 690.16 < 0.0001 AB 0.090 1 0.090 321.39 < 0.0001 AC 0.381 1 0.381 1356.75 < 0.0001 BC 0.002 1 0.002 10.4063 0.0121 BD 0.013 1 0.013 48.7915 0.0001 A2 0.007 1 0.007 26.3412 0.0009 B2 0.251 1 0.251 893.871 < 0.0001 C2 0.070 1 0.070 249.611 < 0.0001 D2 0.002 1 0.002 9.01002 0.0170 Residu
al 0.002 8 0.0003
Lack of Fit
0.001 4 0.0004 3.32595 0.1356 not signi fica
nt Pure
Error 0.0005 4 0.0001 Cor
Total 8.862 20 Std.
Dev. 0.016 R-Squared
0.99 97
Mean 1.416 Adj R-Squared 0.99 93
C.V. % 1.183 Pred R-Squared 0.99 71
PRESS 0.026 Adeq Precision 198. 78
Figure 4.1 Normal probability plot of residuals for CR
4.2 Effect of process parameters on CR
The combined effect of two control factors on response variables is called interaction effect. For interaction plot, two parameters vary keeping the other two process parameters constant at their central value and observe effect on response characteristics. This plot is called three-dimensional surface plot. So the significant interactions are shown in figures 4.2-4.5.
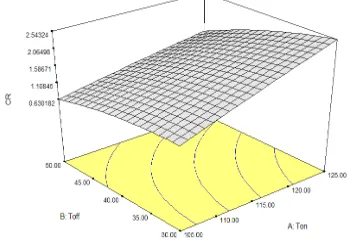
The interaction effect of pulse on time (Ton) and pulse off time (Toff) on cutting rate (CR) is shown graphically in figure 4.2. According to this, cutting rate (CR) attains a peak value of 2.54324 mm/min; when Ton is increased from 105 to 125µswith Toff remain unchanged at 30µs. This is because at high value of Ton and corresponding lower value of Toff result in longer duration of spark occur which leads to higher discharge energy subjected on work piece causing faster and greater erosion of material. It also shows that CR attains a minimum value of 0.630182 mm/min; when Toff is increased from 30 to 50µs with Ton remain unchanged at 105µs. This is due to the fact that lower value of Ton with a higher value of Toff results in a smaller duration of spark to occur that leads to less amount of release of spark energy causing slower erosion of material.
Figure 4.2 Interaction effect of Ton and Toff on CR
Page | 20
when peak current is increased from 70A to 150A with pulse on time remain unchanged at 105 µs. On the other hand, on increasing the pulse on time value from 105 to 125µs the cutting rate increased from 0.868 to 1.532 mm/min with peak current remain unchanged 70A. On setting the pulse on time and peak current to the highest level 125µs and 150A respectively the cutting rate
Figure 4.3 Interaction effect of Ton and Ip on CR increases to the maximum value of 2.54 mm/min.
Increase in peak current leads to the increase of the cutting rate. This can be explained by the fact that at higher peak current the pulse energy increases resulting in higher melting and evaporation of the work piece. By increasing the peak current value, the temperature around the spark increases which leads to rapid melting of the material at a high rate that increases the cutting rate of the process.
Interaction effect of pulse of time (Toff) and peak current (Ip) on cutting rate (CR) is shown in figure 4.4. When pulse off time is varied from 30 to 50 µs, with a constant peak current of 70 A, the cutting rate decreased from 1.523 to 0.672 mm/min. It is due to the fact that on increasing the time gap between the two consecutive sparks the process of erosion of material becomes slow. By increasing the peak current from 70 to 150 A, the cutting rate increased from 1.523 to 2.057 mm/min as on increasing the peak current the pulse energy increases resulting in higher melting and erosion of work piece material.
Figure 4.4 Interaction effect of Toff and Ip on CR
The interaction effect of peak current (Ip) and servo voltage (Sv) (figure 4.5) depicts that a larger cutting rate of 1.956 mm/min is obtained at lower values of Toff (30 µs) and Sv (15V) owing to the reasons cited earlier. On increasing the values of pulse off time from 30 to 50 µs and servo voltage from 15 to 35V the cutting rate decreased to 0.777 mm/min.
Figure 4.5 Interaction effect of Toff and Sv on CR.
Sv is the reference voltage in the gap. Higher is the Sv, larger the gap between wire and work piece. It takes a large time for discharge to build up and hence cutting rate need to be reduced by the control system.
V. CONCLUSION
In this paper, the effect of process parameters on CR is investigated. It is concluded that:
1. Main effect of pulse on time, pulse off time, peak current and servo voltage and interaction effect of pulse on time and pulse off time, pulse on time and peak current, pulse of time and peak current, pulse off time and servo voltage and second order of pulse on time, pulse off time, peak current and servo voltage found to be significant from the ANOVA of cutting rate.
2. It was found experimentally and by subsequent analysis that on increasing the pulse on time and peak current, the cutting rate increases, whereas increasing the pulse off time and servo voltage decreases the cutting rate. The higher discharge energy associated with the increase of pulse on time leads to a more powerful explosion and thus increases cutting rate.
Page | 21 REFERENCES
[1] Singh, P.N., Raghukandan, K., Rathinasabapathi, M. and Pai, B.C., 2004, “Electric discharge machining of Al–10%SiCP as-cast metal matrix composites”, Journal of Materials Processing Technology, pp. 1653-1657.
[2] Hewidy, M.S., El-Taweel, T.A. and El-Safty, M.F., 2005, “Modelling the machining parameters of wire electrical discharge machining of Inconel 601 using RSM”, Journal of Materials Processing Technology, pp. 328-336.
[3] Kanlayasiri, K. and Boonmung, S., 2007, “An investigation on effects of wire-EDM machining parameters on surface roughness of newly developed DC53 die steel”, Journal of Materials Processing Technology, pp. 26-29.
[4] Sarkar, S., Sekh, M., Mitra, S. and Bhattacharyya, B., 2008, “Modeling And Optimization Of Wire Electrical Discharge Machining Of Tial In Trim Cutting Operation”, Journal Of Materials Processing Technology, pp. 376-387.
[5] Sivakiran, S., Reddy, C.B. and Reddy C.E., 2012, “Effect Of Process Parameters On MRR In Wire Electrical Discharge Machining Of En31 Steel”, International Journal of Engineering Research and Applications, Vol. 2, Issue 6, pp.1221-1226.
[6] Chaudhary, R., Rampal, R. and Sharma, N., 2013, “Investigation and Optimization of Materiel Removal Rate For Wire Cut Electro Discharge Machining In EN5 Steel Using Response Surface Methodology”, International Journal of Latest Trends in Engineering and Technology, Vol. 3 Issue 1, pp. 192-199.
[7] Khundrakpam, N.S., Singh, J., Kumar, K. and Kumar, S., 2014, “Effect of wire EDM process parameters on surface roughness”, International Journal of Mechanical Engineering and Robotics Research, Vol. 3, No. 2, pp. 435-441.