ISSN: 2395-3519
International Journal of Advanced Trends in Computer
Applications
www.ijatca.com
Cross Breed Biometric Fusion at Feature Level
Using Back Propagation Algorithm
Nav Rajbir Singh Bhullar1, Gaganpreet Kaur2
1
Research Fellow, 2Asst Professor
1,2
Sri Guru Granth Sahib World University, Fatehgarh Sahib, Punjab. 1
[email protected], [email protected]
Abstract:
Biometrics can proffer enhanced solutions for confidential and personal privacy security. Biometrics has been penetrated almost all areas of economy and people’s daily life. In our study, feature extraction of tongue biometric and speech biometric by using MFCC & FFT are used to increase the accuracy and to fuse the biometric correctly.Keywords:
MFCC, FFT, Hamming window, FAR, FRR, Tongue biometric, Speech biometric, back propagation algorithm.I.
INTRODUCTION
Physical access and internal access are used to venture computers and systems. A biometric scanning machine takes a biometric data like a speech or tongue-print scan and converts it into digital in sequence a computer can understand and authenticate [1].
Biometric devices can be explained in three steps: (i) An observation is taken by sensor that depends on the type of biometrics device used and gives a Biometric signature of the individual.
(ii) A computer algorithm normalizes the biometric signature to format (size, resolution, etc.) as the signatures on the system database. The normalization of the biometric signature gives a normalized signature of the personality.
(iii) A matcher compares the normalized signature with the set of normalized signatures on the systems database and gives a correspondence score that can differentiate the individual’s normalized signature with each signature in the database set.
II.
TONGUE BIOMETRIC
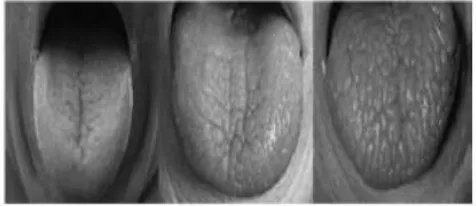
The tongue is unique to each person in its shape as shown in Figure 1 and in its surface textures as shown in Figure 2. Second, the tongue is the only internal organ that can quite normally and easily be exposed for inspection. The tongue is the only internal organ that can quite normally and easily be exposed for inspection [1].
Tongue recognition is followed by two Features of Tongue that are as follows:
Shape parameter can be calculated by using control points which gives the prominent outlines of shape feature of tongue
Fig.1: Different shape of Tongue
Texture Feature can be calculated by SIFT Algorithm which is Pre-processed by Histogram Equalization.
ISSN: 2395-3519
III.
SPEECH RECOGNITION
It has incredible development over the preceding five decades due to the advances in signal processing, algorithms, new architectures and hardware [2]. Pre-processing of the speech signal is a key role for extracting and coding competently the consequential information in the signal. In this system, LPC, MFCC and GTCC feature extraction technique are used. The performance of speech recognition systems degrades in noisy environment, which is a most important issue in utilizing such systems in real world. The degradation has been recognized to inevitable difference between training and recognition conditions [3]. The recognition module uses the speech features and the acoustic models to translate the speech input and produces text results with high correctness. The speech signals are also used in biometric recognition technology and communicating with machine [4]. These speech signals are slowly timed changeable signals (quasi-stationary). When examined over a adequately short period of time (5-100 m sec), its uniqueness are quite stationary.
IV.
MEL FREQUENCY CEPSTRAL
COEFFICIENTS (MFCC)
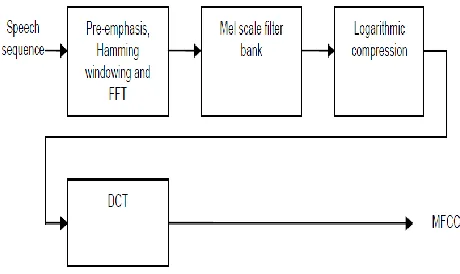
Mel Frequency Cepstral Coefficients (MFCC) [5] is one of the most commonly used feature extraction front-ends in speech recognition systems. Figure 3 explains the MFCC extraction procedure
Figure 3: MFCC feature Extraction The MFCC extraction is done in three steps:
Step 1:
a) Cut up the signal in several overlapping windows.
b) To decrease the spectral distortion a Hamming windowing is applied to signal frames:
W(n)=.54-0.46*cos [2∏n/N-1)] //0<=n<=N-1
where, N is the window size.
Step 2:
a) Apply the FFT.
b) The Mel-frequency scale is applied using the following transformation formula:
F(Mel)=[2595*log10[1+f/700]
c) Apply the logarithm after the Mel scale.
Step 3:
Finally, obtain the discrete cosine transform (DCT) of the output signal.
V.
SCALE INVARIANT FEATURE
TRANSFORMATION (SIFT)
SIFT algorithm is a feature vector generation algorithm which takes an image as input and generates a large collection of local feature vectors as output [1]. SIFT algorithm works in four steps:
i. Detection of Scale-space extrema: This step can be achieved using a scale space function and must be based on the Gaussian function. Difference of Gaussians is applied for locating scale-space extrema.
ii. Localization of Keypoints: This stage attempts to eliminate more points from the list of keypoints by finding those that have low contrast or are poorly localised on an edge. This is achieved by calculating the Laplacian value for each keypoint found in step 1. If the function value is below a threshold value then this point is excluded.
iii. Orientation assignment: One or more orientations are assigned to the keypoints based on local image properties.
iv. Keypoint Descriptor: The local gradient data is used to measure keypoint descriptors. Then these are transformed and a set of histograms are created over a window centred over keypoint.
VI.
BACK PROPAGATION ALGORITHM
ISSN: 2395-3519 algorithm can be divided into two phases: propagation
and weight update.
Each propagation involves the following steps:
1. Forward propagation of a training pattern's input
through the neural network in order to generate
the propagation's output activations.
2. Backward propagation of the propagation's
output activations through the neural network
using the training pattern target in order to
generate the deltas of all output and hidden
neurons.
For each weight update follow the following steps:
1. Multiply its output delta and input activation to
get the gradient of the weight.
2. Subtract a ratio (percentage) of the gradient from
the weight.
In the proposed work new fitness function is used as it gives the better results.
New fitness function
Sqrt(log(Baa)+log(Aaa)+xor(Bai,Aai))
VII.
FUSION
In the proposed work, fusion of speech and tongue is performed using a new technique.
A. Tongue Model
The steps used for extracting the features are: i. Upload tongue image.
ii. Convert into grey scale.
iii. Perform min-max normalization. iv. Apply sift.
v. Calculate other parameters:
Area
Extent
Perimeter
Centroid
vi. Result is stored in excel file.
B. Speech Model
i. Upload a speech signal. ii. X = signal values of speech.
iii. MFCC is applied.
iv. Hamming value is determined.
Y(n)=X(n)*W(n)
W(n)=.54-0.46*cos [2∏n/N-1)] //0<=n<=N-1
N= number of samples in each frame taken as 256.
Y(n)= output signal X(n)= input signal
W(n)=hamming window result signal
v. FFT of signal is calculated to convert each sample from time domain to frequency domain
Y(w)= FFT[h(t)*X(t) //FFT is fast Fourier transform = H(w)*X(w)
X(w),H(w),Y(w) are Fourier transform of X(t),H(t) and Y(t) respectively.
vi. Mel frequency is calculated in hertz using blow equation
F(Mel)=[2595*log10[1+f/700]
vii. MFFC result is calculated and stored in database.
viii. Other parameters are calculated
a. Min frequency b. Max frequency c. Average frequency
C. Fusion algorithm
i. Load tongue -- To load all features of tongue. ii. Load speech-- To load all features of speech. iii. Sum=0 --Taking sum as a parameter whose value is 0 at the first stage.
a. train(net--- training the network
b. Defining the default input for the first iteration as 00 and 11 defining the output for the first iteration as 01 and 01, defining the hidden layer inputs as a combination of input and output layer 0001.
VIII.
DATABASE
Database collection for Tongue
ISSN: 2395-3519 cm and person’s head is supported by head rest of height
15 cm. The distance between head rest and camera is 9 cm [1]. The images of tongue should be taken in an enclose area to ensure lighting of tongue image in control and for good clarity and accuracy of the pictures. In proposed work, 11 images of tongue of 11 different people’s have been collected and stored in database.
Figure 4: Database for tongue.
Database collection for Speech
CMU_ARCTIC is used as database for speech. The CMU_ARCTIC databases were constructed at the Language Technologies Institute at Carnegie Mellon University as phonetically balanced, US English single speaker databases designed for unit selection speech synthesis research. The databases consist of around 1150 utterances carefully selected from out-of-copyright texts from Project Gutenberg. The databases include US English male and female speakers (both experienced voice talent) as well as other accented speakers. In the proposed work only male database has been used which contains 1132 utterances spoken by a US English male speaker which was recorded at 16bit 32KHz, in a sound proof room, in stereo, one channel was the waveform, the other EGG.
The database was automatically labelled using EHMM an HMM labeller that is included in the FestVox distribution. No hand correction has been made.
Figure 5: Database for speech.
IX.
RESULTS & CONCLUSION
In our research, fusion of tongue biometric and speech biometric has taken place. We have used feature
extraction techniques MFCC and FFT to
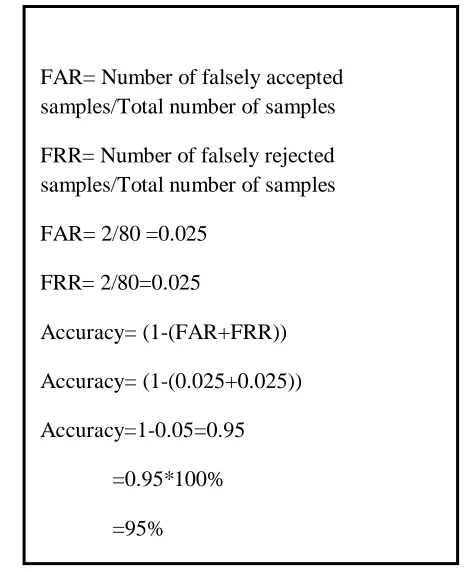
improve/increase the accuracy rate. The FAR i.e. false acceptance rate after calculating is 2/80 i.e. 0.025 and FRR i.e. False rejection rate is also same 0.025. The accuracy rate can be calculated as:
FAR= Number of falsely accepted samples/Total number of samples FRR= Number of falsely rejected samples/Total number of samples FAR= 2/80 =0.025
FRR= 2/80=0.025
Accuracy= (1-(FAR+FRR)) Accuracy= (1-(0.025+0.025)) Accuracy=1-0.05=0.95
ISSN: 2395-3519
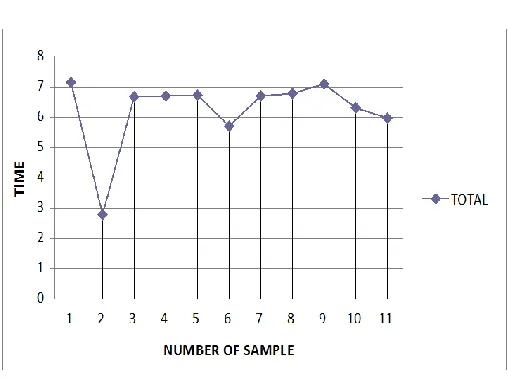
Time graph
Figure 6: Time Graph
REFERENCES
[1]. M. Diwakar, M. Maharshi, “An Extraction and Recognition of Tongue-Print Images for Biometrics Authentication System,” International Journal of Computer Applications (0975 – 8887), Volume 61– No.3, January 2013.
[2]. Reynolds, D.A., “An overview of automatic speaker recognition technology, ” in Proceedings of 27th IEEE International Conference on Acoustics, Speech, and Signal Processing, pp. 4072-4075 ,2002.
[3]. Chen, S.H., Wang, “Improvement of speaker recognition by combining residual and prosodic features with acoustic features,” in Proceedings of 29th IEEE International Conference on Acoustics, Speech, and Signal Processing, pp. 93-96 2004.
[4]. L.R.Rabiner and B.Juang, “Fundamentals on speech recognition,” New Jersey: Prentice Hall, 1996.
[5]. Lyon, R., “A computational model of filtering, detection, and compression in the cochlea, Acoustics, Speech, and Signal Processing”, IEEE International Conference on ICASSP '82., vol. 7, pp. 1282-1285, 1982.
[6]. N. A. Fox, R. Gross, J. F. Cohn, and R. B. Reilly, “Robust Biometric Person Identification using Automatic Classifier Fusion of Speech, Mouth and Face Experts”, IEEE Transactions on Multimedia, vol. 9, no. 4, pp. 701-714, 2007.
[7] Z. Liu, J.Q. Yan , D. Zhang, and Q.L. Tang, “A Tongue-Print Image Database For Recognition”, in Proceedings of the Sixth International Conference on Machine Learning and Cybernetics, Hong Kong, pp. 19-22,2007.
[8]. D. Kaur, G. Kaur, and D. Singh, “Efficient and Robust
Multimodal Biometric System for Feature Level Fusion (Speech and Signature)”, International Journal Of Computer Applications, vol. 75, no. 5, pp. 33-38, 2013.
[9]. K. Delac, and M. Grgic, “A Survey of Biometric Recognition Methods”, in 46th International Symposium Electronics in Marine, ELMAR-2004, pp. 184-193, 2004. [10] M.F. Zanuy, “Data Fusion in Biometrics”, IEEE A & E Systems Magazine, pp.34-38, 2005.
[11]. M. Diwakar, and M. Maharishi, “An Extraction and Recognition of Tongue-Print Images for Biometrics Authentication System”, International Journal of Computer Applications, vol. 61, no. 3, pp. 36-42, 2013.
[12] A. Ross, and A. Jain, “Information Fusion in Biometrics”, Pattern Recognition Letters, vol. 24, no. 13, pp. 2115-2125, 2003.
[13] A.K. Jain, A. Ross, and S. Prabhakar, “An Introduction to Biometric Recognition”, IEEE Transactions on Circuits and Systems for Video Technology, vol. 14, no. 1, pp. 1782-1793,2004.
[14] J.Y. Choi, Y.M. Ro, and K.N. Plataniotis, “Color Local Texture Features for Color Face Recognition”, IEEE Transactions on Image Processing, vol. 21, no.3, pp. 1366-1380, 2012.