Original Research Article
Prediction of risk of development of type 2 diabetes mellitus using
Indian diabetic risk score in rural areas of Hassan
Sumana M., Hanamantappa Kudachi*, M. Sundar
INTRODUCTION
Diabetes is a chronic, progressive non-communicable disease (NCD) characterized by elevated levels of blood glucose (blood sugar). It occurs either when the pancreas does not produce enough insulin (a hormone that regulates blood sugar, or glucose), or when the body cannot effectively use the insulin it produces.1 NCDs are of long duration, and are generally slow in progression. NCDs are the leading cause of death in the world,
responsible for 38 million (68%) of the 56 million deaths worldwide in 2012.2
Diabetes is one of four priority non-communicable diseases (NCDs) targeted for action by world leaders in the 2011 political declaration on the prevention and control of NCDs. Both the number of cases and the prevalence of diabetes have been steadily increasing over the past few decades and is growing most rapidly in low- and middle income countries1.
ABSTRACT
Background: It has been estimated by International Diabetic Federation (IDF) that globally as many as 193million people with diabetes, are unaware of their disease, the use of a simple easy to use, non-invasive and cost effective screening tool for community based screening is the need of the hour. This study was taken with objective to assess the risk of development of type 2 diabetes mellitus using Indian diabetic risk score (IDRS), and to determine the association of IDRS with socio-demographic factors.
Methods:Cross sectional study was conducted for 3 months in rural areas of Hassan. 480 subjects were chosen by systematic random sampling considering inclusion and exclusion criterions. Data was collected from individuals who were more than 30 years old and not having diabetes. IDRS components were assessed along with other socio demographic components.
Results: Out of 480 participants, 256 (53.4%) were females, mean age of the participants 42.38±18.6. 47% belong to class III socioeconomic status, 63%of them are educated, 49% of participants having BMI ≥25, 41% (>0.8) female and 33% (>0.9) male having abnormal waist hip ratio (WHR), 49% of the participants having IDRS score >50 among these high risk participants 35% were having RBS >200. All 24 (100%) morbid obese individuals were having high IDRS score; among these 66.6% have abnormal RBS. IDRS predicted the risk of DM with sensitivity 81% and specificity 59%.
Conclusions: As the study finds that percentage random blood glucose is more among participants of high IDRS, thus a simple IDRS tool can be used in the field for mass screening and early intervention.
Keywords: IDRS, Type-2 diabetes mellitus, Sensitivity, Specificity
Department ofCommunity Medicine, Hassan Institute of Medical Sciences, Hassan, Karnataka, India
Received: 15 January 2018
Accepted: 01 February 2018
*Correspondence:
Dr. Hanamantappa Kudachi,
E-mail: [email protected]
Copyright: © the author(s), publisher and licensee Medip Academy. This is an open-access article distributed under the terms of the Creative Commons Attribution Non-Commercial License, which permits unrestricted non-commercial use, distribution, and reproduction in any medium, provided the original work is properly cited.
The prevalence of diabetes mellitus is growing rapidly worldwide and is reaching epidemic proportions. It is estimated that there are currently 285 million people with diabetes worldwide and this number is set to increase to 438 million by the year 2030. The major proportion of this increase will occur in developing countries of the world where the disorder predominantly affects younger adults in the economically productive age group.4
The dramatic rise in the prevalence of type 2 diabetes and related disorders like obesity, hypertension and the metabolic syndrome could be related to the rapid changes in life style that has occurred during the last 50 years. Although this “epidemiological transition”, which includes improved nutrition, better hygiene, control of many communicable diseases and improved access to quality healthcare have resulted in increased longevity, it has also led to the rapid rise of the new age diseases like obesity, diabetes and heart disease. In virtually all populations, higher fat diets and decreased physical activity and sedentary occupational habits have accompanied the process of modernization which has resulted in the doubling of the prevalence of obesity and type 2 diabetes in less than a generation.4
Over the past 30 years, the status of diabetes has changed from being considered as a mild disorder of the elderly to one of the major causes of morbidity and mortality affecting the youth and middle aged people.
There is also consensus that the South Asia region will include three of the top ten countries in the world (India, Pakistan and Bangladesh) in terms of the estimated absolute numbers of people with diabetes.5
The National Urban Diabetes Survey (NUDS), a population based study was conducted in six metropolitan cities across India reported that the age standardized prevalence of type2 diabetes was 12.1 per cent.6
According to the World Health Report 2005 NCDs already contribute to 52 per cent of the total mortality in India and these figures are expected to increase to 69 per cent by the year 2030. Therefore, countries like India are currently facing an epidemiologic transition with a „double burden‟ of disease.7
Nowhere is the diabetes epidemic more pronounced than in India as the World Health Organization (WHO) reports show that 32 million people had diabetes in the year 2002.8 The International Diabetes Federation (IDF)
estimates the total number of diabetic subjects to be around 40.9 million in India and this is further set to rise to 69.9 million by the year 2025 and to 80 million by the year 2030.9
With almost half of the diabetics remaining undiagnosed, the use of a simple easy to use, non-invasive and cost effective screening tool for community based screening is
the need of the hour. Community based screening studies, apart from identifying this hidden part of the ice berg, will also help in promoting awareness among the people regarding disease preventive and health promoting
measures.7 Early identification of the high risk
individuals would help in taking appropriate intervention in the form of dietary changes and increasing physical activity, thus helping to prevent, or at least delay, the onset of diabetes. This means that identification of at risk individuals is extremely important if we are to prevent diabetes in India.8 With objectives to assess the risk of development of type 2 diabetes mellitus using Indian diabetic risk score and to determine the association of IDRS with socio-demographic factors this study is taken up.
METHODS
A community based cross sectional study was conducted in the rural field practice area of Hassan Institute of Medical Science, Hassan, Karnataka for the period of three months from 1/10/2017 to 31/12/2017. The village chosen for study had population of 2404. All persons above 30 years of age were included in the study. Those individuals who were previously diagnosed with diabetes mellitus and its complications and those not willing to participate were excluded from the study. Informed consent was obtained from all participants.
Sample size calculation was done by taking Salagame A sub centre which is having 2404 population, and in any given set up nearly 50% of the population is more than 30 years, i.e. it will be around 1202, 40% of the 1202 will be 480. According to NPCDCS guidelines 40% of the individuals need to be screened in any set up.10
A pretested semi structured questionnaire based on Indian diabetic risk score and other variables was designed consisting of the following details- age, sex, physical activity, family history of diabetes and applied to the participants. Waist circumference was measured using non stretchable tape to the nearest 0.1 cm, at the midpoint between lowest rib and the highest point of iliac crest at the end of expiration. Hip circumference was measured with a same tape to the nearest 0.1 cm at the widest part of the hips; usually this corresponds to the groin level for women and about 2-3 inches below the navel in men. Other socio demographic details were collected along with that weight, height and hip circumference measured and BMI is calculated and classified according to WHO BMI classification. After calculating IDRS score health education was given to high risk individuals regarding diet, exercise and further investigations to confirm their diabetic status.
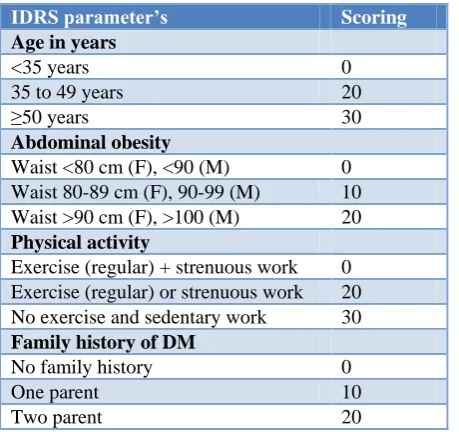
Table 1: IDRS parameter’s and scoring.
IDRS parameter’s Scoring
Age in years
<35 years 0
35 to 49 years 20
≥50 years 30
Abdominal obesity
Waist <80 cm (F), <90 (M) 0 Waist 80-89 cm (F), 90-99 (M) 10 Waist >90 cm (F), >100 (M) 20
Physical activity
Exercise (regular) + strenuous work 0 Exercise (regular) or strenuous work 20 No exercise and sedentary work 30
Family historyof DM
No family history 0
One parent 10
Two parent 20
RESULTS
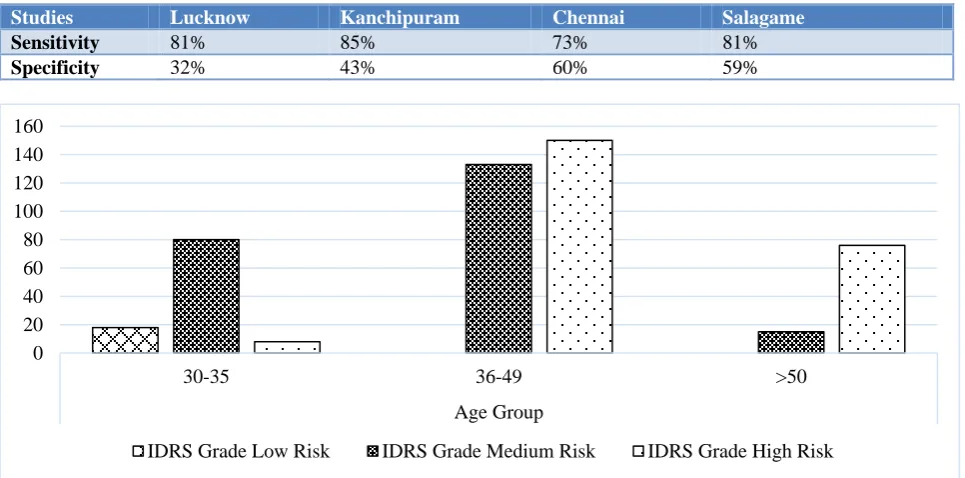
Among the respondents 256 (53.4%) were males and 224 (46.6%) were females. We had stratified the age group of the respondents according to IDRS and 106 (22.08%) were in the age group of 30 to 35 years, 283 (58.95%) were in the age group of 36-49 years and 91 (18.95%) were ≥50 years.
According to IDRS 234 (48.75%) respondents had score >50 (high risk) and 228 (47.5%) respondents had score between 30-50 (moderate risk). While 18 (3.75%) respondent had score <30 (low risk). Most of participants were instead of are between 36-49 years age group, and same age group is having highest number of individuals
with high risk for development of type 2 diabetes mellitus (Figure 1).
Among the respondents 256 (53.4%) were males and 224 (46.6%) were females. Most of the respondents had completed their primary school 164 (34.17%), 140 (29.7%) were illiterates, 28 (5.84%) were completed their graduation. 226 (47.1%) of the study subjects were from lower middle class, 180 (37.5%) were from upper middle class. 218 (45.4%) of the participants were housewives by occupation and 203 (42.3%) were farmers (Table 2).
Table 2: Distribution of respondents according to socio-demographic profile (n=480).
Frequency (%)
Gender
Male 256 (53.4) Female 224 (46.6)
Literacy status
Illiterate 140 (29.17) Primary 164 (34.17) Higher secondary 148 (30.8) Graduate 28 (5.84)
Socio economic status
Upper 24 (05)
Upper middle 180 (37.5) Lower middle 226 (47.1) Upper lower 38 (7.9)
Lower 12 (2.5)
Occupation
Farmer 203 (42.3) Housewife 218 (45.4) Labourer 23 (4.8) Others 36 (7.5)
Table 3: Physical activity wise distribution of IDRS and RBS among study population (n=480).
Physical activity Frequency Low risk Medium risk High risk RBS (>200 mg/dl)
Sedentary 82 (17.08) 0 (00) 20 (24.4) 62 (75.6) 34 (41.4)
Moderate 321 (66.66) 20 (6.5) 164 (51.09) 137 (42.41) 51 (15.8)
Strenuous 77 (16.04) 0 (00) 43 (56) 34 (44) 14 (19)
Total 480 20 (4.16) 227 (47.29) 233 (48.54) 99
Table 4: BMI wise distribution of IDRS and RBS among study population (n=480).
BMI (kg/m2) Frequency Low IDRS Medium IDRS High IDRS RBS (>200 mg/dl)
Low 24 (05) 00 (00) 24 (100) 00 (00) 00 (00)
Normal 240 (50) 12 (5) 156 (65) 72 (30) 24 (10)
Pre-obese 144 (30) 9 (6.25) 36 (25) 99 (68.75) 39 (27.08)
Obese 48 (10) 00 (00) 16 (36.6) 32 (63.4) 20 (45.5)
Morbid obese 24 (05) 00 (00) 00 (00) 24 (100) 16 (66.6)
Total 480 21 (4.4) 232 (48.3) 227 (47.3) 99
Among study subjects most of them were belonging to moderate physical activity category, 82 (17.08%) of the
were having RBS >200 mg/dl. 321 (66.66%) participants were doing moderate work, among them 137 (42.41%) were having high IDRS score in that 51 (15.8%) were having high blood sugar levels (p-0.018%) (Table 3).
Body mass index distribution according to WHO guidelines, all morbid obese individuals were having high IDRS score i.e. 24 (100%) and 66.6% of them having abnormal RBS levels. 45.5% of the obese individuals
having RBS >200 mg/dl (P-0.005%) (Table 4). 168 (35%) of the participants were having abdominal circumference in the range of 90-99 cm, among these 105 (62.5%) were having high IDRS score and in that 17 (10%) were having RBS >200 mg. 58 (12.08%) of the participants having abdominal circumference >100, and all of them had high IDRS score and abnormal RBS. (Table 5).
Table 5: Abdominal obesity wise distribution of IDRS and RBS among study population (n=480).
Abdominal
obesity in CM Frequency Low IDRS Medium IDRS High IDRS RBS (>200 mg/dl)
<80 101 (21.04) 15 (14.8) 86 (85.2) 0 00 (00)
80-89 153 (31.88) 5 (3.26) 76 (49.67) 72 (47.05) 00 (00)
90-99 168 (35) 00 (00) 63 (37.5) 105 (62.5) 17 (10)
>100 58 (12.08) 00 (00) 00 (00) 58 (100) 58 (100)
Total 480 20 (4.16) 225 (46.89) 235 (48.95) 75
Table 6: Comparing specificity and sensitivity in different studies.
Studies Lucknow Kanchipuram Chennai Salagame
Sensitivity 81% 85% 73% 81%
Specificity 32% 43% 60% 59%
Figure 1: Distribution of IDRS among different age groups of study population.
DISCUSSION
In this study, we used simplified IDRS for identifying high risk subjects in rural areas of Hassan, Karnataka. This is of great significance as use of such scoring system can prove to be a cost-effective tool for screening of diabetes. Further use of such a risk score would be of great help in developing countries like India where there is a marked explosion of diabetes and over half of them remain undiagnosed. 31.5% of study population had high risk score (>50) for diabetes. A similar type of study conducted by Mohan et al found 43% of study population in the high risk group and another study by Gupta et al found 19% of study population in the rural Tamil Nadu to
be in the high risk group.9,11 When compared with sensitivity and specificity of other studies with our study, it was found that sensitivity almost same as that of study conducted in Chennai rural area, study from Kanchipurum and Lucknow (Table 6).
Various studies in the west used different diabetes risk scores, based on simple anthropometric, demographic and behavioural factors to detect undiagnosed diabetes.12,13 We also used diabetes risk score suitable for detecting undiagnosed diabetes in South Asia. The risk score used in this study are those recommended by American Diabetes Association.14
0 20 40 60 80 100 120 140 160
30-35 36-49 >50
Age Group
In our study we also found that people with lower body mass index (BMI) had lower chance of being in the higher group in the IDRS. According to the study conducted by Gupta et al similar findings were seen in rural Tamil Nadu.15 Hypertension is an important non-communicable disease and in our study we found that people without hypertension had lower chance of being in the higher IDRS group. We also had taken into account hip circumference as the predictor of IDRS category and it was found to be a significant predictor for assessing the IDRS.
Arun et al conducted a cross sectional study among urban and rural population of Lucknow to access IDRS. Out of 820 subjects, the findings are 555 (67.7%) of subjects were in moderate risk IDRS category while 143 (17.4%) were in low risk and only 122 (14.9%) were in high risk IDRS category. Prevalence of diabetes mellitus was highest in high risk IDRS category (47.5%).16
CONCLUSION
This study estimates the usefulness of simplified Indian diabetes risk score for identifying high risk diabetic subjects in the community. As the study finds that percentage random blood glucose is more among participants of high IDRS, thus a simple IDRS tool can be used in the field for mass screening and early intervention. Use of IDRS can make mass screening for diabetes in India more cost effective.
ACKNOWLEDGEMENTS
We extend our sincerest thanks to study subjects, interns and students who helped in data collection and all the staff of community medicine department for their valuable advice.
Funding: No funding sources Conflict of interest: None declared
Ethical approval: The study was approved by the Institutional Ethics Committee
REFERENCES
1. World Health Organization. Global report on diabetes. 2016 [Online] [cited 2016Aug17]. Available at http://apps.who.int/iris/bitstream/ 10665/204871/1/9789241565257_eng.pdf?ua=1&ua =1. Accessed on 10 October 2017.
2. World Health Organization. Global Status Report on non-communicable disease, 2010.
3. Sharma K. Burden of non-communicable diseases in India: Setting priority for action. Int J Med Sci Public Health. 2013;2(1):7-11.
4. Mohan V, Sandeep S, Deepa R, Shah B, Varghese C. Epidemiology of type 2 diabetes: Indian scenario. Indian J Med Res. 2007;125:217-30.
5. Glucose tolerance. In: Gan D, editor. Diabetes atlas. 4th ed. International Diabetes Federation. Belgium: International Diabetes Federation; 2009: 1-105. 6. Ramachandran A, Snehalatha C, Kapur A, Vijay V,
MohanV, Das AK, et al. Diabetes Epidemiology Study Group inIndia (DESI). High prevalence of diabetes and impairedglucose tolerance in India: National Urban Diabetes Survey. Diabetologia. 2001;44:1094-101.
7. Anjana RM, Ali MK, Pradeepa R, Deepa M, Datta M, Unnikrishnan R, et al. The need for obtaining accurate nationwide estimates of diabetes prevalence in India - Rationale for a national study on diabetes. Indian J Med Res. 2011;155:369-80. 8. Wild S, Roglic G, Green A, Sicree R, King H.
Global prevalence of diabetes: Estimates for the year 2000 and projections for 2030. Diabetes Care. 2004;27:1047-53.
9. Sicree R, Shaw J, Zimmet P. Diabetes and impaired glucose tolerance. In: Gan D, editor. Diabetes Atlas. International Diabetes Federation. 3rd ed. Belgium: International Diabetes Federation; 2006: 15-103. 10. Ministry of Health & Family welfare. National
Programme for Prevention and Control of Cancer, Diabetes, Cardiovascular Diseases & Stroke (NPCDCS): operational guidelines [document on the Internet]. New Delhi: Government of India; 2010. Available at: http://health.bih.nic.in/Docs/ Guidelines-NPCDCS.pdf. Accessed on 12 December 2012.
11. Mohan V, Sandeep S, Deepa R, Shah B, Varghese C. Epidemiology of type-2 diabetes: Indian Scenario Indian J Med Res. 2007;(125):217-30.
12. Gupta SK, Singh Z, Purty AJ, Kar M, Vedapriya DR, Mahajan P, et al. Diabetes Prevalence and its Risk Factors in Rural area of Tamilnadu. Ind J Comm Med. 2010;35(3):396-9.
13. Lindstrom J, Tuomilehto J. The diabetes risk score: a practical tool to predict type 2 diabetes risk. Diabetes Care. 2003;26:725-31.
14. Spijkerman AM, Yuyun MF, Griffin SJ, Dekker JM, Nijples g, Wareham NJ. The performance of a risk score as a screening test for undiagnosed hyperglycemia in ethnic minority groups:Data from the 1999 health survey for England. Diabetes Care. 2004;27:116-22.
15. American Diabetes Association for identifying high risk individuals. Available from: http:// www.diabetes.org/risk_test.jsp. Accessed on 20 June 2012.
16. Arun A, Srivastava JP, et al Indian diabetes risk score (IDRS), a strong predictor of diabetes mellitus: A cross sectional study among urban and rural population of Lucknow. IJAR. 2015;1(7):135-8.