The Value Of Item Response
Theory In Invariance Testing
Nico Martins, University of South Africa, South Africa
ABSTRACT
The goal of the current study was to assess the Employee Engagement Instrument (EEI) from an item response theory (IRT) perspective, with a specific focus on measurement invariance for annual turnover. The sample comprised 4 099 respondents from all business sectors in South Africa. This article describes the logic and procedures used to test for factorial invariance across groups in the context of construct validation. The procedures included testing for configural and metric invariance in the framework of multiple-group confirmatory factor analysis (CFA).
The results confirmed the factor analytic structure of the model fit for some of the individual scales of the EEI. The measurement invariance of the EEI as a function of annual turnover was confirmed. However, the results indicated that the EEI needs to be refined for future research.
Keywords: Invariance; Employee Engagement; Measurement Equivalence; Configural Invariance
INTRODUCTION
he validation of assessment instruments is a vital prerequisite in most fields such as psychology, education, training, human resources and other related behavioural fields. In most cases, assessment instruments are tested in a single organisation or in different organisations in one country (Abrams, Lee, Brown, & Carr, 2015; Martins & Da Veiga, 2015; Martins, 2014; Moerdyk, 2009) for validity and reliability for the total population. The validation of assessment instruments is generally not applied among homogeneous groups (i.e. one group with the same gender, language, qualifications or national culture) or the same context (see Egri, 2013; Fahr, Cannella, & Lee, 2006; Johns, 2006; Rousseau & Fried, 2001; Tsui, 2006; Whetten, 2009). When comparing groups, researchers often assume that the assessment instrument measures the same psychological construct in all groups or operates exactly in the same way for each group under investigation (Byrne, 2004; Dimitrov, 2010; Martins, 2014; Milfont & Fischer, 2010; Nel & Boshof, 2014; Rock, Werts, & Flaugher, 1978; Tay, Meade, & Cao, 2015). Milfont and Fischer (2010: 112) summarise this research dilemma as follows: “Despite its appeal, this assumption is often not justified and needs to be tested.” According to Meiring, Van de Vijver, Rothman, and Barrick (2005) and Moerdyk (2009), South African researchers have to consider the diverse South African population in measurement. This observation is supported by many studies reporting on measurement equivalence (ME) testing across different groups, which concluded either partial invariance or non-invariance (e.g. see Dawson, Sotelo, Roesch & Klonoff, 2014; González & Jenkins, 2014; Horn & McArdle, 1992; Spurk, Abele, & Volmer, 2015). According to Strasheim (2011: 38) and Steenkamp and Baumgartner (1998:78), using instruments that are not invariant across groups may lead to invalid findings, which may limit the usefulness of the study or measurement.
and differences between these methods, as well as when it is best to use each method and the many different ways in which each method can be applied (e.g. see Meade & Lautenschlarer, 2004; Raju et al., 2002; Reise et al., 1993). Tay et al. (2015) recommend that researchers use both CFA and IRT whenever possible to ensure the best results.
A methodology for testing assessment instruments across groups is the testing of factorial invariance (Reio & Shuck, 2015). According to Dimitrov (2010), testing for factorial invariance across groups is often loosely applied (or not at all) in studies dealing with the validation of assessment instruments in counselling and education. Researchers who test for invariance such as Samuel, South, and Griffin (2015) explain the need to examine for measurement equivalence, or invariance, which would indicate that the scores on the measure have the same meanings for men and women (i.e. different groups) in validating the Five Factor Personality Scale. La Greca, Ingles, Lai, and Marco (2015) also applied factorial invariance to examine the factorial invariance and latent mean differences of the Social Anxiety Scale for Adolescents across gender and age groups in Hispanic American adolescents. Their findings support Moerdyk’s (2009) observation that it is especially important in a multicultural country such as South Africa, with its numerous language and ethnic groups, to take differences into account in order to conduct fair assessments.
BACKGROUND
Employee engagement is a much-debated topic among people across business, academia and government (Imandin, Bisschoff, & Botha, 2014; Martins & Ledimo, 2016; Robbinson & Gifford, 2014). A study of nearly 8 000 business units in 36 companies by Harter, Schmidt, and Hayes (2002) found that those companies whose employees had high average levels of engagement also had higher levels of customer satisfaction, were more productive, brought in higher profits and had lower levels of staff turnover and accidents than those at other companies. These positive perceptions of employee engagement were also reflected by Robbinson and Gifford (2014) in their study. Some of the contributors argued (p. 1) “that employee engagement brings big benefits to organisations. It is an excellent vehicle for driving culture change, and is good for employees, too. However, employee engagement is hard work and requires more than a one-off ‘initiative’; sustained effort is needed over a long period of time, and there are no ‘quick fixes’ “. Others stated (p. 3) that “as a believer in the whole debate about the importance of engagement and business performance, … [to] me, it has always seemed obvious that the way a workforce feels about their place of work will materially affect the performance of that organisation. This is particularly relevant in service organisations, where customers are at the receiving end of good or bad attitudes. But, it is also relevant where businesses make things, or exist for other purposes.” In light of the introduction, it makes business sense to ensure that the assessment tool applied to measure employee engagement is not only valid and reliable for a population, but also portrays factorial invariance across the groups included in an assessment to ensure that researchers have confidence that they are measuring what they are supposed (or claim) to measure.
measure to determine if the construct of engagement is invariant across different business contexts, as reflected by annual turnover.
As such, this study might provide deeper insight into the measurement of engagement of employees across different size organisations that might be significant for theoretical advances in employee engagement research and for practitioners in particular. This is one of the first studies to report on the testing of ME for engagement, in particular in a multicultural society.
RESEARCH OBJECTIVES
The main objectives of this study were as follows: (1) to confirm the factor analytic structure of the measure; (2) to determine the model fit for the individual scales of the EEI; and (3) to determine the measurement invariance of the EEI as a function of annual turnover.
Research Approach
The researchers initially applied exploratory factor analysis to evaluate the factorial structure of the instrument and Cronbach’s alpha to determine/ establish the internal reliability of the scale and subscales. The internal reliability and construct validity were again confirmed in a second study by means of confirmatory factor analysis (CFA) (Nienaber & Martins, 2015). In order to further unpack the questionnaire’s factorial analytic structure, it was decided to conduct an IRT analysis. IRT can be described as a collection of models designed to statistically analyse items in the scale for the purposes of test development, validation and scoring (source). It is considered a technique that offers several advantages over the traditional classical test theory (CTT) approach (Ho Yu, 2010), including the following:
• In CTT, the unit of analysis is typically an aggregate (e.g. a summed or mean test score). IRT, as the name suggests, focuses on an item level and assesses how said item is related to an estimated latent trait (Fan, 1998).
• Owing to the fact that IRT calculations are said to be sample or test independent, item parameters can be compared across samples. Conversely, CTT calculates an individual’s score in the context of a specific questionnaire and item properties only hold true for that sample.
• IRT also calculates item-independent respondent measures. This implies that a group of test takers can complete different sets of items, yet be measured on the same scale of performance.
• As an item level analysis technique, IRT can provide a measurement of individual error, as opposed to CTT’s total standard error of measurement.
In addition to the advantages outlined above, there is also an important consideration that relates specifically to the Likert scale categorical response format of the EEI. In CTT, Likert scale data is often assumed and treated as an interval or ratio level of measurement, and unit increases in the rating scale are assumed to be equal (Bond & Fox, 2007). Many researchers find this assumption worrisome, given the fact that an equal distance between numbers is not a true reflection of Likert data (Linacre, 2005). If we hold Likert scale items to the ordinal level of measurement, then this would render parametric statistics untenable.
The mathematical model behind IRT transforms ordinal data into a linear and equal interval measure (Boone, Staver, & Yale, 2014). This new “person score” can be applied to parametric techniques such as unidimensional or multidimensional factor analyses without violating the assumptions typically held by CTT.
Establishing Measurement Equivalence
is on comparing the construct level of groups, DIF focuses on the functioning of items across groups. This is not to suggest that test/scale score equivalence is irrelevant, as one can determine the extent to which DIF items cumulatively impact on observed mean differences across groups (i.e. differential test functioning [DTF]).
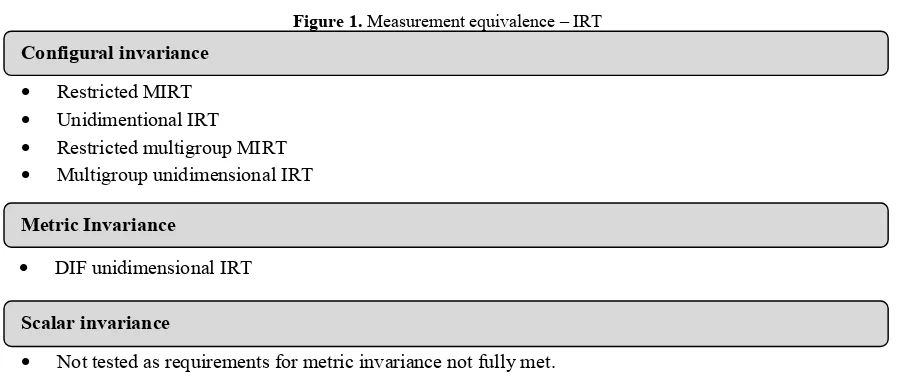
A bottom-up and progressively restricted methodology was adopted in this research to test for measurement invariance. In other words, the invariance requirements at each step needed to be met in order to move on to the higher-order form of equivalence (Dimitrov, 2010). The steps followed in order to determine ME are graphically depicted in Figure 1 and described below (Steenkamp & Baumgartner, 1998; Tay et al., 2015).
Configural Invariance
Configural or form invariance is the initial and most simple form of equivalence. In order to demonstrate configural invariance, the researcher needs to show that a factor is unidimensional across groups. Fundamentally, it is necessary to control for the underlying construct/latent trait (Cheung & Rensvold, 2002, Hair, Black, Babin, & Anderson, 2010).
Configural invariance was conducted to support local independence by establishing that observed item responses are uncorrelated after the following analyses:
• A restricted MIRT and/or unidimensional model (CFA equivalent) was conducted on each group within each DIF variable. In other words, the overall sample was split into two, three or four, depending on the number of subgroups. Separate models were conducted for annual turnover, and factor loadings were examined to assess if there were any significant differences.
• Thereafter, restricted multigroup MIRT modelling was conducted – this analysed all groups within the same model to determine differences in terms of factor loadings and means. It is important to note that only items loading on designated factors were freely estimated similar to multifactor CFA analysis. This output helps to determining whether form equivalence exists for the total model of engagement. • In order to identify specific areas of non-invariance, each subscale was analysed separately to examine
differences that were flagged in the previous step. Unidimensional multigroup analyses also provided item-level statistics to assess the requirement of local independence.
Figure 1. Measurement equivalence – IRT
RESEARCH PROCEDURE
The database of a research company was used in this study. The database in question consisted of approximately 285 000 businesspeople from various industries – including government institutions, sizes of business and who occupies different roles, reflecting the profile of the South African working population. The database was permissioned – that is, everybody in the database gave their permission to participate in online surveys. An electronic survey, administered by the iFeedback.co.za online data collection portal, was used by means of a mass e-mail invitation over a period of three weeks. Each potential participant received a personalised e-mail stating the purpose of the investigation and that the survey would take approximately 15 minutes to complete, and inviting them to participate in the survey on a voluntary, confidential and anonymous basis (Martins, 2015).
Population and Sampling
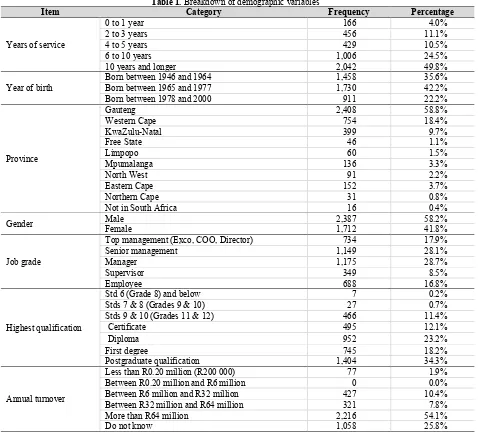
The majority of respondents resided in Gauteng (58.8%), the business hub of South Africa, and had been working at their company for over six years (74.3%).
Notably, 77.8% of the respondents were born before 1977, making them 38 years and older. In light of this information, it makes sense that many occupied executive, senior or management level positions at their organisation. A disproportionate percentage reported having a postgraduate qualification, while 54% also indicated that their organisation’s annual turnover was more than R64 million. This implies that the sample consisted of a large number of formally educated and older individuals who held senior positions at companies.
The demographic items received few missing responses. Specific questions were asked about each industry to determine the exact sector of the respondents’ organisations. These garnered the highest volume of missing responses.
Metric Invariance
Scalar invariance • Restricted MIRT • Unidimentional IRT • Restricted multigroup MIRT • Multigroup unidimensional IRT
• DIF unidimensional IRT
Table 1. Breakdown of demographic variables
Item Category Frequency Percentage
Years of service
0 to 1 year 166 4.0%
2 to 3 years 456 11.1%
4 to 5 years 429 10.5%
6 to 10 years 1,006 24.5%
10 years and longer 2,042 49.8%
Year of birth
Born between 1946 and 1964 1,458 35.6%
Born between 1965 and 1977 1,730 42.2%
Born between 1978 and 2000 911 22.2%
Province
Gauteng 2,408 58.8%
Western Cape 754 18.4%
KwaZulu-Natal 399 9.7%
Free State 46 1.1%
Limpopo 60 1.5%
Mpumalanga 136 3.3%
North West 91 2.2%
Eastern Cape 152 3.7%
Northern Cape 31 0.8%
Not in South Africa 16 0.4%
Gender Male Female 2,387 1,712 58.2% 41.8%
Job grade
Top management (Exco, COO, Director) 734 17.9%
Senior management 1,149 28.1%
Manager 1,175 28.7%
Supervisor 349 8.5%
Employee 688 16.8%
Highest qualification
Std 6 (Grade 8) and below 7 0.2%
Stds 7 & 8 (Grades 9 & 10) 27 0.7% Stds 9 & 10 (Grades 11 & 12) 466 11.4%
Certificate 495 12.1%
Diploma 952 23.2%
First degree 745 18.2%
Postgraduate qualification 1,404 34.3%
Annual turnover
Less than R0.20 million (R200 000) 77 1.9% Between R0.20 million and R6 million 0 0.0% Between R6 million and R32 million 427 10.4% Between R32 million and R64 million 321 7.8%
More than R64 million 2,216 54.1%
Do not know 1,058 25.8%
Research Questionnaire
A Likert scale format was utilised to obtain information on employee engagement; the answers ranged along a five-point scale:
1 = strongly disagree; 2 = disagree; 3 = unsure; 4 = agree; 5 = strongly agree
The reliability results are reported below:
Table 2. Reliability statistics for the six extracted components
Original questionnaire structure
Description Number of items Cronbach’s alpha
Team 11 0.933
Organisational Satisfaction 9 0.942
Immediate Manager 7 0.934
Organisational Commitment 12 0.932
Strategy and Implementation 7 0.904
Customer Service 4 0.813
All dimensions 50 0.973
Source: Martins & Ledimo (2016)
Analysis shows that the majority of respondents answered with options 3, 4 or 5. Options 1 and 2 were rarely selected by respondents. Items were negatively skewed with reported mean values of +- 3.5 to 4. Certain items received a broader range of responses, while others (e.g. those in the Team subscale) were more likely to generate positive answers of “agree” or “strongly agree”.
No items reported missing data.
RESULTS
Unrestricted and Restricted Exploratory Factor Analysis (EFA)
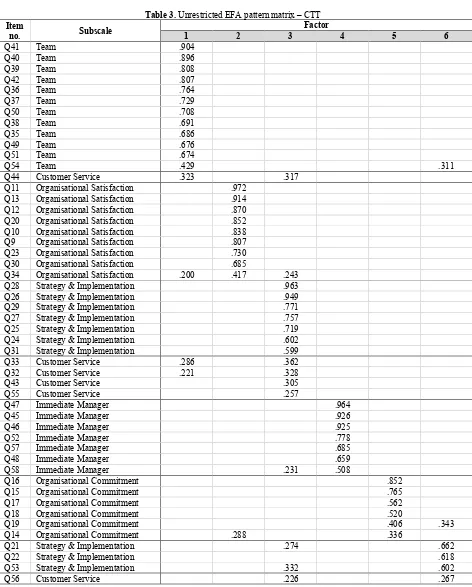
EFA was conducted in SPSS 23 for the purposes of reviewing the underlying factor structure of the questionnaire. Both unrestricted (all items included) and restricted (only items for one subscale included) analyses were conducted. The method of extraction for both unrestricted and restricted EFAs was maximum likelihood with Promax Kappa 4 rotation. The number of extracted factors was based upon eigenvalues greater than 1. Factor loadings were sorted by size with coefficients smaller than 0.20 suppressed.
Kaiser-Meyer-Olkin’s measure was performed and demonstrated sampling adequacy with all values greater than 0.86. Bartlett’s test of sphericity was also conducted with p < 0.001 across all EFA analyses.
The restricted EFAs showed a single factor solution for each subscale, explaining between 47% and 67% of the total variance. Communalities were all above the accepted cut-off point of 0.50 (Hair et al., 2010).
Table 3. Unrestricted EFA pattern matrix – CTT
Item
no. Subscale
Factor
1 2 3 4 5 6
Q41 Team .904
Q40 Team .896
Q39 Team .808
Q42 Team .807
Q36 Team .764
Q37 Team .729
Q50 Team .708
Q38 Team .691
Q35 Team .686
Q49 Team .676
Q51 Team .674
Q54 Team .429 .311
Q44 Customer Service .323 .317
Q11 Organisational Satisfaction .972 Q13 Organisational Satisfaction .914 Q12 Organisational Satisfaction .870 Q20 Organisational Satisfaction .852 Q10 Organisational Satisfaction .838 Q9 Organisational Satisfaction .807 Q23 Organisational Satisfaction .730 Q30 Organisational Satisfaction .685
Q34 Organisational Satisfaction .200 .417 .243 Q28 Strategy & Implementation .963 Q26 Strategy & Implementation .949 Q29 Strategy & Implementation .771 Q27 Strategy & Implementation .757 Q25 Strategy & Implementation .719 Q24 Strategy & Implementation .602 Q31 Strategy & Implementation .599
Q33 Customer Service .286 .362
Q32 Customer Service .221 .328
Q43 Customer Service .305
Q55 Customer Service .257
Q47 Immediate Manager .964
Q45 Immediate Manager .926
Q46 Immediate Manager .925
Q52 Immediate Manager .778
Q57 Immediate Manager .685
Q48 Immediate Manager .659
Q58 Immediate Manager .231 .508
Q16 Organisational Commitment .852
Q15 Organisational Commitment .765
Q17 Organisational Commitment .562
Q18 Organisational Commitment .520
Q19 Organisational Commitment .406 .343
Q14 Organisational Commitment .288 .336
Q21 Strategy & Implementation .274 .662
Q22 Strategy & Implementation .618
Q53 Strategy & Implementation .332 .602
Based on the results of the unrestricted EFA, six factors were identified and labelled as follows:
• Factor 1: Team (with one cross-loading item from Customer Service) • Factor 2: Organisational Satisfaction
• Factor 3: Strategy and Implementation (with 4 items from Customer Service) • Factor 4: Immediate Manager
• Factor 5: Organisational Commitment
• Factor 6: Mixed – three items from Strategy and Implementation and one cross-loading item from Customer Service
It is evident that four out of the six factors were aligned to the theoretical factor structure of the questionnaire. However, items from Strategy and Implementation, and Customer Service did not load on to distinct factors; instead, they showed mixed results with items loading on non-designated factors. This is in line with the results of the restricted EFA that showed that Customer Service explained the lowest total variance out of the six subscales (47%).
Factor 6 reflects a number of items from Strategy and Implementation and Customer Service that centred around the strategy and future of the organisation. Item 56 (”My performance is linked to the strategy of the organisation”) was theoretically clustered in Strategy and Implementation, and it thus made sense to move it to this dimension, owing to the fact that it loaded strongly on to said factor.
The items on factor 3 did not demonstrate any overt similarities. The group of items from Strategy and Implementation focused on accountability and encouragement. The group of items from Customer Service focused on going above and beyond for clients by providing feedback and exceeding expectations.
On factor 1, all items except one belonged to Team. The Customer Service item (”We identify the right opportunities for our customers”) could have loaded here owing to the use of the term ”we” – implying a team approach to servicing clients. However, this item was problematic in that it is cross-loaded on to both factor 1 and factor 3.
As discussed above, conducting an EFA within the CTT framework can be considered problematic, as ordinal data is treated as equal interval data. Also, Brown (2005) found that EFA is plagued by statistical artefacts such as overfactoring and Heywood cases, especially when a large number of items are factor analysed at the same time. The questionnaire data was thus re-examined from an IRT perspective. IRT analysis was conducted from both a unidimensional and multidimensional perspective – although multidimensional item response theory (MIRT) was the primary focus.
Unidimensional IRT analysis
All IRT analysis was conducted using IRTPRO version 3 for Windows. IRTPRO (item response theory for patient-reported outcomes) models item calibration and scoring based on unidimensional and multidimensional versions of widely used IRT response functions.
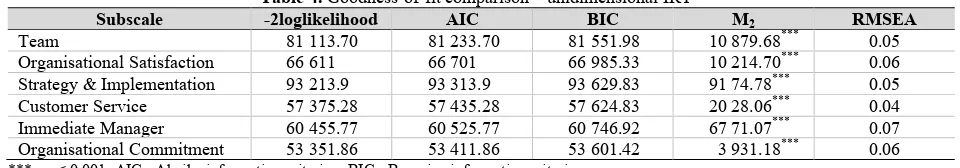
The results demonstrated that the IRT factor structure followed the same pattern evident in the restricted EFA. Table 4 provides a comparison of the six unidimensional models in terms of goodness of fit:
• -2loglikelihood is used as a relative comparison between competing models to assess fit. A smaller value is preferable. AIC and BIC are similarly interpreted.
• M2is a statistic that can be used as a proxy for chi-squared. Smaller values indicate a higher degree of
model fit. A significant M2 value (p < 0.05) is an indicator of model misfit.
• The root mean square error of approximation (RMSEA) is a calculation based on the chi-squared statistic. Values closer to 0 indicate good model fit (<0.05), while values closer to 1 indicate misfit.
From the results below, it is evident that all the subscales demonstrated some degree of model misfit.
Table 4. Goodness-of-fit comparison – unidimensional IRT
Subscale -2loglikelihood AIC BIC M2 RMSEA
Team 81 113.70 81 233.70 81 551.98 10 879.68*** 0.05 Organisational Satisfaction 66 611 66 701 66 985.33 10 214.70*** 0.06 Strategy & Implementation 93 213.9 93 313.9 93 629.83 91 74.78*** 0.05 Customer Service 57 375.28 57 435.28 57 624.83 20 28.06*** 0.04 Immediate Manager 60 455.77 60 525.77 60 746.92 67 71.07*** 0.07 Organisational Commitment 53 351.86 53 411.86 53 601.42 3 931.18*** 0.06 *** - p < 0.001; AIC - Akaike information criterion; BIC - Bayesian information criterion
Unrestricted MIRT
The unrestricted multidimensional IRT (MIRT) analysis included all items of the scale-based questions and can be considered analogous to a CTT unrestricted EFA. For the purposes of the current study, it was compared to the outcomes obtained from the EFA to determine if the EEI’s factor structure remained similar when analysed from an IRT perspective.
Item parameter estimation for the MIRT models throughout this study was calculated according to the Metropolis-Hastings Robbins-Monro (MHRM) method, recommended for analyses with more than two factors or dimensions (Cai, 2010).
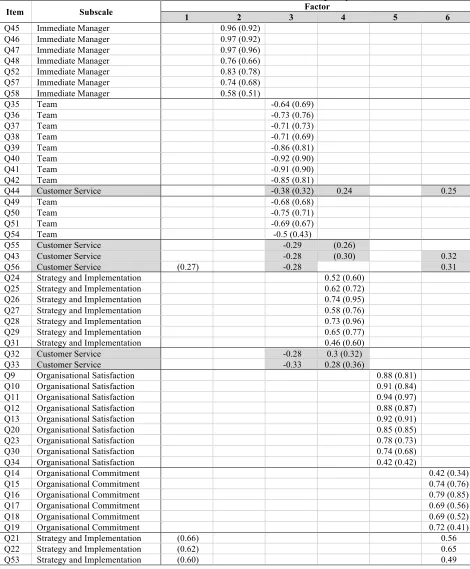
Table 5. Unrestricted EFA and unrestricted MIRT factor loading comparison
Item Subscale 1 2 3 Factor 4 5 6
Q45 Immediate Manager 0.96 (0.92) Q46 Immediate Manager 0.97 (0.92) Q47 Immediate Manager 0.97 (0.96) Q48 Immediate Manager 0.76 (0.66) Q52 Immediate Manager 0.83 (0.78) Q57 Immediate Manager 0.74 (0.68) Q58 Immediate Manager 0.58 (0.51)
Q35 Team -0.64 (0.69)
Q36 Team -0.73 (0.76)
Q37 Team -0.71 (0.73)
Q38 Team -0.71 (0.69)
Q39 Team -0.86 (0.81)
Q40 Team -0.92 (0.90)
Q41 Team -0.91 (0.90)
Q42 Team -0.85 (0.81)
Q44 Customer Service -0.38 (0.32) 0.24 0.25
Q49 Team -0.68 (0.68)
Q50 Team -0.75 (0.71)
Q51 Team -0.69 (0.67)
Q54 Team -0.5 (0.43)
Q55 Customer Service -0.29 (0.26)
Q43 Customer Service -0.28 (0.30) 0.32
Q56 Customer Service (0.27) -0.28 0.31
Q24 Strategy and Implementation 0.52 (0.60) Q25 Strategy and Implementation 0.62 (0.72) Q26 Strategy and Implementation 0.74 (0.95) Q27 Strategy and Implementation 0.58 (0.76) Q28 Strategy and Implementation 0.73 (0.96) Q29 Strategy and Implementation 0.65 (0.77) Q31 Strategy and Implementation 0.46 (0.60)
Q32 Customer Service -0.28 0.3 (0.32)
Q33 Customer Service -0.33 0.28 (0.36)
Q9 Organisational Satisfaction 0.88 (0.81)
Q10 Organisational Satisfaction 0.91 (0.84)
Q11 Organisational Satisfaction 0.94 (0.97)
Q12 Organisational Satisfaction 0.88 (0.87)
Q13 Organisational Satisfaction 0.92 (0.91)
Q20 Organisational Satisfaction 0.85 (0.85)
Q23 Organisational Satisfaction 0.78 (0.73)
Q30 Organisational Satisfaction 0.74 (0.68)
Q34 Organisational Satisfaction 0.42 (0.42)
Q14 Organisational Commitment 0.42 (0.34)
Q15 Organisational Commitment 0.74 (0.76)
Q16 Organisational Commitment 0.79 (0.85)
Q17 Organisational Commitment 0.69 (0.56)
Q18 Organisational Commitment 0.69 (0.52)
Q19 Organisational Commitment 0.72 (0.41)
Q21 Strategy and Implementation (0.66) 0.56
Q22 Strategy and Implementation (0.62) 0.65
The metrics in Table 5 show a measure of correspondence between the EFA (CTT) results and the unrestricted MIRT. However, there were a few cases where factor loadings were not similar, or where items loaded on to different factors.
Restricted MIRT
Given the large degree of correspondence of the unrestricted MIRT to both the unrestricted EFA and the questionnaire’s theoretical structure, a restricted MIRT was conducted that prespecified the factor loadings. In other words, all non-relevant factor loadings were constrained to zero, thus adopting a purely confirmatory approach.
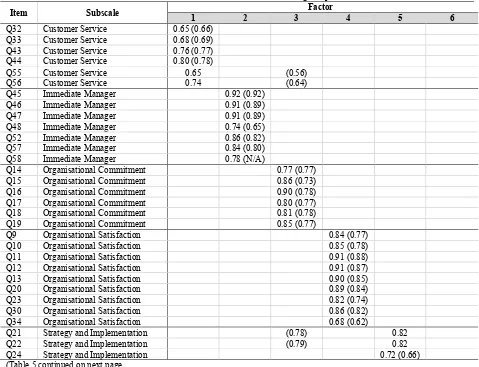
The restricted MIRT can be considered the IRT analogue to the confirmatory factor analysis (CFA) conducted in Martins (2015). The results of the analysis are depicted in Table 6 below. Factor loadings from the CFA are added in brackets. Where an item was excluded from the CFA analysis from Martins (2015), it contains “N/A” in brackets.
In the case of the restricted MIRT, items were assigned to scales as defined by the theoretical structure of the EEI. The results show a similar factor structure between the original CFA and IRT approaches, with differences primarily arising in the case where CFA items were assigned to different factors.
Table 6. CFA and restricted MIRT factor loading comparison
Item Subscale Factor
1 2 3 4 5 6
Q32 Customer Service 0.65 (0.66) Q33 Customer Service 0.68 (0.69) Q43 Customer Service 0.76 (0.77) Q44 Customer Service 0.80 (0.78)
Q55 Customer Service 0.65 (0.56)
Q56 Customer Service 0.74 (0.64)
Q45 Immediate Manager 0.92 (0.92) Q46 Immediate Manager 0.91 (0.89) Q47 Immediate Manager 0.91 (0.89) Q48 Immediate Manager 0.74 (0.65) Q52 Immediate Manager 0.86 (0.82) Q57 Immediate Manager 0.84 (0.80) Q58 Immediate Manager 0.78 (N/A)
Q14 Organisational Commitment 0.77 (0.77) Q15 Organisational Commitment 0.86 (0.73) Q16 Organisational Commitment 0.90 (0.78) Q17 Organisational Commitment 0.80 (0.77) Q18 Organisational Commitment 0.81 (0.78) Q19 Organisational Commitment 0.85 (0.77)
Q9 Organisational Satisfaction 0.84 (0.77) Q10 Organisational Satisfaction 0.85 (0.78) Q11 Organisational Satisfaction 0.91 (0.88) Q12 Organisational Satisfaction 0.91 (0.87) Q13 Organisational Satisfaction 0.90 (0.85) Q20 Organisational Satisfaction 0.89 (0.84) Q23 Organisational Satisfaction 0.82 (0.74) Q30 Organisational Satisfaction 0.86 (0.82) Q34 Organisational Satisfaction 0.68 (0.62)
Q21 Strategy and Implementation (0.78) 0.82
Q22 Strategy and Implementation (0.79) 0.82
Q24 Strategy and Implementation 0.72 (0.66)
(Table 6 continued)
Item Subscale 1 2 3 Factor 4 5 6
Q25 Strategy and Implementation 0.64 (0.65)
Q26 Strategy and Implementation 0.81 (0.78)
Q27 Strategy and Implementation 0.85 (0.85)
Q28 Strategy and Implementation 0.86 (0.82)
Q29 Strategy and Implementation 0.64 (0.65)
Q31 Strategy and Implementation 0.84 (0.84)
Q53 Strategy and Implementation (0.72) 0.77
Q35 Team 0.77 (0.66)
Q36 Team 0.79 (0.67)
Q37 Team 0.80 (0.74)
Q38 Team 0.79 (0.73)
Q39 Team 0.83 (0.75)
Q40 Team 0.85 (0.74)
Q41 Team 0.86 (0.76)
Q42 Team 0.83 (0.77)
Q49 Team 0.84 (0.79)
Q50 Team 0.80 (0.75)
Q51 Team 0.79 (0.74)
Q54 Team (0.37) 0.71
*1 – Customer Service; 2 – Immediate Manager; 3 – Organisational Commitment; 4 – Organisational Satisfaction; 5 – Strategy & Implementation; 6 - Team
At this stage, the results of the analysis established a similar pattern of factor loadings across the EFA, CFA and IRT approaches. This provides strong evidence of the factor analytic structure of the measure as well as model fit for the individual scales of the EEI. Next, the focus of the report will shift to the measurement invariance of the EEI in relation to turnover.
INVARIANCE TESTING: CONFIGURAL INVARIANCE
Most of the invariance analyses focused on invariance in specific personal characteristics such as gender, race, age and so forth, but seldom on a more business-related focus such as annual turnover.
A breakdown of the original response frequencies is provided in Table 1. The vast majority of respondents responded by selection a 5 or 6 for the turnover item. No respondents fell into the “Annual turnover more than R0.20 million but less than R6 million” category. For the purposes of the IRT analysis, “do not know” (6) was excluded, as these results were not relevant to the analysis. “Annual turnover less than R0.20 million” (1) and “Annual turnover more than R0.20 million but less than R6 million” (2) were excluded because of the relatively small sample sizes. Owing to the unbalanced size of the ”Annual turnover more than R64 million” (5) responses, a randomised selection of 500 cases (Tay et al., 2015) was used for analysis. The remaining three categories were recoded as follows:
1. Annual turnover more than R6 million but less than R32 million (small) 2. Annual turnover more than R32 million but less than R64 million (medium) 3. Annual turnover more than 64 million (large)
The following steps were followed to investigate measurement invariance in relation to annual turnover:
• Unidimensional analyses were conducted on each group within the annual turnover variable to assess factor loadings and goodness of fit between said groups.
• Multigroup analyses were also conducted on a unidimensional level. This was done in order to obtain more detailed item level metrics. The multigroup unidimensional models provide the baseline group against which the DIF analysis can be compared.
• The above three steps contributed towards an assessment of configural invariance. The last step, namely the DIF analysis, was conducted to provide evidence towards determining metric invariance. A multigroup DIF analysis was run on each subscale to determine the item differences between groups. The results of each DIF were compared to the corresponding baseline model to determine the presence of DIF (or DTF) at a model level.
Per Group Unidimensional Analyses: Turnover
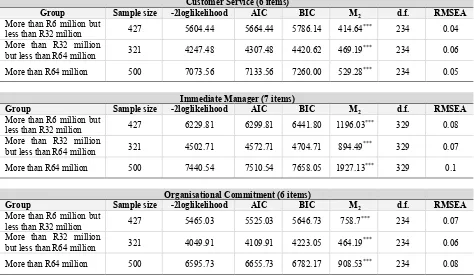
Table 7 provides a breakdown of goodness of fit of the unidimensional models run on each turnover group within each subscale. A total of 18 different models were analysed to account for the three categories within each of the six subscales.
Misfit was detected via the highly significant M2 indicators. The second turnover response category (”Annual turnover more than R32 million but less than R64 million”) reported a lower -2loglikelihood result, yet paradoxically a higher M2 result, relative to the other groups in each subscale. The RMSEA reported fit indices that were more indicative of good model fit. Overall, no single group reported better fit relative to the other turnover categories. Since the M2 statistic and -2loglikelihood are influenced by sample size, it is more prudent to place more weight on the RMSEA estimates (Hair et al., 2010). In this instance, a sample size of more than 500 was used. According to Tay et al. (2015), a sample size of more than 500 is suggested for IRT analysis.
Table 7. Goodness of fit comparison – turnover unidimensional analyses
Customer Service (6 items)
Group Sample size -2loglikelihood AIC BIC M2 d.f. RMSEA
More than R6 million but
less than R32 million 427 5604.44 5664.44 5786.14 414.64*** 234 0.04 More than R32 million
but less than R64 million 321 4247.48 4307.48 4420.62 469.19*** 234 0.06
More than R64 million 500 7073.56 7133.56 7260.00 529.28*** 234 0.05
Immediate Manager (7 items)
Group Sample size -2loglikelihood AIC BIC M2 d.f. RMSEA
More than R6 million but
less than R32 million 427 6229.81 6299.81 6441.80 1196.03*** 329 0.08 More than R32 million
but less than R64 million 321 4502.71 4572.71 4704.71 894.49*** 329 0.07
More than R64 million 500 7440.54 7510.54 7658.05 1927.13*** 329 0.1
Organisational Commitment (6 items)
Group Sample size -2loglikelihood AIC BIC M2 d.f. RMSEA
More than R6 million but
less than R32 million 427 5465.03 5525.03 5646.73 758.7*** 234 0.07 More than R32 million
(Table 7 continued)
Organisational Satisfaction (9 items)
Group Sample size -2loglikelihood AIC BIC M2 d.f. RMSEA
More than R6 million but
less than R32 million 427 6937.4 7027.40 7209.96 1749.76*** 567 0.07 More than R32 million
but less than R64 million 321 4873.52 4963.52 5133.23 2995.87*** 567 0.12 More than R64 million 500 8214.52 8304.52 8494.18 2027.73*** 567 0.07
Strategy & Implementation (10 items)
Group Sample size -2loglikelihood AIC BIC M2 d.f. RMSEA
More than R6 million but
less than R32 million 427 9624.11 9724.11 9926.95 1652.80*** 710 0.06 More than R32 million
but less than R64 million 321 7010.67 7110.67 7299.24 2078.77*** 710 0.08 More than R64 million 500 11318.00 11418.00 11628.73 1557.59*** 710 0.05
Team (12 items)
Group Sample size -2loglikelihood AIC BIC M2 d.f. RMSEA
More than R6 million but
less than R32 million 427 8279.56 8399.56 8642.97 2971.50*** 1044 0.07 More than R32 million
but less than R64 million 321 5753.48 5873.48 6099.76 3013.99*** 1044 0.08
More than R64 million 500 9916.00 10036.00 10288.88 3118.63*** 1044 0.06
Restricted multigroup MIRT: Turnover
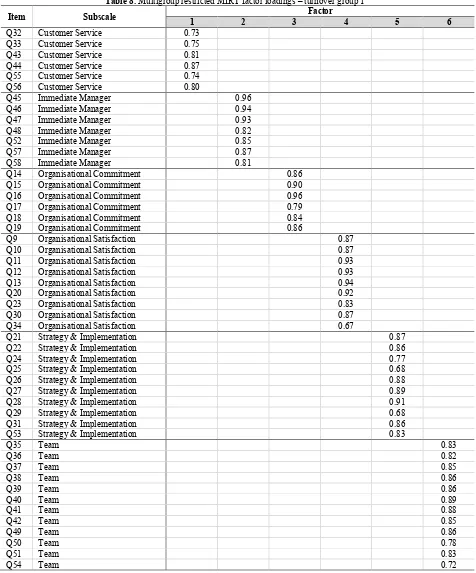
Within this restricted MIRT, all three turnover groups were included in one model, along with all 50 EEI items. For the purposes of analysis, turnover category 1 (“Annual turnover more than R6 million but less than R32 million”) was treated as the reference group, while turnover groups 2 and 3 were categorised as focal groups. The choice of reference group was arbitrary.
Table 8. Multigroup restricted MIRT factor loadings – turnover group 1
Item Subscale 1 2 3 Factor 4 5 6
Q32 Customer Service 0.73 Q33 Customer Service 0.75 Q43 Customer Service 0.81 Q44 Customer Service 0.87 Q55 Customer Service 0.74 Q56 Customer Service 0.80
Q45 Immediate Manager 0.96
Q46 Immediate Manager 0.94
Q47 Immediate Manager 0.93
Q48 Immediate Manager 0.82
Q52 Immediate Manager 0.85
Q57 Immediate Manager 0.87
Q58 Immediate Manager 0.81
Q14 Organisational Commitment 0.86 Q15 Organisational Commitment 0.90 Q16 Organisational Commitment 0.96 Q17 Organisational Commitment 0.79 Q18 Organisational Commitment 0.84 Q19 Organisational Commitment 0.86
Q9 Organisational Satisfaction 0.87
Q10 Organisational Satisfaction 0.87
Q11 Organisational Satisfaction 0.93
Q12 Organisational Satisfaction 0.93
Q13 Organisational Satisfaction 0.94
Q20 Organisational Satisfaction 0.92
Q23 Organisational Satisfaction 0.83
Q30 Organisational Satisfaction 0.87
Q34 Organisational Satisfaction 0.67
Q21 Strategy & Implementation 0.87
Q22 Strategy & Implementation 0.86
Q24 Strategy & Implementation 0.77
Q25 Strategy & Implementation 0.68
Q26 Strategy & Implementation 0.88
Q27 Strategy & Implementation 0.89
Q28 Strategy & Implementation 0.91
Q29 Strategy & Implementation 0.68
Q31 Strategy & Implementation 0.86
Q53 Strategy & Implementation 0.83
Q35 Team 0.83
Q36 Team 0.82
Q37 Team 0.85
Q38 Team 0.86
Q39 Team 0.86
Q40 Team 0.89
Q41 Team 0.88
Q42 Team 0.85
Q49 Team 0.86
Q50 Team 0.78
Q51 Team 0.83
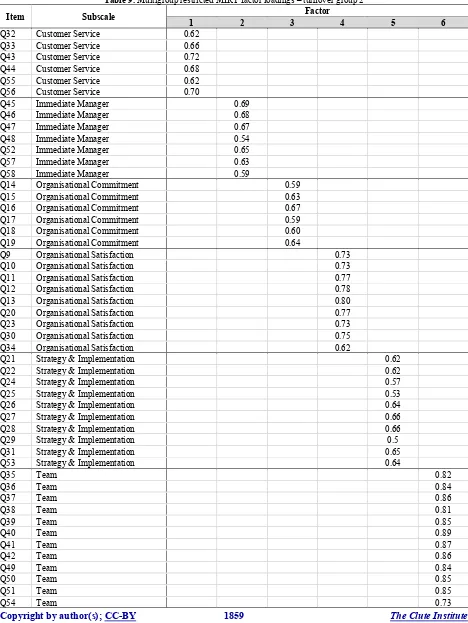
Table 9. Multigroup restricted MIRT factor loadings – turnover group 2
Item Subscale Factor
1 2 3 4 5 6
Q32 Customer Service 0.62 Q33 Customer Service 0.66 Q43 Customer Service 0.72 Q44 Customer Service 0.68 Q55 Customer Service 0.62 Q56 Customer Service 0.70
Q45 Immediate Manager 0.69
Q46 Immediate Manager 0.68
Q47 Immediate Manager 0.67
Q48 Immediate Manager 0.54
Q52 Immediate Manager 0.65
Q57 Immediate Manager 0.63
Q58 Immediate Manager 0.59
Q14 Organisational Commitment 0.59 Q15 Organisational Commitment 0.63 Q16 Organisational Commitment 0.67 Q17 Organisational Commitment 0.59 Q18 Organisational Commitment 0.60 Q19 Organisational Commitment 0.64
Q9 Organisational Satisfaction 0.73
Q10 Organisational Satisfaction 0.73
Q11 Organisational Satisfaction 0.77
Q12 Organisational Satisfaction 0.78
Q13 Organisational Satisfaction 0.80
Q20 Organisational Satisfaction 0.77
Q23 Organisational Satisfaction 0.73
Q30 Organisational Satisfaction 0.75
Q34 Organisational Satisfaction 0.62
Q21 Strategy & Implementation 0.62
Q22 Strategy & Implementation 0.62
Q24 Strategy & Implementation 0.57
Q25 Strategy & Implementation 0.53
Q26 Strategy & Implementation 0.64
Q27 Strategy & Implementation 0.66
Q28 Strategy & Implementation 0.66
Q29 Strategy & Implementation 0.5
Q31 Strategy & Implementation 0.65
Q53 Strategy & Implementation 0.64
Q35 Team 0.82
Q36 Team 0.84
Q37 Team 0.86
Q38 Team 0.81
Q39 Team 0.85
Q40 Team 0.89
Q41 Team 0.87
Q42 Team 0.86
Q49 Team 0.84
Q50 Team 0.85
Q51 Team 0.85
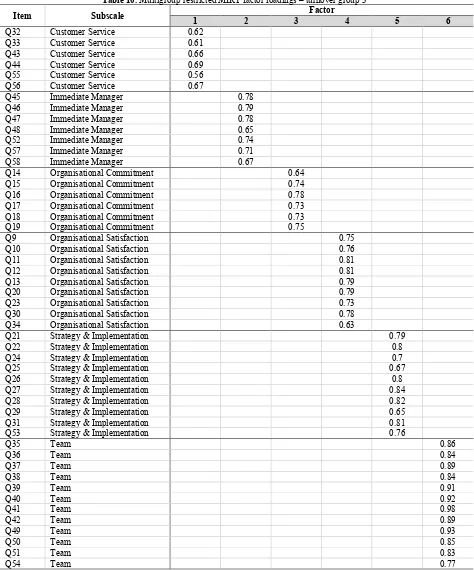
Table 10. Multigroup restricted MIRT factor loadings – turnover group 3
Item Subscale 1 2 3 Factor 4 5 6
Q32 Customer Service 0.62 Q33 Customer Service 0.61 Q43 Customer Service 0.66 Q44 Customer Service 0.69 Q55 Customer Service 0.56 Q56 Customer Service 0.67
Q45 Immediate Manager 0.78
Q46 Immediate Manager 0.79
Q47 Immediate Manager 0.78
Q48 Immediate Manager 0.65
Q52 Immediate Manager 0.74
Q57 Immediate Manager 0.71
Q58 Immediate Manager 0.67
Q14 Organisational Commitment 0.64 Q15 Organisational Commitment 0.74 Q16 Organisational Commitment 0.78 Q17 Organisational Commitment 0.73 Q18 Organisational Commitment 0.73 Q19 Organisational Commitment 0.75
Q9 Organisational Satisfaction 0.75
Q10 Organisational Satisfaction 0.76
Q11 Organisational Satisfaction 0.81
Q12 Organisational Satisfaction 0.81
Q13 Organisational Satisfaction 0.79
Q20 Organisational Satisfaction 0.79
Q23 Organisational Satisfaction 0.73
Q30 Organisational Satisfaction 0.78
Q34 Organisational Satisfaction 0.63
Q21 Strategy & Implementation 0.79
Q22 Strategy & Implementation 0.8
Q24 Strategy & Implementation 0.7
Q25 Strategy & Implementation 0.67
Q26 Strategy & Implementation 0.8
Q27 Strategy & Implementation 0.84
Q28 Strategy & Implementation 0.82
Q29 Strategy & Implementation 0.65
Q31 Strategy & Implementation 0.81
Q53 Strategy & Implementation 0.76
Q35 Team 0.86
Q36 Team 0.84
Q37 Team 0.89
Q38 Team 0.84
Q39 Team 0.91
Q40 Team 0.92
Q41 Team 0.98
Q42 Team 0.89
Q49 Team 0.93
Q50 Team 0.85
Q51 Team 0.83
In general, the factor loadings were strong across all three turnover groups. On average, the factor loadings were somewhat weaker for group 2. However, the factor structure replicated relatively well across the three groups. The latent mean estimates and standard errors are reported in Table 11. Since the reference group was ”Annual turnover more than R6 million but less than R32 million”, all the mean estimates across the six subscales seemed to be higher in the other two groups. It is important to reiterate that group mean comparisons are only permissible if the assumption of metric invariance holds across the majority of items in the subscales. According to this assumption, it would seem that the candidates in group 2 differed most from group 1.
Table 11. Multigroup restricted MIRT group parameter estimates – turnover
Label Group µ1 s.e. µ2 s.e. µ3 s.e. µ4 s.e. µ5 s.e. µ6 s.e.
1 More than R6 million but less than R32 million 0 --- 0 --- 0 --- 0 --- 0 --- 0 ---
2 More than R32 million but less than R64 million 0.71 0.08 0.46 0.11 0.69 0.10 0.64 0.08 0.34 0.09 0.76 0.06 3 More than R64 million 0.33 0.06 0.35 0.05 0.36 0.05 0.56 0.05 0.16 0.05 0.73 0.03 The latent covariances are reported in Table 11. The covariances between the latent variables were all positive as would be expected. None of the standard errors were abnormally high. Table 12. Multigroup restricted MIRT latent variable variance-covariance matrix – turnover Group 1: More than R6 million but less than R32 million θ1 s.e. θ2 s.e. θ3 s.e. θ4 s.e. θ5 s.e. θ6 s.e. 1 --- 0 --- 1 ---
0 --- 0 --- 1 ---
0 --- 0 --- 0 --- 1 ---
0 --- 0 --- 0 --- 0 --- 1 ---
0 --- 0 --- 0 --- 0 --- 0 --- 1 ---
Group 2: More than R32 million but less than R64 million
θ1 s.e. θ2 s.e. θ3 s.e. θ4 s.e. θ5 s.e. θ6 s.e.
1.38 0.20
1.22 0.17 1.92 0.18
1.32 0.17 1.29 0.16 1.92 0.17
1.10 0.12 1.1 0.12 1.37 0.13 1.41 0.13
1.43 0.22 1.55 0.19 1.59 0.16 1.21 0.13 1.88 0.27
0.89 0.14 0.86 0.11 0.71 0.15 0.76 0.10 0.81 0.16 1.05 0.11
Group 3: More than R64 million
θ1 s.e. θ2 s.e. θ3 s.e. θ4 s.e. θ5 s.e. θ6 s.e.
1.38 0.08
0.94 0.05 1.43 0.06
1.16 0.07 0.93 0.07 1.39 0.08
1.00 0.07 0.88 0.06 1.12 0.05 1.30 0.08
1.07 0.07 0.91 0.07 1.08 0.08 0.86 0.07 1.14 0.08
Unidimensional Multigroup Analyses (Baseline Models) – Turnover
At this point, each subscale was analysed with all three turnover groups being simultaneously estimated in each model. As previously mentioned, these baseline analyses provide an indication of configural invariance as well as a comparison point for subsequent analyses of invariance (Hair et al., 2010).
Table 13 presents the factor loadings for each baseline multigroup analysis. The results in this table suggest a high degree of consistency in the magnitude of factor loadings across the three turnover groups. However, the team subscale was problematic across the three groups and some abnormal factor loadings were reported.
Table 13. Multigroup baseline factor loadings – turnover
Customer Service
Item 6-32 million (1) 32-64 million (2) More than 64 million (3)
Q32 0.71 0.81 0.83
Q33 0.74 0.85 0.81
Q43 0.82 0.85 0.82
Q44 0.87 0.86 0.94
Q55 0.75 0.77 0.71
Q56 0.80 0.86 0.78
Immediate Manager
Item 6-32 million (1) 32-64 million (2) More than 64 million (3)
Q45 0.96 0.88 0.88
Q46 0.94 0.87 0.89
Q47 0.93 0.86 0.88
Q48 0.83 0.68 0.72
Q52 0.85 0.81 0.82
Q57 0.87 0.79 0.79
Q58 0.82 0.74 0.73
Organisational Commitment
Item 6-32 million (1) 32-64 million (2) More than 64 million (3)
Q14 0.87 0.73 0.70
Q15 0.91 0.81 0.84
Q16 0.96 0.84 0.88
Q17 0.79 0.73 0.81
Q18 0.85 0.75 0.79
Q19 0.87 0.80 0.81
Organisational Satisfaction
Item 6-32 million (1) 32-64 million (2) More than 64 million (3)
Q9 0.88 0.89 0.89
Q10 0.88 0.88 0.91
Q11 0.93 0.94 0.97
Q12 0.93 0.95 0.95
Q13 0.94 0.97 0.94
Q20 0.93 0.94 0.94
Q23 0.84 0.88 0.87
Q30 0.88 0.90 0.92
Q34 0.67 0.74 0.74
(Table 13 continued)
Strategy & Implementation
Item 6-32 million (1) 32-64 million (2) More than 64 million (3)
Q21 0.87 0.83 0.90
Q22 0.86 0.83 0.89
Q24 0.78 0.80 0.81
Q25 0.70 0.75 0.80
Q26 0.89 0.90 0.93
Q27 0.90 0.94 0.96
Q28 0.91 0.92 0.94
Q29 0.69 0.72 0.76
Q31 0.86 0.89 0.91
Q53 0.83 0.87 0.86
Team
Item 6-32 million (1) 32-64 million (2) More than 64 million (3)
Q35 0.82 0.95 0.93
Q36 0.82 0.98 0.91
Q37 0.84 1.01 0.96
Q38 0.86 0.95 0.92
Q39 0.86 1.00 0.99
Q40 0.89 1.04 1.02
Q41 0.88 1.01 1.06
Q42 0.85 1.00 0.96
Q49 0.86 0.99 1.00
Q50 0.78 1.00 0.93
Q51 0.82 0.99 0.89
In Table 14, the latent means, variance and standard deviation are reported with associated standard error estimates.
Table 14. Multigroup parameter estimates – turnover
Customer Service
Label Group Μ s.e. σ2 s.e. σ s.e.
1 6-32 million 0 --- 1 --- 1 ---
2 32-64 million 0.43 0.12 0.89 0.30 0.94 0.16
3 More than 64 million 0.35 0.12 0.82 0.73 0.91 0.40
Immediate Manager
Label Group Μ s.e. σ2 s.e. σ s.e.
1 6-32 million 0 --- 1 --- 1 ---
2 32-64 million 0.34 0.08 1.20 0.22 1.09 0.10
3 More than 64 million 0.24 0.06 1.13 0.19 1.06 0.09
Organisational Commitment
Label Group Μ s.e. σ2 s.e. σ s.e.
1 6-32 million 0 --- 1 --- 1 ---
2 32-64 million 0.56 0.11 1.23 0.32 1.11 0.14
3 More than 64 million 0.41 0.09 1.12 0.26 1.06 0.12
Organisational Satisfaction
Label Group Μ s.e. σ2 s.e. σ s.e.
1 6-32 million 0 --- 1 --- 1 ---
2 32-64 million 0.60 0.10 0.96 0.21 0.98 0.11
3 More than 64 million 0.49 0.05 0.91 0.10 0.96 0.05
Strategy & Implementation
Label Group Μ s.e. σ2 s.e. σ s.e.
1 6-32 million 0 --- 1 --- 1 ---
2 32-64 million 0.25 0.07 0.98 0.20 0.99 0.10
3 More than 64 million 0.19 0.23 0.87 2.67 0.93 1.44
Team
Label Group Μ s.e. σ2 s.e. σ s.e.
1 6-32 million 0 --- 1 --- 1 ---
2 32-64 million 0.75 0.11 0.77 0.13 0.88 0.07
3 More than 64 million 0.67 0.07 0.75 0.21 0.86 0.12
The fit indices in Table 15 relate to the multigroup unidimensional models and are used as a reference or point of comparison to examine the assumption of metric invariance on the subscale level. Since DIF analyses take place on the subscale level, it does not make sense to compare the overall fit of the six subscales with one another. These estimates merely serve are baseline models to compare progressively restricted models of measurement invariance.
Table 15. Multigroup model fit – turnover
Model -2loglikelihood AIC BIC M2 d.f. RMSEA
DIF Analysis – Turnover
Wald’s χ2 statistic implies significant differences between groups. In the three group analyses, contrast 1 compares group 1 with groups 2 and 3 (1 vs 2, 3). This can be regarded as the overall omnibus significance test similar to ANOVA. Contrast 2 compares groups 2 and 3 (2 vs 3).
Conducting post hoc analyses on annual turnover pairs (with group 1 as the consistent reference group) found evidence of limited DIF.
Overall, only one item on the Customer Service subscale demonstrated DIF according to the overall test (contrast 1). DIF post hoc analyses found no evidence of DIF between group 1 (”More than R6 million but less than R32 million”) and group 2 (“More than R32 million but less than R64 million”). There was, however, one item with highly significant DIF between group 1 and group 3 (“More than R64 million”).
• Group 1 and Group 3 Q33 (Total χ2 = 21.5; p<0.001)
Overall, only one item on the Immediate Manager subscale demonstrated DIF according to the overall test (contrast 1). When consulting the paired group analyses, the item differences were found to lie between Groups 1 and 3.
• Group 1 and Group 3 Q58 (Total χ2 = 17.1; p<0.01)
Both the multigroup and paired DIF analyses found no evidence of item differences between groups on Organisational Commitment. Strong support was found for metric invariance for the Organisational Commitment subscale. Hence the group mean scores could be compared on this subscale with confidence.
Overall, only one item on the Organisational Satisfaction subscale demonstrated DIF according to the overall test (contrast 1). Item 23 demonstrated DIF across groups 1 and 2, as well as across groups 1 and 3.
• Group 1 and Group 2 Q23 (Total χ2 = 11.7; p<0.05)
• Group 1 and Group 3 Q23 (Total χ2 = 14.3; p<0.05)
No DIF was found for the Strategy and Implementation subscale. Both the multigroup and paired DIF analyses found no evidence of item differences between the groups on Strategy and Implementation. Strong support was found for metric invariance for the subscale. Hence group mean scores could be compared with confidence.
Overall, only one item in the Team subscale demonstrated DIF according to the overall test (contrast 1). Post hoc analyses of DIF for the Team subscale found the following evidence of differential functioning:
• Group 1 and Group 2
Q 49 (Total χ2 = 16.2; p < 0.01)
• Group 1 and Group 3 Q38 (Total χ2 = 12.3; p < 0.05) Q49 (Total χ2 = 12.7; p < 0.05)
Table 16. Comparison between DIF and baseline models – turnover
Analysis -2loglikelihood AIC BIC M2 d.f. RMSEA χ2Diff.
Customer Service – Baseline 16925.48 17113.48 17595.63 1394.55*** 698 0.03
56.66*** Customer Service – DIF 16982.14 17132.14 17516.84 1482.70*** 717 0.03
Immediate Manager – Baseline 18173.06 18391.06 18950.15 4008.87*** 983 0.05 352.84*** Immediate Manager – DIF 18525.90 18699.90 19146.15 4521.44*** 1005 0.05
Organisational Commitment – Baseline 16110.67 16298.67 16780.82 1795.51*** 698 0.04
157.04*** Organisational Commitment – DIF 16267.71 16417.71 16802.41 2019.54*** 717 0.04
Organisational Satisfaction – Baseline 20025.43 20303.43 21016.40 6700.96*** 1697 0.05
373.67*** Organisational Satisfaction – DIF 20399.10 20621.10 21190.45 7172.82*** 1725 0.05
Strategy & Implementation – Baseline 27952.78 28260.78 29050.69 5143.88*** 2126 0.03
350.37*** Strategy & Implementation – DIF 28303.15 28549.15 29180.05 6042.03*** 2157 0.04
Team – Baseline 23949.03 24317.03 25260.82 9003.53*** 3128 0.04 164.78*** Team – DIF 24113.81 24407.81 25161.82 9237.84*** 3165 0.04
*** - p < 0.001; χ2Diff. – chi-squared difference test
The results in Table 16 indicate a significant deterioration in the -2loglikelihood metric when slopes are constrained equal across groups. All 𝑥"Diff. indicate significant differences between the baseline and restricted DIF models. With due consideration of the results reported in Table 16, it would be imprudent to compare the latent means of subscales directly across the three groups, since the assumption of metric invariance was partially satisfied.
CONCLUSION
The main objectives of this study were as follows: (1) to confirm the factor analytic structure of the measure; (2) to determine the model fit for the individual scales of the EEI; and (3) to determine the measurement invariance of the EEI as a function of annual turnover.
Previous results have successfully demonstrated evidence of configural invariance using a CFA approach. The current study undertook to assess the three steps of measurement invariance according to the IRT framework. The measurement assumptions and properties of IRT frameworks are superior to classic test theory approaches.
The IRT analyses found support for the assumption of configural invariance of the total measure as well as for the subscales. Factor loadings were robust, with only minimal differences across groups and acceptable standard error values. The first objective was thus achieved.
However, with regard to the second objective, these results were tempered by relatively poor model fit and violation of the local independence requirement of IRT for some of the dimensions. This violation was most pronounced for the team subscale. It is posited that certain problematic items lead to a source of error in the analysis that has not been accounted for, such as multidimensionality.
Unidimensional DIF analyses were conducted at a subscale level to investigate metric invariance. The item slopes for each subscale were constrained equal, and the fit of the nested models was compared.
The -2loglikelihood difference test demonstrated a statistically significant difference in the model fit of between the baseline and restricted DIF models. This violates the requirements of metric invariance, namely that the slopes of the response categories in the graded model are similar across groups. Metric invariance can be considered an important prerequisite for comparing latent means between groups. Thus, the analyses demonstrated that for the most part it is not permissible to compare latent means directly across groups, especially for the Team dimension. In order to remedy this problem, items demonstrating DIF should be removed or adapted and retested.
of the items can thus be used with confidence in future analysis pertaining to annual turnover. However, it is suggested that the seven mentioned items should be adapted or removed.
Another suggestion is that the model fit for the individual scales is conducted for other biographical variables such as race and gender.
As mentioned earlier, one of the limitations of the research was the sample population which focused well-educated and older individuals with senior positions at well-performing companies. It would be of value for future research to include more respondents at all job and educational levels.
AUTHOR BIOGRAPHIES
Nico Martins. Articles which Nico Martins has published have dealt with organisational culture and climate, organisational diagnoses, employment equity and organisational trust. He has presented papers at more than 50 national and international conferences based on work done at various national and international companies. He has participated in about 500 reports on various aspects of organisational diagnoses, and has extensive knowledge in the fields of organisational assessment, (re)design and interventions. His research focuses on quantitative and qualitative research. E-mail: [email protected] (contact author)
REFERENCES
Abrams, M. D., Lee, I. H., Brown, S. D., & Carr, A. (2015). The career indecision profile: Measurement equivalence in the United States and South Korea. Journal of Career Assessment, 23(2), 225–235.
Bock, R. D., & Aitkin, M. (1981). Marginal maximum likelihood estimation of item parameters: An application of the EM algorithm. Psychometrika, 46, 443–459.
Bond, T. G., & Fox, C. M. (2007). Applying the Rasch model: Fundamental measurement in the human sciences (2nd ed.). Mahwah, NJ: Erlbaum.
Boone, W.J., Staver, J. R., & Yale, M. S. (2014). Rasch analysis in the human sciences Dordrecht: Springer.
Brown, J. D. (2005). Testing in language programs: A comprehensive guide to English language assessment. New York: McGraw-Hill.
Byrne, B. M. (2004). Testing for multigroup invariance using AMOS graphics: A road less traveled. Structural Equation Modeling: A Multidisciplinary Journal, 11(2), 272–300. doi.org/10.1207/s15328007sem1102_8.
Cai, L. (2010). High dimensional exploratory item factor analysis by a Metropolis-Hastings Robbins-Monro algorithm”, Psychometrika, l(75),33–57.
Cheung, G. W. & Rensvold, R.B. (2002). Evaluating goodness-of-fit indexes for testing measurement invariance. Structural Equation Modeling, 9(2), 233–255.
Dawson, D. B., Sotelo, F. L., Roesch, S. C., & Klonoff, E. A. (2014). Testing the invariance of adolescent survey-based smoking-related behaviors across ethnic groups and gender. Journal of Health Psychology, 19(12), 1576–1585.
Dimitrov, D. M. (2010). Testing for factorial invariance in the context of construct validation. Measurement and Evaluation in Counseling and Development,43(2) 121–149.
Egri, C. P. (2013). From the editors: Context matters in management education scholarship. Academy of Management Learning & Education,12(2), 155–157. DOI.org/10.5465/amle.2013.0140.
Embretson, S. E., & Reise, S. P. (2000). Item response theory for psychologists. Mahwah, NJ: Erlbaum.
Fahr, J. L., Cannella, A. A., & Lee C. (2006). Approaches to scale development in Chinese management research. Management and Organization Review,2(3), 301–318. DOI: 10.1111/j.1740-8784.2006.0055x.
Fan, X. (1998). Item response theory and classical test theory: An empirical comparison of their item/person parameters. Educational and Psychological Measurement, 58, 357–381.
González, D. A., & Jenkins, S. R. (2014). Cross-measure equivalence and communicability in the assessment of depression: A focus on factor-based sScales. Assessment, 21(6), 731–741.
Hair, J. F., Black, W. C., Babin B. J., & Anderson, R. E. (2010). Multivariate analysis: A global perspective.(7th ed.). London. Pearson.
Harter J. K., Schmidt, F. L., & Hayes, T. L. (2002). Business-unit-level relationship between employee satisfaction, employee engagement, and business outcomes: A meta-analysis. Journal of Applied Psychology87(2), 268–279.
Hays, R. D., Morales, L. S., & Reise, S. P. (2000). Item response theory and health outcomes measurement in the 21st century. Medical Care, 38(9 Suppl.), II28-II42.
Horn, J. L., & McArdle, J. J. (1992). A practical and theoretical guide to measurement invariance in aging research. Experimental Aging Research, 18, 117–144.
Linacre, J.M. (2005). Correlation coefficients: Describing relationships. Rasch measurement transactions, 19(3), 1028–1029. Retrieved from http://www.rasch.org/rmt/ rmt193c.htm
Imandin, L., Bisschoff, C., & Botha, C. (2014). A model to measure employee engagement. Problems and Perspectivesin Management,12(4), 520–532.
Johns, G. (2006). The essential impact of context on organizational behavior. Academy of Management Review, 31(2), 386–408. La Greca, A. M., Ingles, G. J., Lai, B. S., & Marco, J. C. (2015). Social anxiety scale for adolescents: Factorial invariance across
gender and age in Hispanic American adolescents. Assessment, 22(2) 224–232.
Lord, F. M. (1980). Applications of item response theory to practical testing problems. Hillsdale, NJ: Erlbaum.
Makransky, G., & Bilenberg, N. (2014). Psychometric properties of the parent and teacher ADHD rating scale (ADHD-RS): Measurement invariance across gender, age, and informant. Assessment, 21(6), 694–705.
Martins, N. (2014). Factorial invariance of the South African culture instrument. Problems and Perspectives in Management, 12(4), 242–252.
Martins, N., & Da Veiga, A. (2015). Factorial invariance of an information security culture assessment instrument for
multinational organisations with operations across data protection jurisdictions. Journal of Governance and Regulation, 4(4), 47–58.
Martins, N. & Ledimo, O. (2016). The measurement of employee engagement in government institutions. Journal Risk Governance and Control,6(3), 18-25.
Meade, A.W., & Lautenschlarer, G.J. (2004). A comparison of Item Response Theory and Confirmatory Factor Analytic methodologies for establishing measurement Equivalence/Invariance, Organizational Research Methods, 7, 361-388. Meiring, D., Van de Vijver, A. J. R., Rothmann, S., & Barrick, M. R. (2005). Construct, item, and method bias of cognitive and
personality tests in South Africa. SA Journal of Industrial Psychology,31(1), 1–8. http//dx.doi.org/10.4102/sajip.v31i1.182.
Milfont, T. L., & Fischer, R. (2010). Testing measurement invariance across groups: Applications in cross-cultural research. International Journal of Psychological Research, 3(1), 111–121.
Moerdyk, A. (2009). The principles and practice of psychological assessment. Pretoria: Van Schaik.
Nel, P., & Boshof, A. (2014). Factorial invariance of the Adult State Hope Scale. SA Journal of Industrial Psychology/SA Tydskrif vir Bedryfsielkunde, 40(1), Art.#1177, 8 pages.http//dx.doi.org/10.4102/sajip.v40i1.1177.
Nienaber, H., & Martins, N. (2015).Validating a scale measuring engagement in a South African context. Journal of Contemporary Management, 12, 401–425.
Raju, N. S., Laffitte, L. J., & Byrne, B. M. (2002). Measurement equivalence: A comparison of methods based on confirmatory factor analysis and item response theory. Journal of Applied Psychology, 87(3), 517–529.
Reio, T. G., & Shuck, B. (2015). Exploratory factor analysis: Implications for theory, research, and practice. Advances in Developing Human Resources, 17(1), 12– 25.
Reise, S. P., Widaman, K. F., & Pugh, R. H. (1993). Confirmatory factoraAnalysis and item response theory: Two approaches for exploring measurement invariance. Psychological Bulletin, 114(3), 552–566.
Republic of South Africa. (1996). National Small Business Act 102 of 1996. Pretoria: Government Printer. [http://www. acts.co.za/...act-1996/national_small_business...]
Robbinson, D. & Gifford, J. (2014). The future of engagement thought piece collection. Brighton, UK: Institute for Employment Studies.
Rock, D. A., Werts, C. E., & Flaugher, R. L. (1978). The use of analysis of covariance structures for comparing the osychometric properties of multiple variables across populations. Multivariate Behavioral Research, 13, 4, 403–418. DOI:
10.1207/s15327906mbr1304_3.
Rouseau, D. M., & Fried, Y. (2001). Location, location, location: contextualizing organizational research. Journal of Organizational Behavior,22, 1-13.
Samuel, D. B., South, S. C., & Griffin, A. G. (2015). Factorial invariance of the five-factor model rating form across gender. Assessment, 22(1), 65–75.
Spurk, D., Abele, A. E., & Volmer, J. (2015). The Career Satisfaction Scale in context: A test for measurement invariance across four occupational groups. Journal of Career Assessment, 23(2), 191–209.
Strasheim, A. (2011) Testing the invariance of second-order confirmatory factor analysis models that include means and intercepts. Management Dynamics, 20(4), 38–75.
Steenkamp, J-B. E. M., & Baumgartner, H. (1998). Assessing measurement invariance in cross-national consumer research. Journal of Consumer Research, 5, 78–90.
Tay, L., Meade, A. W., & Cao, M. (2015). An overview and practical guide to IRT measurement equivalence analysis. Organizational Research Methods, 18(1), 3–46.
practices, and recommendations for organizational research. Organizational Research Methods, 3, 4–69. Whetten, D. A. (2009). An examination of the interface between context and theory applied to the study of Chinese