http://www.sciencepublishinggroup.com/j/ajme doi: 10.11648/j.ajme.20190505.11
ISSN: 2575-3908 (Print); ISSN: 2575-3797 (Online)
Analysis and Optimization of Automated Power Distribution
Within Nigeria
Godswill Ofualagba, O’tega Ejofodomi
Engineering Department, Racett Nigeria Ltd., Abuja, Nigeria
Email address:
To cite this article:
Godswill Ofualagba, O’tega Ejofodomi. Analysis and Optimization of Automated Power Distribution Within Nigeria. American Journal of Modern Energy. Vol. 5, No. 5, 2020, pp. 74-83. doi: 10.11648/j.ajme.20190505.11
Received: October 3, 2019; Accepted: October 21, 2019; Published: January 6, 2020
Abstract:
Nigeria currently generates approximately 81,122 MWH (or 3,380 MWH/H) of electricity for national consumption, which is far less than the daily electricity demand of the country, leading to a need for allotted power distribution within the country. A power optimization software owned and patented by RACETT NIGERIA LTD. was used to perform automated distribution of electricity from the National Grid for October 1, 2019. The software automatically calculated and deducted the power transmission loss in transporting the electricity from the generating stations to the distribution companies by the Transmission Company of Nigeria (TCN). The total power available for distribution was automatically shared to 11 distribution companies based on the established electricity grid percentage allocation. After deducting the distribution losses for each distribution companies, the remaining electricity was distributed among constituent states, and the hours of electricity supplied to each state selected, with priority given to the peak demand period of 8:00 p.m. -11: 00 p.m. The distribution results show that Nigeria is currently able to provide 4 hours of electricity across the nation from 8:00 p.m. - 12:00 a.m. Eight (8) states received electricity for only 4 hours of the day, while some states like Lagos State received as much as 24 hours. The percentage grid allocation to the distribution companies needs to be revised to improve even distribution of electricity across the nation, and transmission and distribution losses need to be drastically reduced. Further analysis revealed that Nigeria presently needs to generate 240,000 MWH (or 19, 583 MWH/H) of electricity in order to provide 24 hours of electricity to every state across the nation. Future work includes power generation analysis to investigate the effect of new generating stations on each electricity distribution region in Nigeria.Keywords:
Power Distribution, Electricity Supply, Nigeria, Electric Power1. Introduction
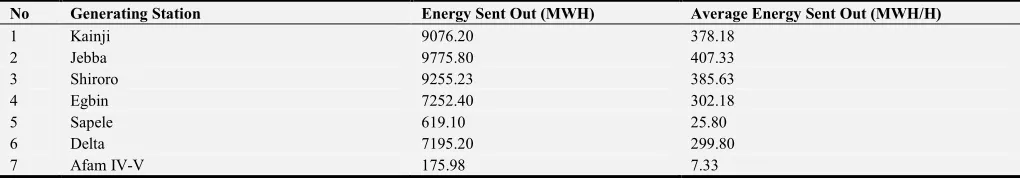
At present, Nigeria generates approximately 81,122 MWH (or 3380 MWH/H) of electricity to be distributed across the nation daily [1]. The existing and functional power generating stations and the electricity generated by each station on October 1, 2019 is shown in Table 1. The
electricity consumption per capita for Nigeria is estimated at 126 KWh/year [2]. Electricity demand forecasts for the country is projected to be much larger than the generated electricity [3-5], leading to a need for optimal distribution of electricity to ensure every individual connected to the national electricity grid receives electrical power each day.
Table 1. Power Generated in Nigeria on OCtober 1, 2019 by Existing Power Generating Stations.
No Generating Station Energy Sent Out (MWH) Average Energy Sent Out (MWH/H)
1 Kainji 9076.20 378.18
2 Jebba 9775.80 407.33
3 Shiroro 9255.23 385.63
4 Egbin 7252.40 302.18
5 Sapele 619.10 25.80
6 Delta 7195.20 299.80
No Generating Station Energy Sent Out (MWH) Average Energy Sent Out (MWH/H)
8 Geregu 2168.49 90.35
9 Omotosho 2193.20 91.38
10 Olorunsogo 2819.29 114.47
11 Geregu NIPP 2098.10 87.42
12 Sapele NIPP 1837.03 76.54
13 Alaoji 1760.75 73.36
14 Olorunsogo NIPP 0.00 0.00
15 Omotosho NIPP 1995.40 83.14
16 Odukpani 4300.44 179.19
17 Ihovbor 2131.59 88.82
18 Okpai 2786.90 116.12
19 Afam VI 2908.69 121.20
20 Ibom 1495.00 62.29
21 ASCO 0 0.00
22 Azura 2309.30 96.22
23 A. E. S. 0 0
23 Omoku 1856.56 77.36
25 Trans-Amadi 1244.30 51.85
26 Rivers IPP 2423.70 100.99
27 Paras Energy 1443.70 60.15
28 Gbarain 0 0
TOTAL 81122.35 3380.10
For electricity distribution, Nigeria is grouped into eleven (11) distinct regions, comprising of 3-5 states. Each region houses a Distribution Company responsible for electricity distribution among its member states. Figure 1 shows the electricity distribution regions currently existing in Nigeria. Only seven (7) of the 11 distribution regions currently have
at least one functioning generating station. Table 2 shows the Distribution companies in each region, the percentage of the national grid’s electricity provided to each of the companies, the states for which they provide electricity, and the population of citizens in each state.
Table 2. Electricity Distribution COmpanies in Nigeria and their Grid Energy Allocations.
No Distribution Company Allocation (% of Grid Energy) [4] States Covered Population [6]
1 Abuja Distribution Company 11.5 FCT 3,564,126
Kogi 4,473,490
Nassarawa 2,523,395
Niger 5,556,247
2 Benin Distribution Company 9 Delta 5,663,662
Edo 4,235,595
Ekiti 3,270,798
Ondo 4,671,695
3 Eko Distribution Company 11 Lagos 12,550,598
4 Enugu Distribution Company 9 Abia 3,727,347
Anambra 5,527,809
Ebonyi 2,880,383
Enugu 4,411,119
Imo 5,408,756
5 Ibadan Distribution Company 13 Kwara 3,192,893
Ogun 5,217,716
Osun 4,705,589
Oyo 7,840,864
6 Ikeja Distribution Company 15 Lagos 12,550,598
7 Jos Distribution Company 5.5 Bauchi 6,537,314
Benue 5,741,815
Gombe 3,256,962
Plateau 4,200,442
8 Kaduna Distribution Company 8 Kaduna 8,252,366
Kebbi 4,440,050
Sokoto 4,998,090
Zamfara 4,515,427
9 Kano Distribution Company 8 Jigawa 5,828,163
Kano 13,076,892
Katsina 7,831,319
10 Port Harcourt Distribution Company 6.5 Akwa Ibom 5,482,177
Bayelsa 2,277,961
Cross River 3,866,269
Rivers 7,303,924
11 Yola Distribution Company 11.5 Adamawa 4,248,436
Borno 5,860,183
Taraba 3,066,834
Yobe 3,294,137
This paper presents an analysis on the current distribution of generated power in Nigeria, to gauge its effectiveness and looks for methods of possible improvement. The percentage of the electricity in the national grid allocated to each distribution company is known. However, the percentage allocated to each specific state within a distribution region is not available. For the purpose of analysis, the population of each state is used to determine the percentage of electricity distributed to each state by the distribution company. Although, only about 40% of Nigerians are connected to the national grid [5], this study assumes that every citizen has access to electricity from the National Grid, as this is a key target that needs to be attained by the Power Sector of the
country.
2. Materials and Methods
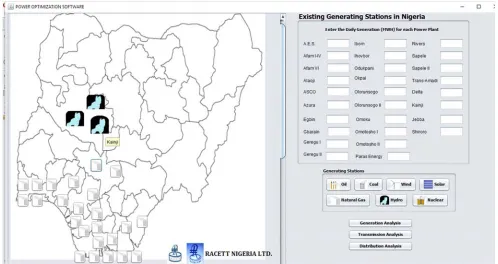
Figure 2. Power Optimization Software for Automated Power Distribution by RACETT NIGERIA LTD. [7].
Using the data entered in Figure 2, the optimization software performs power generation, power transmission, and power distribution analysis for the country. In this study, distribution analysis was performed using the power generation data for October 1, 2019 in Table 1. The process for distribution analysis is shown in Figure 3. The software automatically calculated and deducted the power transmission loss in transporting the electricity from the generating stations to the distribution companies by the
Transmission Company of Nigeria. Currently, the transmission loss is estimated to be 7.77% of the power generated as at February 2019 [7]. The total power available for distribution is then shared to the 11 distribution companies based on the percentage allocation presented in Table 2. The distribution losses incurred by each distribution company is deducted for each distribution company [8], and the net available power is used for the distribution analysis.
Figure 3. Distribution Analysis Algorithm for Power Optimization Software by RACETT NIGERIA LTD.
The distribution companies divide their net available power between their member states, based on the population for each state. Using the electricity consumption per capita for Nigeria of 126 KWh, the software automatically calculates the electricity demand required by each state, then compares this with the power distributed to each state. If the electricity demand for the state is less than the total power distributed to a state by its distribution company, then this
means that state can have electricity for 24 hours of that day. However, if the electricity demand for the state exceeds the total power distributed to a state, then that state cannot have 24 hours of electricity for that day. The total number of hours of electricity that can be derived for the power supplied is calculated and this is used to automatically determine which hours of the day the state will be supplied electricity.
during evening time between 8:00 p.m. and 11: 00 p.m., and minimum power demand is between 3:00 a.m. and 5:00 a.m. [9]. Using this information, the optimization software places first priority on the last hour of the day (11:00 p.m. - 12:00 a.m), and runs down in sequentially decreasing order through out the 24 hours of the day, placing the least priority on the first hour of the day (12:00 a.m. to 1: 00 a.m.). Based on this, the software is able to determine which states have electricity at any time during the course of the day, based on the generation data provided from the generation stations for that particular day.
3. Results
Figures 4 a-d shows the power distribution at 12 a.m. - 1:00 a.m., 6:00 a.m - 7:00 a.m., 12 p.m. - 1p.m, and 6:00 p.m - 7:00 p.m respectively. The results show that only Lagos State is able to have light for 24 hours on October 1, 2019. Keep in mind that Lagos state is served by two distribution companies (Eko Distribution Company and Ikeja Distribution company), with a total grid allocation of 26%, the maximum allocation given to any state in the country. Due to this, Lagos State is the only state powered by electricity from 12:00 a.m - 1:00 a.m. (see Figure 4a), which is the hour with the least priority in the algorithm.
By 6:00 a.m., only 5 states in the Nation are being supplied with electricity (see Figure 4b). The 5 states are Lagos, FCT, Nassarawa, Kogi and Niger. The additional four states are supplied by the Abuja Distribution Company, which is able to provide electricity to its constituent states for 83% of the day. By 12:00 noon, which is half of the day, only 9 states are supplied with electricity (see Figure 4c). The 9 states are Lagos, FCT, Nassarawa, Kogi, Niger, Kwara, Ogun, Osun, and Oyo. The new additional four states are supplied by the Ibadan Distribution Company, which is able to provide electricity to its constituent states for 63% (or 15 hours) of the day. By 6:00 p.m., 28 states are supplied with electricity (see Figure 4d), including the capital, FCT.
Table 3 shows the breakdown of hourly electricity distribution for each state in the country. Each state, including the capital FCT, is supplied with electricity between 8:00 p.m. and 12:00 a.m. at night, the identified peak demand period. Lagos state received 24 hours of electricity (the largest allocation), while Kaduna, Kebbi, Sokoto, Zamfara, Bauchi, Benue, Gombe, and Plateau, received the least amount of electricity, with only 4 hours of electricity (17% of the day). Only 8 states (including the capital, FCT) receive electricity for 12 hours or more (50% of the day).
(b)
(d)
Figure 4. Hourly Power Distribution on October 1, 2019 for States in Nigeria. (a) 12:00 a.m - 1:00 a.m. (b) 6:00 a.m. - 7:00 a.m. (c) 12:00 p.m. - 1:00 p.m. (d) 6:00 p.m. - 7:00 p.m.
Table 3. Electricity Distribution for States in Nigeria for October 1, 2019.
No States Number of Hours With Electricity (Hrs) Total (Hrs)
12 a.m. - 6:00 a.m 6:00 a.m. - 12:00 p.m. 12:00 p.m. - 6:00 p.m. 6:00 p.m. - 12:00 a.m.
1 Lagos 6 6 6 6 24
2 FCT 3 6 6 6 21
3 Nassarawa 3 6 6 6 21
4 Kogi 3 6 6 6 21
5 Niger 2 6 6 6 20
6 Kwara 0 3 6 6 15
7 Ogun 0 3 6 6 15
8 Osun 0 3 6 6 15
9 Oyo 0 3 6 6 15
10 Delta 0 0 5 6 11
11 Edo 0 0 5 6 11
12 Adamawa 0 0 5 6 11
13 Borno 0 0 5 6 11
14 Taraba 0 0 5 6 11
15 Yobe 0 0 5 6 11
16 Ekiti 0 0 4 6 10
17 Ondo 0 0 4 6 10
18 Abia 0 0 3 6 9
19 Anambra 0 0 3 6 9
20 Ebonyi 0 0 3 6 9
21 Enugu 0 0 3 6 9
22 Imo 0 0 3 6 9
23 Jigawa 0 0 2 6 8
24 Kano 0 0 2 6 8
25 Katsina 0 0 2 6 8
26 Akwa Ibom 0 0 0 6 6
27 Bayelsa 0 0 0 6 6
28 Rivers 0 0 0 6 6
No States Number of Hours With Electricity (Hrs) Total (Hrs) 12 a.m. - 6:00 a.m 6:00 a.m. - 12:00 p.m. 12:00 p.m. - 6:00 p.m. 6:00 p.m. - 12:00 a.m.
30 Kaduna 0 0 0 4 4
31 Kebbi 0 0 0 4 4
32 Sokoto 0 0 0 4 4
33 Zamfara 0 0 0 4 4
34 Bauchi 0 0 0 4 4
35 Benue 0 0 0 4 4
36 Gombe 0 0 0 4 4
37 Plateau 0 0 0 4 4
4. Discussion
Detailed analysis with qualitative and quantitative results on the current electricity distribution network system in Nigeria is unavailable in the literature. To our knowledge, this is the first publication that provides provides data that clearly shows the electricity deficit being experienced across the entire nation, state by state, and as such cannot be compared to previously published works. It is simply stated in literature that Nigeria does not generate sufficient electricity to meet the nation’s demands [10-14]. But data on how the nation’s generated electricity is distributed across the nation is not readily available. Citizens of the country requiring electricity either for residential, commercial, or industrial purposes are unable to predict when electrical power from the national grid will be available to them for consumption [11]. Currently, no known formula or method is being implemented to determine when to disburse available electricity to a particular region in the country. This is the first attempt to provide Nigeria with qualitative real-time information that will enable them know when electrical power from the national electricity grid will be available to them. This feat was made possible using the Power Optimization Software developed, owned, and patented by RACETT NIGERIA LTD.
Daily Power generation of 81,122 MWH (or 3380 MWH/H) is capable of meeting the peak power demand of the country between 8:00 p.m. - 11:00 p.m. In fact, 81,122 MWH guarantees a nationwide electricity supply of 4 hours (8:00 p.m. - 12:00 a.m) on any given day. However, the grid allocation of electricity to the various distribution company needs to be revised, as some distribution companies experience severe shortage of electricity. Based on the automated distribution of the optimization software, barely 25% of the country (8 states and the capital FCT) can experience 12 hours or more of electricity with a generational output of 81,122 MWH. Further analysis using the power optimization software shows that a daily generation power of 240,000 MWH would guarantee nationwide electricity supply of a minimum of 12 hours. A daily generation of 470,000 MWH (or 19,583 MWH/H) would provide 24 hours electricity supply to the 36 states of the country, including the capital, FCT. Nigeria is currently generating only 17% of the electricity required to meet the demands of her citizens.
Lagos State seems to have been given preference in the
grid allocation because of its economic importance to the country. Based on the distribution algorithm implemented in this paper, this state should be the one place in the country presently experiencing 24 hours of electricity each day. However, the computation performed utilizes the per capita electricity consumption of 126 KW/h for every citizen across the country, which is not always the case. Olaniyan et. al. [15] found that urban residents use 39 kWh per person per month compared to 17 kWh per person per month for rural residents, that the South East had the highest per capita electricity consumption per month at 36 kWh per person, while the North East had the least (at roughly 1 kWh per person). Residents in Northern households consumed less electricity (20 kWh) compared to Southern households (33 kWh) [10]. The increased per capita electricity consumption in Lagos State may be the reason why the 24 hours of electricity is not presently being experienced in the state.
The results from the power optimization software indicate that the grid allocation for Jos Distribution Company (servicing Bauchi, Beniue, Gombe, and Plateau State), Kaduna Distribution Company (servicing Kaduna, Kebbi, Sokoto, and Zamfara), and Port Harcourt Distribution Company (servicing Akwa Ibom, Bayelsa, Rivers, and Cross River) needs to be increased in order to improve the electricity availability from 4-6 hours to something more substantial. It is important to note that the Port Harcourt Distribution Region contains many of the generating stations (at least 8 generating stations) and so it is unacceptable for the region to be supplied with one of the lowest hours of electricity. Some of the challenges facing the distribution companies have been identified as overloading of transformers, inadequate funding, and vandalization of equipments. Increasing the number of distribution transformers and transmission substations to avoid overloading, upgrading or construction of 132 kV lines to avoid loadshedding, improving tariff structure, and encouraging consumers to pay their electricity bills using prepaid meters, are some of the solutions proferred to the existing problems [11].
ranges from 31 - 77% for February 2019, which is enormous. Table 4 shows the distribution loss experienced by each electricity distribution company in Nigeria as at February 2019. It is important to note that the two distribution companies that supplied the lowest number of hours of electricity to their constituent states (Jos Distribution Company and Kaduna Distribution Company) have the highest distribution losses of 77% and 71% respectively. This means that they only successfully disburse 23% and 29% of their electricity grid allocation. In addition to requesting an increase in grid percent allocation for these distribution companies, more emphasis should be placed on strengthening the distribution network to the consumers to reduce and curtail the distribution losses in order to significantly improve the number of hours of electricity supplied to their constituent states.
Table 4. Electricity Distribution Losses for the Distribution Companies in Nigeria [8].
No Electricity Distribution Company Distribution Loss (%)
1 Abuja Distribution Company 43
2 Benin Distribution Company 58
3 Eko Distribution Company 31
4 Enugu Distribution Company 57
5 Ibadan Distribution Company 52
6 Ikeja Distribution Company 31
7 Jos Distribution Company 71
8 Kaduna Distribution Company 77
9 Kano Distribution Company 47
10 Port Harcourt Distribution Company 66
11 Yola Distribution Company 68
In addition to reducing transmission and distribution losses that occur during power transmission and distribution, the daily power generation output for Nigeria needs to be increased to meet the nation’s electricity demand. The total power produced for the national grid comes from 28 power plants (3 Hydro Power stations and 25 Natural Gas Stations) that are located primarily in the south. Presently, 5 generating stations are located in the Abuja Distribution Region, 8 generating stations are in the Benin Distribution Region, 2 in the Eko and Ikeja (Lagos) Distribution Region, 1 in the Enugu Distribution Region, 3 in the Ibadan Distribution Region, and 9 in the Port Harcourt Distribution Region. Increasing the available generation capacity of the 28 functioning generating stations will have a significant effect on the amount of energy available for national distribution. It is also recommended that each distribution region possess generating stations to augment the power supply received from the national grid, and to shorten electricity transmission distances. Future work includes power generation analysis to investigate the effect of new generating stations on each electricity distribution region in Nigeria.
5. Conclusion
Nigeria currently generates approximately 81,122 MWH (or 3,380 MWH/H) of electricity for national consumption,
which is far less than the daily electricity demand of the country, leading to a need for allotted power distribution within the country. Automated distribution of power within the country was performed using a power optimization software owned and patented by RACETT NIGERIA LTD. for October 1, 2019 to determine when electricity will be available for consumption for each state in the country. The generated electricity was distributed among the 36 states and the federal capital, the hours of electricity supplied to each state selected based on the amount of energy available and with priority given to the peak demand period of 8:00 p.m. -11: 00 p.m. The automated distribution results show that Nigeria is currently able to provide 4 hours of electricity across the nation from 8:00 p.m. - 12:00 a.m. Eight (8) states received electricity for only 4 hours of the day, while some states like Lagos State received as much as 24 hours. The percentage grid allocation to the distribution companies needs to be revised to improve even distribution of electricity across the nation, and transmission and distribution losses need to be drastically reduced. Future work includes power generation analysis to investigate the effect of new generating stations on each electricity distribution region in Nigeria.
Acknowledgements
The Power Optimization Software used in this analysis was funded and supported by RACETT NIGERIA LTD. [Grant Number RNLP100].
References
[1] https://www.nsong.org.
[2] NESISTATS (2018). Nigeria Power Baseline Report, 2018. http://mypower.ng/downloads/baseline-report/ Accessed October 1, 2019.
[3] Abubakar Sambo, Ismalla Hallru Zarma, Babayo Garba, Mohammed Musa Gaji. Electricity Generation and the Present Challenges in the Nigerian Power Sector, J. Energy Power Eng., Vol. 6, pp. 1-17, 2010.
[4] Ebele S. Nwokoye, Stephen K. Dimnwobi, Chukwunonso S. Ekesiobi, Casmir C. Obegolu. Power Infrastructure and Electricity in Nigeria: Policy Considerations for Economic Welfare, KIU Journal of Humanities 2415-0843; 2 (1): 5–17, 2017.
[5] Olatunji Obafemi, Akinlabi Stephen, Oluseyi Ajayi, Abioye Abiodun, Ishola Felix, Peter Mashinini and Madushele Nkosinathi. Electric Power Crisis in Nigeria: A Strategic Call for Change of Focus to Renewable Sources, IOP Conf. Series: Materials Science and Engineering, 413 012053, pp. 1-17, 2018. doi: 10.1088/1757-899X/413/1/012053.
[6] National Bureau of Statistics (2018). Demographics Statistics Bulletin, 2017.
[7] www.racett.com.ng.
[9] Transmission Expansion Plan Development of Power System Master Plan for the Transmission Company of Nigeria Final Report, 2017. www.tcnpmu.ng, Accessed October 1, 2019.
[10] Ganiyu Adedayo Ajenikoko, Adebayo Wasiu Eboda, Oluwatomi Adigun, Ahmed Olayinka, Sulaimon Oladimeji, Lukman Adelowo. Analysis of Power Sector Performance: Nigeria As a Case Study. Mathematical Theory and Modeling, Vol. 8, No. 8, 2018.
[11] A. C. Ohajianya, O. E. Abumere, I. O. Owate, E. Osarolube. Erratic Power Supply in Nigeria: Causes and Solutions. International Journal of Engineering Science Invention, Vol. 3, Issue 7, pp. 51-55, 2014.
[12] V. K. Abanihi, S. O. Ikheloa, F. Okodede. Overview Of the Nigerian Power Sector. American Journal of Engineering Research, Vol. 7, Issue 5, pp. 253-263, 2018.
[13] Adebayo O. Adedeji. Privatisation and Performance of Electricity Distribution Companies in Nigeria, Journal of Public Administration and Governance, Vol. 7, No. 3, pp. 190-203, 2017.
[14] Onochie U. P., Egware H. O., and Eyakwanor T. O. The Nigeria Electric Power Sector (Opportunities and Challenges) Journal of Multidisciplinary Engineering Science and Technology, Vol. 2, Issue 4, pp. 494-502, 2015.


![Table 4. Electricity Distribution Losses for the Distribution Companies in Nigeria [8]](https://thumb-us.123doks.com/thumbv2/123dok_us/8476052.1712585/9.595.41.293.302.444/table-electricity-distribution-losses-distribution-companies-nigeria.webp)
