Review on Data Analytics for Climate Studies
Mrs. Radhika T V1, K C Gouda2, S.Sathish Kumar3
1
Assistant Professor, Department of Information Science & Engineering, Dayananda Sagar Colleg of Engineering, Bangalore, India
2
Senior Scientist, CSIR Fourth Paradigm Institute (Formerly C-MMACS), Wind Tunnel Road Bangalore, India
3
Associate Professor, Department of Computer Science & Engineering, RNS Institute of Technology, Bangalore, India
Abstract
Climate system comprises of wide range of complex interactions and interrelationships occurring over time. Climate change is pervasive and may cause huge impact on society leading to financial and economic losses. As climate data is huge because of so many parameters at global spatial scale and hundreds of years in temporal scale so it is considered to be Big Data. Processing of these data for analysis and analytics requires High Performance Computing (HPC platform), which is achieved through big monster machines i.e. “Super Computers”. Much of the cost and time is spent in effectively managing data in such machines. So currently there is an urge to address these issues with the help of distributed computing facilities deployed in cloud environment. In a cloud platform generally different users (researchers) requires the computational resource as well as the climate data for performing different task. Analysing climate data is considered to be one of the most challenging work now a days as it requires huge computing and robust algorithms and codes. In this paper we address different aspects of climate studies such as format of storing climate data, numerical weather prediction models, visualization tools, and database used for storing climate data. Finally we address general architecture of distributed computing platform deployed in cloud to give solutions to challenges faced in Climate Analytics. Understanding and analysing these aspects will be very much helpful for prioritizing user preferences, interest and thus helps to extract useful results based on specific criteria.
Keywords - Super Computers, HPC, Distributed Computing, Future Prediction Models, SPARK, Climate Analytics.
I. INTRODUCTION
Climate is the statistics of weather over long periods of time, which is measured by assessing the patterns of variation in temperature, humidity, atmospheric pressure, wind, precipitation, atmospheric particle count and other meteorological variables in a given region over long periods of time. Climate differs from weather, in that weather only describes the short-term conditions of these variables in a given region. Climate data can be represented in different visual
forms such as graphs, charts, maps and diagrams. It is collected from various sources such as Weather satellites, Research aircraft, Domestic aircraft, International aircraft, Radar, Radiosonde data, Meteorological observing station, Drifting Buoy, Wind Profiler, Voluntary Observing Ship etc. So representation and well organization of climate data is important. One of the common methods of representation is tabular form but most useful method of representation is in the form of graph or diagram which can be easily understandable by different users. These forms of representation help us to understand different patterns or distribution of data over a given geographical area. Since climate data includes variables such as temperature, precipitation, wind, humidity, solar radiation etc. These variables or characteristics need to be represented using suitable method like graphs. For instance line graph can be used to effectively represent temperature data between different periods in time and for different state or countries. Also bar graph can be used to illustrate rainfall. Similarly dot maps can be used to suitably represent crop producing areas.
The graphical representation of commonly used climate variables such as monthly average precipitation and temperature at a certain location is called as climograph. One way of representation uses an overlapped combination of a bar and line chart which interpret the climate of a place over a 12-month period. Another method makes use of common horizontal axis with different vertical axis. Here both the precipitation and temperature are shown in bar charts. This method has an advantage that the range of temperature (average of minimum and maximum temperatures) can be shown, rather than just the average temperature.
climate change and it is considered to be one of the cross-cutting issue that most of the countries facing today [1]. Which in turn may put billions of people at risk and it will have major impact on less developed countries. In order to address these challenges we require a platform for reliable and timely access to information and data available on the environment. Here the main goal is to make sure that the best available climate data and its applications are effectively used and communicated to various sectors (e.g., health, water and agriculture) which may ultimately get benefit from climate knowledge [1].
A Drastic changes in climate can lead to significant impact and is considered to be one of the most serious challenge facing the society currently [2]. Since these extreme changes can become more frequent in future days, demand for acquiring information services on climate data are increasing. In order to deal with any real world problems, we need to have knowledge on working of extreme values. More commonly high or low values of these meteorological variables will in turn affect the foundation upon which we depend for shelter, food, energy, water and transport.
For instance, high values of precipitation will results in increase in the level of stream flow which have adverse effect on dams, reservoirs, bridges and sewerage systems. That is the why analysing these extremities is in high demand, which requires adaptation to high security and safety standards which is considered to be very costly and also on the other hand this analysis help us to prevent major damage on the infrastructure which is caused by extreme events which is likely to occur during course of life[2].
As data analytics involves qualitative and quantitative methods and processes which is used to improve effectiveness and business gain. Wherein data is extracted from various sources and segregated, stored and finally analysed to study purchasing trends and patterns. So the main goal of this paper is to focus on various background methods and processes using which climate data analysis can be achieved. We give an overview on multiple climate data formats and what are the advantages of each of these formats. Also we highlight on future weather prediction models and the purpose for which these models are used. Then we discuss about various visualization tools and their advantages and disadvantages. Databases suitable for storing climate data are also discussed and finally we present some open challenges.
The rest of the paper is organized as follows. Section 2 gives a review on related work in climate science domain and Big Data Analytics. Section 3 presents various climate data formats, weather prediction models, several visualization tools and also importance of using oracle database for efficient storage of climate data. Section 4 presents architectural details of a platform deployed in cloud for Climate Data Analytics. Finally the conclusions are discussed in section 5.
II. RELATEDWORK
In order to effectively manage and use climate data, we require a framework with necessary functionality. The World Meteorological Organization (WMO) has proposed a useful guide on this framework which is called as Climate Data Management System (CDMS) [4]. A CDMS is considered to be computer based integrated system which provides effective data archival, delivery, management, analysis, and utilization of a wide range of integrated climate data. This framework is composed of some of the essential basic building blocks called as components. In order to effectively manage climate data, CDMS defines set of policies and governance processes that every organization should follow.
Some of the major components of CDMS are Data presentation, Data analysis, CDMS governance, Data management and Data delivery. (i) CDMS governance provides set of rules and business process management required to make a base for the establishment and management of various sources of climate data and services.
(ii) Data management provides some of the functionalities needed to manage climate data. These are data ingest and extraction, data rescue observations quality control, Quality assessment, Management of climate metadata.
(iii) Data Delivery provides functionalities needed to deliver the data which involves data discovery, data delivery in WMO formats, data delivery based on open spatial standards.
(iv) Data analysis component make use of various analytical techniques to generate range of derived data. These techniques are statistical, spatial and image analysis, Homogenization, Numerical modelling processes.
(v) Data Presentation provides various techniques to communicate climate-related information. These include written reports, graphical user interface, and multimedia techniques such as videos, photograph, and podcasts.
S.Fiore, A.D Anca et.al in [6] have introduced a big data analytics research platform called as Ophidia whose main aim is to support access, analysis and mining of n-dimensional array based scientific data. Authors have given importance on Ophidia framework’s internal storage model, the general architecture and the array-based primitives since they represent key components. In order to address big data analytics challenges in eScience domain, authors have highlighted on data warehouse systems, new storage models, OLAP frameworks, numerical libraries and parallel paradigms. They have also given case studies related to climate change in order to show the working of the platform. Development of multiple interfaces is planned as future work.
III. VARIOUSFACTORSNEEDEDFOR CLIMATEDATAANALYTICS Climate data is considered to be Big data. Climate change is pervasive and it is affecting every sector such as agriculture, healthcare, business, economy etc. Increase in temperature, frequency of storms, melting of ice, level of sea, all these factors may lead to climate change. These factors have major impact on human life which in turn can lead to economic and financial losses. In order to overcome these problems of climate change, understanding of climate data and climate change is important. Real-time climate data analytics helps to manage and adapt to climate change. Before developing a platform for climate data analytics, understanding of various factors influencing climate data analytics is important. These factors help us to develop efficient platform for climate data analytics. In this section we discuss in detail about various factors influencing climate data analytics.
A. Climate Data Formats
Data formats used for climate research is classified mainly into 4 types and they are Binary, NetCDF, GRIB, HDF. These formats are considered to be self-describing and portable. Also metadata can be added to this file, which gives additional information about the file contents. Each of these formats has multiple versions. In order to address changing demands of new applications, these formats have been developed. Brief overview of each of these formats is discussed below.
1. Binary
These are the files used in climate research which are commonly generated from compiled languages such as Fortran or c/c++. These files are well supported by compiled languages and it is easy to create as well. These files when created from fortran or C or C++ requires that the user should know in advance about the structure or lay-out of the data, the data types of all the variables, the "endian" type of the file being read (big endian or little endian).The main
drawback of binary file is that, it is difficult to clearly find its contents and there is no generic tools to deal with this file. This is the main reason for not using binary files for storing climate data.
2. GRIB (GRIdded binary)
The world operational weather centres are using GRIB format. It is a bit-oriented data exchange format which is one of the efficient vehicle for transferring large volumes of gridded data to automated centres over high-speed telecommunication lines using modern protocols. Information are packed into the GRIB code, which will help us to produce faster computer-to-computer transmissions. GRIB code can make messages or records to be made more condensed than character oriented bulletins.
The two versions of GRIB are GRIB-1 (original) and GRIB-2 (new). Each record of GRIB-1 contains information for two horizontal dimensions (e.g., latitude and longitude) for one time and one level [7]. Whereas GRIB-2 allows each record to contain multiple horizontal grids and levels for each time. A collection of GRIB records is called a GRIB file and it may or may not be described as "self describing." Each record contains information needed to unpack the data. But the variable being unpacked is denoted by an "indicator parameter" and the variable's name and units must be determined by a table lookup [7]. Operational weather centers generally uses GRIB format in order to generate reanalysis and forecast product.
3. HDF (Hierarchical Data Format)
It is mainly used to store and organize large amount of data. The two versions of HDF are original HDF4 and the more recent HDF5. But the interfaces and data models of HDF4 and HDF5 are completely incompatible. Like UNIX file system, data model of HDF5 is more flexible and it has true hierarchical file structure. New features of HDF5 which are interesting to climate research are parallel I/O and variable compression. The HDF{4/5} has three additional data types defined by EOS (Earth Observing system) format extension and they are: grid, point, and swath. These data types allow the file contents to be referenced to Earth coordinates, such as latitude and longitude, and to time [7].
One of the annoying issue is that standard HDF library calls cannot readily access geo-location or time data or metadata. Users must use the HDF{4/5}-EOS interfaces. The converse is also true. Some information can only be accessed via standard HDF4 interfaces. Hence, in order to get all the information on the file, both interfaces are required. HDF community does not have generally accepted convention for HDF files.
4. NetCDF(Network Common Data Form)
array-oriented scientific data. NetCDF file has a header which describes the layout of the rest of the file, in particular the data arrays, as well as arbitrary file metadata in the form of name/value attributes. A standard netCDF convention were used when writing a file which ensures both users as well as automatic software that certain 'rules' have been followed when creating the file. COARDS
(Cooperative Ocean/Atmosphere Research Data Service) and CF (Climate and Forecast) conventions are the two most commonly used NetCDF conventions for climate data.
Climate model generated data can be stored using NetCDF format. This format has several components such as dimension names, dimension size,
the variables on the file which often include additional information about each variable and temporal/spatial coordinates and global attributeswhich contain information about the file's contents. The variable with dimension size UNLIMITED means that variable can grow to any length along that dimension. The two versions of NetCDF are NetCDF-3 and NetCDF-4. NetCDF-classic is the name given to NetCDF-3 data model which has been used for many years. When datasets becomes larger, when grids become more complicated, and when user wishes for more flexibility then NetCDF-3 data model can be used. For example, netCDF-3 does not support compression, string variables or parallel processing [7]. To address these shortcomings,NetCDF-4. (nc4) was created. An nc4 files is a hybrid: a subset of HDF5 with netCDF-3 style API interfaces used to create and access the data.
B. Weather Prediction Models
From many years weather has attracted mankind because of its unpredictable nature and its impact on social and economic aspects, makes it more interesting for scientist and researchers to find a precise weather prediction models. Weather prediction deals with estimating the condition of atmosphere at a particular place using the knowledge of science and technology. Accurate weather prediction is still a complex task for researchers because of unpredictable nature of weather. Numerical weather prediction deals with accepting current observations of weather and processing these data with mathematical models built based on some physical principles to forecast the future state of weather.
There are mainly four types of weather prediction and they are short-range, medium-range, long-range, and hazardous weather prediction. Predictions made between one and seven days are considered as Short-range prediction. Predictions done between one week and four weeks in advance are Medium-range prediction. Whereas long range predictions are the one made between one month and a year in advance. The further into the future you're trying to predict, the harder it is to be sure. Longer-range forecasts are only useful if the forecaster says how likely he or she believes it is that the prediction is accurate. Long
range predictions are harder to compute and are less accurate compare to other types. Whereas short-range prediction are more accurate than medium-range or long –range prediction. More powerful mathematical models are required for long-term predictions than short-term. The following are the examples of mathematical models which are in use today for future climate prediction.
1. GCM (General Circulation Model)
It is the mathematical formulations of the components that constitute the climate system, including radiation, energy transfer by winds, momentum, cloud formation, heat transport between ground and air, evaporation and precipitation of water, and transports of heat and moisture within the ground, etc. The model calculations are made for individual grid boxes on the order of 200 – 500 km in the horizontal and vertical dimensions [8]. Using a series of time steps the model resolves equations for the atmosphere, oceans and land surfaces in each grid box over the entire globe.
2. WRF (Weather Research forecast): Level-2 Heading
This is a meso-scale numerical model that has been widely used since its development in 2000[9]. In order to provide an in-depth understanding of the relevant physical process and mechanisms, meso scale models are used. WRF is the next generation model for weather forecasting and it has been developed to serve both atmospheric research and operational forecasting requirements. WRF provides two computational cores which are data assimilation system, and a software architecture allowing for parallel computation and system extensibility.
This model is used for numerous meteorological applications across scales ranging from meters to thousands of kilometres. WRF is used mainly for real-time, accurate and large scale forecasting of weather throughout the world.WRF serves as a critical tool for storm prediction and alerts. The two versions of this model are WRF-ARW (Advanced Research WRF) and WRF-NMM (Nonhydrostatic Mesoscale Model). WRF-NMM is mainly used for hurricane forecasting
3.MM5(Fifth-Generation Penn State/NCAR Mesoscale Model)
distributed-memory machines, a four-dimensional data-assimilation capability etc. Many of the validation studies related to meso-scale model are limited either to a few selected cases or to a relatively short time period.
Only a few studies have evaluated meso-scale model forecasts using relatively long-term observations from several seasons and over multiple years [10]. MM5 and WRF models are most commonly used for easy accessibility, adaptability to study regions and applicability to prediction of scales of motion ranging from few tens of kilometres to few thousands of kilometres. For the Indian region, MM5 model has been widely applied for numerical weather prediction, specifically for studies on monsoon heavy rainfall events, tropical cyclone, severe local storms, land and sea breeze circulation, winter snowfall prediction, monsoon depression, boundary layer processes, mountain weather forecasting and regional climate studies [11]. This model is mainly used for short range prediction of weather of longer duration.
C. Climate data Visualization Tools
Climate data visualization is the process of developing images by presenting, filtering and mapping of data. To analyse and present climate simulations and observations, visualization is used as a key technology in climate related studies. Designing instinctive and meaningful visual representations in climate studies undergoes various challenges. One of the challenge is that, climate related data are heterogeneous i.e. data can be spatial, temporal, multi-variates; gridded, region-based, station-based etc which requires various standard visualizations (e.g. 2d-maps, 3D-globes, time charts and scatter plots)[12]. Apart from that we require easy to understand visualization techniques to analyse huge time-dependent 3D or long time series data
interactively. Second, as wide varieties of users including those with different skills, interest, qualification and from different streams are accessing climate data and thus they require effective visualization tools. Finally, applying visualization to climate data is not a straightforward approach. This is because of availability of various tools, techniques and parameters. Thus in order to bridge gap between such systems and users, there is a need of sophisticated technologies such as graphical user interfaces visualization design etc. In this subsection we have discussed most popular visualization tools for climate studies. Some of those are MATLAB, ArcGIS, Ferret and GrADS.
1. MATLAB
It is a high-performance language and interactive system with basic data type such as array or matrix. It integrates computation, visualization, and programming in an easy-to-use format and includes Mathematical functions for linear algebra, statistics,
Fourier analysis, filtering, optimization, and numerical integration.MATLAB has vast number of features for displaying vectors and matrices as graphs, as well as it provides features for adding comments and printing these graphs. High-level functions are used for two-dimensional and three-two-dimensional data visualization, image processing, animation, and presentation of graphics [13]. MATLAB uses two basic methods to access scientific data, one is using MATLAB GUI plotting tools to interactively create graphs and the other way is to use command interface by entering MATLAB graphics commands in the Command Window.
2. Ferret
To satisfy the needs of oceanographers and meteorologists Ferret is designed which is an interactive computer visualization and analysis tool for analyzing large and complex gridded data sets. Ferret was developed by the Thermal Modeling and Analysis Project (TMAP) at PMEL in Seattle to analyze the outputs of its numerical ocean models and compare them with gridded, observational data [14]. Some of the main features of Ferret are mathematica-like flexibility, geophysical formatting, "intelligent" connection to its data base, memory management for very large calculations, and symmetrical processing in 6 dimensions.
It runs on recent Unix and Mac systems, using X windows for display. In 2012, there is an introduction of PyFerret which is a Python module embedded in Ferret. The PyFerret module provides Python functions so Python users can easily take advantage of Ferret's abilities to retrieve, manipulate, visualize, and save data. Ferret provides mathematica-like approach to analysis, where we can define new variables as mathematical expressions involving data set variables. Using a single command fully documented graphics can be produced.
3. ArcGIS
ArcGIS is a geographic information system (GIS) for working with maps and geographic information. It is used for creating and using maps, compiling geographic data, analyzing mapped information, sharing and discovering geographic information. It manages geographic information in a database. It provides platform for an organizations to create, manage, share, and analyze spatial data. It consists of server components, mobile and desktop applications, and developer tools.
web UI and APIs for publishing, sharing, and managing content, maps, and applications.
4. GrADS (Grid Analysis and Display System)
It is an interactive desktop tool used mainly for easy access, manipulation, and visualization of earth science data [16]. Two data models has been used to handle gridded and station data. GrADS supports various data file formats, including binary (stream or sequential), GRIB (version 1 and 2), NetCDF, HDF (version 4 and 5), and BUFR (for station data). It has been implemented worldwide on a variety of commonly used operating systems and is freely available over the Internet. It uses a 5-Dimensional data environment: the four conventional dimensions (longitude, latitude, vertical level, and time) plus an optional 5th dimension for grids that is generally implemented but designed to be used for ensembles. GrADS handles grids that are regular, non-linearly spaced, Gaussian, or of variable resolution. GrADs uses FORTRAN commands to perform operations. It provides various built-in functions, but users may also add their own functions as external routines written in any programming language. Various graphical techniques are used to display data and they are: line and bar graphs, scatter plots, smoothed contours, shaded contours, streamlines, wind vectors, grid boxes, shaded grid boxes, and station model plots. Graphics may be output in PostScript or image formats.Using scripting language GrADS allows for sophisticated analysis and display applications and it uses scripts to display buttons and drop menus as well as graphics, and then take action based on user point-and-clicks.
D. Climate Database
Earlier historians have collected and recorded information about weather and this type of information has been contained within huge array of other kind of information. This kind of information was mainly stored in national libraries and achieves. In earlier days weather records were stored in manuscript form and were kept in the form of daily, weekly or monthly journals. Special notes were taken for catastrophic events such as abnormal wind speeds ,high or low temperatures, extreme rainfall or drought, dates of freezing, Cyclones, and tornadoes[17].All these works were done manually and the person responsible for an observation used to sign or seals the logbook and he is authorised to all these records and serves as the personal source of the recorded history.
After twentieth century most of the weather information has been transmitted digitally to centralized national collection centres. The rapid advances in computer technology lead to collection, transmission, processing and storage of operational meteorological data. Meteorological archives are being populated with data that have never been recorded on paper. These technological improvements
and the ability to record and transfer information electronically, and the development of electronic transfer mechanisms such as the Internet has given new tools so that climatologists can rapidly improve the understanding of climate.
Before the data has been sent electronically, processing and management of data is very essential. The main aim of managing climate data is to capture, preserve, and provide access to climate data and related products to be used by planners, decision makers and researchers. Climate data are collected from wide array of new instruments and systems, including satellites, radar systems and other remote-sensing devices, thus making effective and comprehensive climate data management systems essential for modern climate centres. In this section we have highlighted on importance of using oracle databases for achieving climate data.
1. Oracle Database for maintaining Climate Data: Climate data comes from various weather stations throughout the region. Each weather station has sensors to measure different parameters such as pressure, humidity, temperature etc. Oracle database is one of the most popular databases for storing and maintaining climate data. Weather stations are examined regularly; data is processed and stored in an Oracle database that contains millions of records. The NetBeans Platform can be used to store and process the data. Data source is specified for each weather station. After the configuration, weather stations process the data in multiple threads, so as to reduce data latency and it is measured by a data logger.
In order to monitor the process, applications use pause and play symbols, showing the details such as which threads are working and the time spent on processing weather data. Graphical view is used to visualize the data. The central part of oracle database contains data dictionary whereas as lateral part contains PL/SQL programs. Procedures are used for data insertion, updation and parameter computation. In order to facilitate huge data insertion into database, oracle provides SQL Loader utility. This loader does not support huge data updating. To avoid this problem, PL/SQL programs were developed for huge data insertion, updation and quality check [18].
IV. ARCHITECTURE OF CLIMATE DATA ANALYTICS
and simulations. This requires the use of computationally efficient, sophisticated and expensive high performance computing which is achieved through Super-Computers [18].The advent of Big Data Technologies [19] and Big Data analytics [20],has provided the cost-effective solutions to these problems. In this section we briefly discuss about the architecture a platform and how it is useful for Big Climate Data Analytics and as well as processing of huge size of output data in an integrated way.
If we consider various climate models such as MM5, GCM, WRF, NHM (Non-Hydrostatic Regional Model) etc. used for different range of weather predictions, will generate large 4 dimensional variable datasets. These data ranges from terabytes to petabytes in size, which is considered to be ‘Climate Big Data’. One of the most challenging task is to efficiently store, manage and analyze these vast data size in order to extract meaningful science from them [3]. Apart from the data size, there are other challenges such as format of storing data, language, tools and platform needed to analyse the data which is often nonstandard. For example NetCDF is one of the most feasible languages to operate on climate data. It is most commonly used by climate modellers and scientific communities, although not commonly used in industries. Various programming languages with NetCDF libraries are available to operate on the climate data.
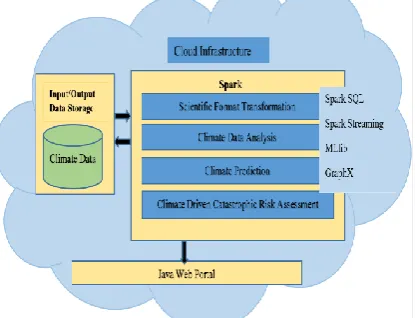
Also there is a resource allocation problem for scientist who deals with huge data size. They have to download the data in parts, analyse each part and then repeat the process for all such parts of interest. Then finally analysis results have to be combined and get a bigger picture from them. This entire process is very much time consuming and difficult. The discovery of Big Data technology such as SPARK, help us to overcome such problems. Spark provides integrated platform with huge memory for storage and also offers capability to adapt to various programming paradigms. The fig. 1 shows the architecture of Spark platform hosted in cloud infrastructure along with huge data storage.
Fig. 1: Schematic diagram showing the architecture of Spark Platform hosted in Cloud for climate data analytics.
The input accessible to Spark platform is climate data which is stored in Data Storage available in cloud infrastructure. Spark is developed by Apache Software Foundation. Spark is typically deployed in a distributed cluster environment and it is designed to supports various programming languages like Java, python, scala, SQL as well as analytical tools like Apache System ML (for machine learning), GraphX (for graph computing)[3]. Spark SQL is used to deal with structured data and it supports various SQL queries with more difficult, algorithm based analytics. Spark Streaming supports scalability and fault-tolerant processing of streaming data. These tools and languages are very much helpful to perform scientific format transformation (from NetCDF to CSV formats), climate analytics, and climate prediction and risk assessment. Such an analytics will provide output which are also stored in the Data Storage and can be accessed through web portal for visual display of results. Thus end-to-end climate analytics from data assimilation to personalized climate prediction can be achieved with the help of Spark platform.
V. CONCLUSIONS
It is very much essential to address the problem of understanding, managing and thus adapting to changing climate. So we require good action plan which depends on accurate, real-time predictive and customary Big Data analytics. Thus understanding various aspects of Big Data analytics is one of the key components in scientific computing. Although there are various sources through which we can gather climate related data. Interdependence and correlation among these data can be understood easily with the help of Big Data Analytics. In order to pacify the impacts of climate change, many of the government organizations, industries and other stakeholders are using climate phenomena and dynamics of weather as a tool.
Currently the need of scientific computing can be fulfilled with the help of HPC super computers or through cloud based distributed computing platform which is typically used in Big Data Analytics. In this paper we have discussed various aspects which are very much essential to do Big Data Analytics in climate science domain. In order to deal with climate related Big Data, we should first know the format in which data is stored. Also the information related to mathematical models used for simulation of climate data for various range of prediction is also considered. The possible visualization tools available currently and importance of using oracle database for storing climate data is also discussed. Finally we have given an insight on importance of using Apache Spark platform for performing climate data analytics.
REFERENCES
Framework for Climate Services: Reviewing geospatial solutions to efficiently share and integrate climate data & information, Journal of Climate Services, ScienceDirect, August 2017, http://dx.doi.org/10.1016/j.cliser.2017.08.003. [2] Albert M.G., Klein Tank, Francis W. Zwiers, Xuebin Zhang,:
Guidelines on Analysis of extremes in a changing Climate in support of informed decisions for adaptation, Research report, World Climate Data and Monitoring Programme (WCDMP) (2009), Report No. WCDMP-72.
[3] Subarna Bhattacharyya, Detelina Ivanova: Chapter 6-Scientific Computing and Big Data Analytics:Application in Climate Science, ebook on Distributed computing in big data analytics: concepts, technologies and applications, Springer (August 2017), ISBN 978-3-319-59834-5.
[4] Climate Data Management System Specification, World Meteorological Organization (WMO) 2014, WMO-No. 1131, ISBN: 978-92-63-11131-9.
[5] J.L.Schnase, Daniel Q Duffy, Glenn S Tamkin :MERRA Analytic Services: Meeting the Big Data challenges of climate science through cloud-enabled Climate Analytics-as-a-Service, Vol. 61, Journal of Computers, Environment and Urban Systems ,January 2017, Part B pp. 119-212.
[6] S.Fiore, A. D’Anca, C. Palazzo,I. Fosterc, D. N. Williamsd, G. Aloisio: Ophidia: toward big data analytics for eScience, International Conference on Computational Science, Vol. 18, Journal of Procedia Computer Science, 2013, 2376-2385 [7]
https://climatedataguide.ucar.edu/climate-data-tools-and-analysis
[8] http://ccir.ciesin.columbia.edu
[9] Junhua Yang, Keqin Duan, Effects of Initial Drivers and Land Use on WRF Modeling for Near-Surface Fields and Atmospheric Boundary Layer over the North eastern Tibetan Plateau, Vol. 2016, Research Article-Advances in Meteorology, Article ID 7849249, Hindawi Publishing Corporation , 2015.
[10] Shiyuan Zhong, Hee-Jin In, Xindi Bian, Joseph Charney, Warren Heilman, Brian Potter: Ealuation of Real-Time High- Resolution MM5 Predictions over the Great Lakes Region, Vol. 20, Journal on Weather and forecasting , Feb 2005, pp. 63-81.
[11] Venkata Bhaskar Rao Dodla, Satyaban Bishoyi Ratna,
SrinivasDesamsetti: An assessment of cumulus
parameterization schemes in the short range prediction of rainfall during the onset phase of the Indian Southwest Monsoon using MM5 Model, Vol. 120–121, Journal of Atmospheric Research, Feb. 2013, pp. 249-26.
[12] T.Nocke, T. Sterzel, M.Bottinger, M. Wrobel: Visualization of Climate and Climate Change Data: An Overview,
ResearchGate , 18 August 2014.
https://www.researchgate.net/publication/241401725. [13]
http://www.bu.edu/tech/support/research/training-consulting/online-tutorials/visualization-with-matlab/ [14] http://apdrc.soest.hawaii.edu/tutorials/client.php [15]
https://developers.arcgis.com/documentation/core-concepts/what-is- arcgis/ [16] http://cola.gmu.edu/grads/grads.php
[17] Guide to climatological practices-chapter 3: climate data management, World Meteorological Organization (WMO) (2011), WMO-No.100, ISBN 978-92-63-10100-6.